GrafanaCONline 2021 Day 3 recap: Grafana Tempo deep dive, plus how Grafana helps grow e-commerce, scale NFT platforms, and more!
Welcome to week 2 of GrafanaCONline 2021!
There are three more days of programming that you can tune into live by registering here. You will also be able to watch all the videos on demand after GrafanaCONline ends on June 17.
Here’s what you missed on Day 3 of GrafanaCONline:
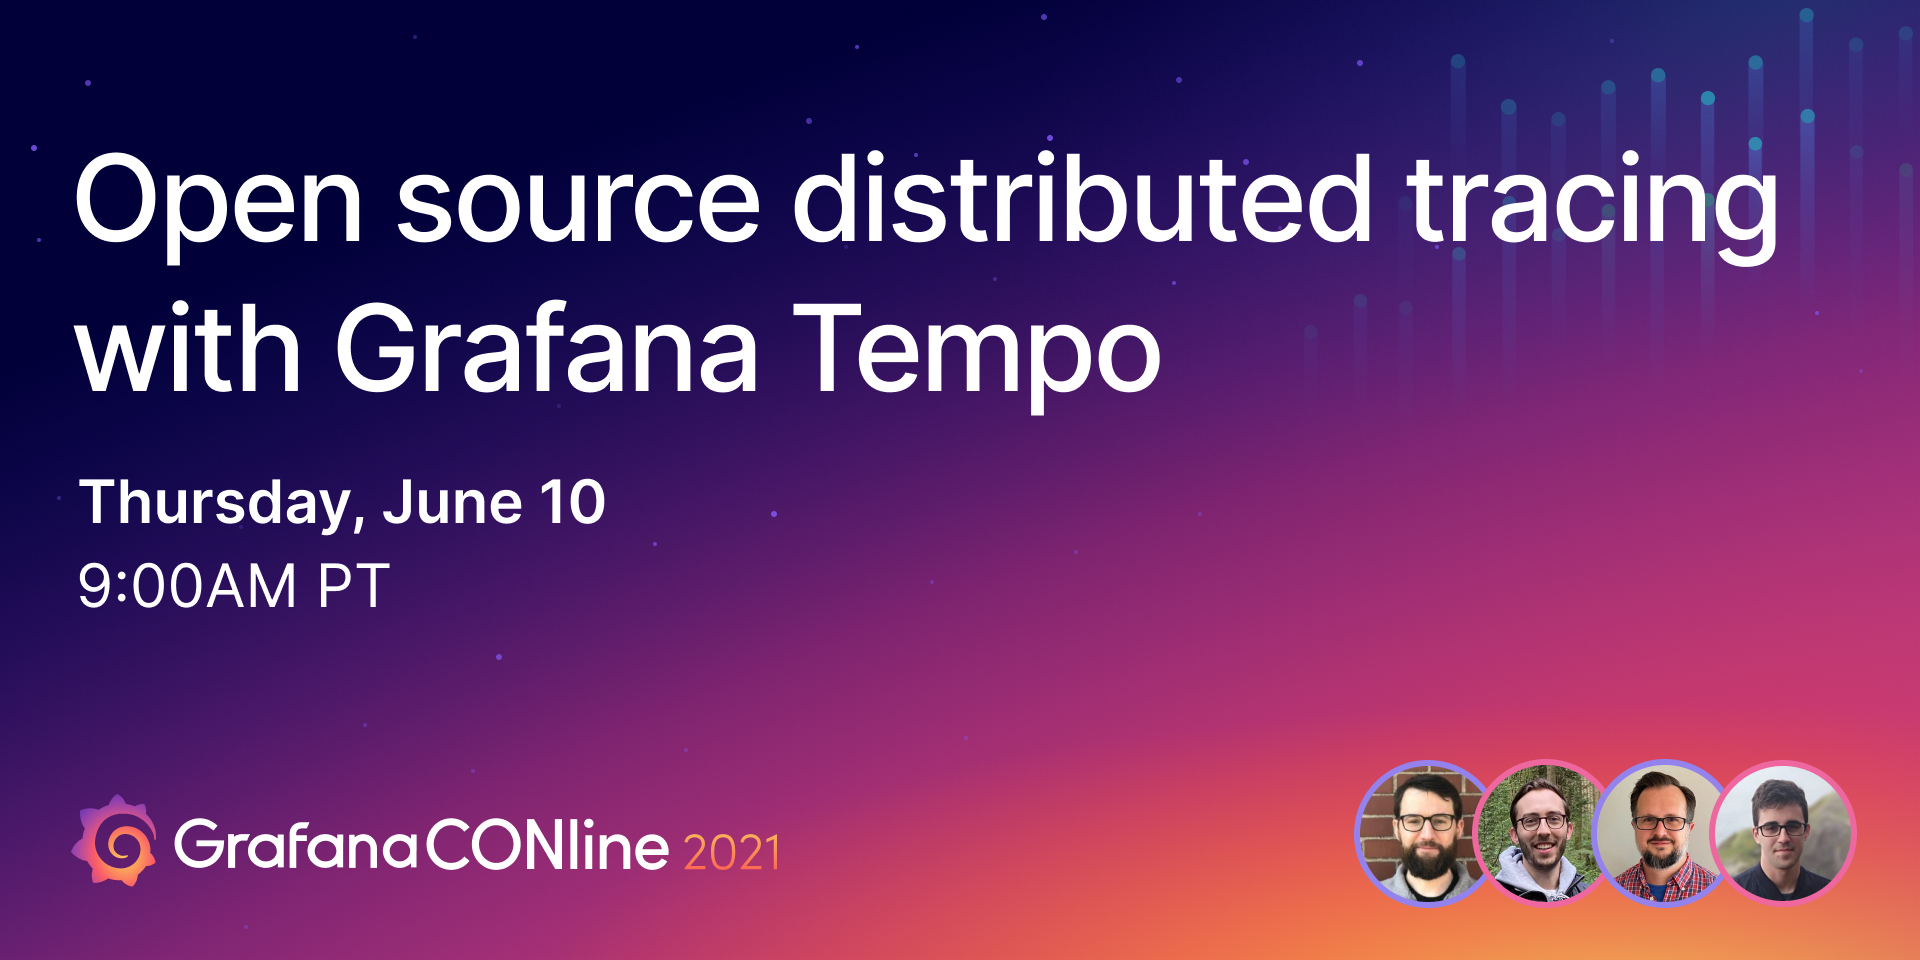
Open source distributed tracing with Grafana Tempo
The Grafana Tempo maintainers showcased what they’ve been working on since Tempo was announced last fall. Principal Software Engineer Joe Elliott gave an overview of how quickly Tempo has scaled, now running 2M spans/s with 74 billion traces in the backend. The team has also added more stability and improved Tempo’s efficiency 4x. (Read more in the Tempo v1.0 release blog, and get started with Tempo easily with Grafana Cloud, which includes 50GB of traces in the free tier. Sign up for a free trial here.)
Software Engineer Mario Rodriguez then walked through the latest features including how the Grafana Agent fits into the tracing pipeline, autologging, generating metrics from spans, and tail samples. Software Engineer Callum Styan stepped in to discuss the state of exemplars and demonstrated the current exemplar query flow from Grafana Explore. Finally, Senior Software Engineer Marty Disibio previewed some upcoming Tempo features such as native search based on a full-featured query language similar to PromQL or LogQL, long-term storage for exemplars, and adding service graphs.
The session will be available on demand here.
Monitoring global e-commerce Magento sites with Grafana and Loki
Pernod Ricard, a leader in the wine and spirit industry, has scaled its e-commerce business to run 30 Magento websites across the globe. Their e-commerce stack is deployed on AWS over four different regions, containerized and orchestrated with ECS. Grafana and Loki are used for monitoring and logging — not to mention keeping customers satisfied as business is predicted to grow by 23% by 2023. In this session, Pernod Ricard Head of IT Architecture & Innovation Laurent Bel, IT Solutions Architect Hakim Rouatbi, and Digital Commerce IT Manager Tony Khosravi uncorked the details behind their infrastructure starting with a high-level view of their stack followed by a deep dive into individual components such as CloudFront real-time log streaming to Loki and CloudWatch monitoring integrated with Grafana.

The session will be available on demand here.
Predicting air quality (and pollution) with Grafana
A computer science and maths graduate from Leeds Beckett University in the U.K., Jodie Barnsley wanted to make an impact in healthcare with her final master’s project. The result? Her dissertation titled “Predictive Modelling for Air Quality in an Attempt to Help Those Vulnerable to Air Pollution,” which used raw real-time air quality data from sensors in the U.K. — and InfluxDB and Grafana — to produce fairly accurate forecasting for the air quality index. Jodie, now a Junior Developer at Aire Logic Limited, presented her methodology and the analysis and prediction dashboards created with Grafana that helped produce her successful outcomes.

The session will be available on demand here.
Lightning talks: 5 quick ways to uplevel your use of Grafana
In this advanced session, Grafanistas shared their expertise to improve your use of Grafana.
- CTO and Co-founder Anthony Woods demonstrated how to connect your dashboards with data links.
- Senior UX Designer Oana Mangiurea talked about Grafana’s efforts to create a more accessible product for all its users.
- Senior Solutions Engineer John O’Brien walked through use cases for using transformations to manipulate data before it’s visualized in your dashboard.
- Director of Professional Services Alex Martin presented a demo on how to deploy Grafana with Tanka and mixins.
- Senior Solutions Engineer Dave Schmid instructed viewers on how to turn your dashboards into flexible and reusable works of art using dynamic variables, valuable links, and powerful overrides.

The session will be available on demand here.
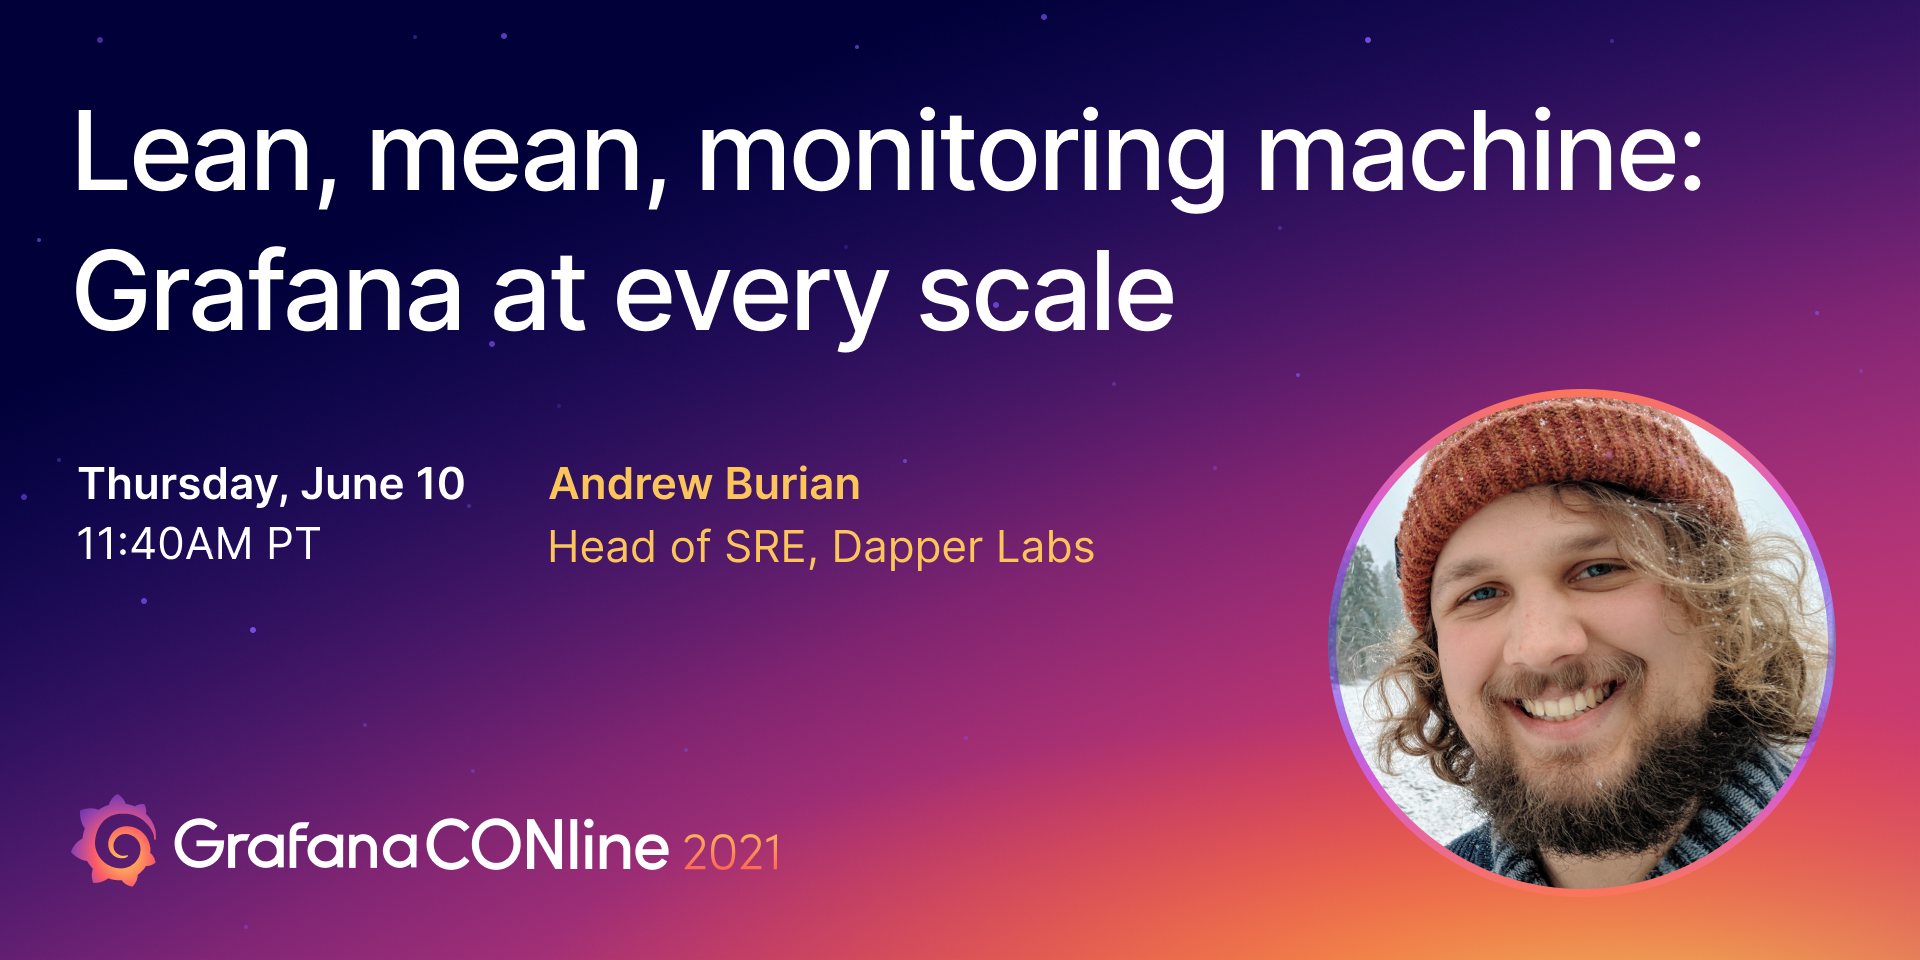
Lean, mean, monitoring machine: Grafana at every scale
Dapper Labs Head of SRE Andrew Burian looked back at how the popular NFT company scaled its observability platform from zero to hero. From a self-hosted Grafana dashboard supporting three developers, Dapper Labs has grown to 3 million metrics per minute streaming to Cortex. While the company’s products are radically different and monitoring needs have changed drastically as business grew 100x, its observability stack has remained consistent through it all with Grafana (with the more recent addition of Loki for logs and Tempo for tracing) — all hosted on Grafana Cloud. This talk covered how Dapper Labs monitors its infrastructure today, what they could have done differently over the years, and what they’ll never do again.
The session will be available on demand here.
Today’s sessions
IoT in Grafana: Real-time streaming, new visualizations, and more, oh my! at 9:00 PT, 12:00 ET, 16:00 UTC with Grafana Labs VP of Applications Ryan McKinley and Software Engineer Atif Ali
Easy DIY IoT projects with Grafana at 9:45 PT, 12:45 ET, 16:45 UTC with Grafana Labs Senior Engineer Manager Ed Welch and Software Engineer Ivana Huckova
Creating value through IoT train sensor data with Grafana at 10:30 PT, 13:30 ET, 17:30 UTC with Siemens Mobility Head of Digital Development and Operations Martin Klimmek and Periscube Director Luke Tutuk
Using Grafana Cloud to drive manufacturing plant efficiency 10:55 PT, 13:55 ET, 17:55 UTC with American Metal Processing President Grant Pinkos
Making environmental data open with Grafana dashboards at 11:20 PT, 14:20 ET, 18:20 UTC with Safecast Site Reliability Engineer Mat Schaffer
Panel: Careers in open source at 11:45 PT, 14:45 ET, 18:45 UTC with Sam Coren, Myrle Krantz, Uchechukwu Obasi, Vicky Lee, and Goutham Veermachaneni from Grafana Labs
Check out the full GrafanaCONline 2021 schedule here.
And don’t forget you can connect with the Grafana community and get the latest updates from the Grafana Labs team during the event on Slack. Sign up here and join the #grafanaconline channel.

