New plugins connect almost all of Redis for monitoring and visualization in Grafana
Mikhail Volkov is building observability and monitoring solutions at Volkov Labs and leading Redis plugins for Grafana.
Since the Redis project first got underway in 2009, the open source in-memory data store has been embraced by thousands of companies of all types and sizes. According to Stackshare.io, well over 5,000 companies use Redis, including Uber, Airbnb, Twitter, Instagram, and Slack. The platform is used as a database or database cache, message broker, and queue, enabling applications like real-time analytics, location-based services, and online advertising campaigns.
Another popular open source tool is Grafana, a visualization and analytics platform. Grafana is designed for creating dashboards that display informational panes drawing data from a variety of sources. The dashboards provide an automated way for a company to collect and view data on the health and activity of its infrastructure, including logging events, querying actions within applications and on networks, tracking how users behave, and so on. It’s commonly paired with time series databases, monitoring platforms, and security information and event management (SIEM) systems in order to observe recorded activities in real time.
Grafana comes with built-in support for a wide variety of data sources. Unfortunately, Redis is not among them. Connecting Grafana to Redis would let companies perform tasks like those mentioned above as well as view such time series as pipelines, queues, financial transactions, sensor data stored as native Redis data types and modules, and many more. Up until now, connecting Grafana to Redis has been a challenging task, with results limited by the connectors available.
Connecting without plugins
One approach to viewing database metrics and application data from Redis on a Grafana dashboard is to use the Prometheus monitoring solution as a bridge. Prometheus is a popular way to collect metrics from time series data, and it can be integrated with Grafana for visualization and display.
Companies can use the Redis Metrics Exporter or the Enterprise Metrics Exporter to extract metrics data from Redis and store it in Prometheus. However, Prometheus only supports a limited number of metrics — fewer than Redis is able to supply. Moreover, the Grafana-Prometheus pairing is primarily designed to show database metrics and requires additional configuration to collect application data.
Connecting with plugins
I’m happy to report that a new suite of plugins opens up almost all of Redis to use as data sources for Grafana.
These plugins allow Grafana to use Redis as a data source as easily as if it were just another built-in source. They let users connect to the Redis databases directly and build dashboards in Grafana to observe — and, if desired, interact with — Redis and application data. With the plugins, you can monitor and observe Redis databases deployed anywhere — on-premises or in any cloud provider.
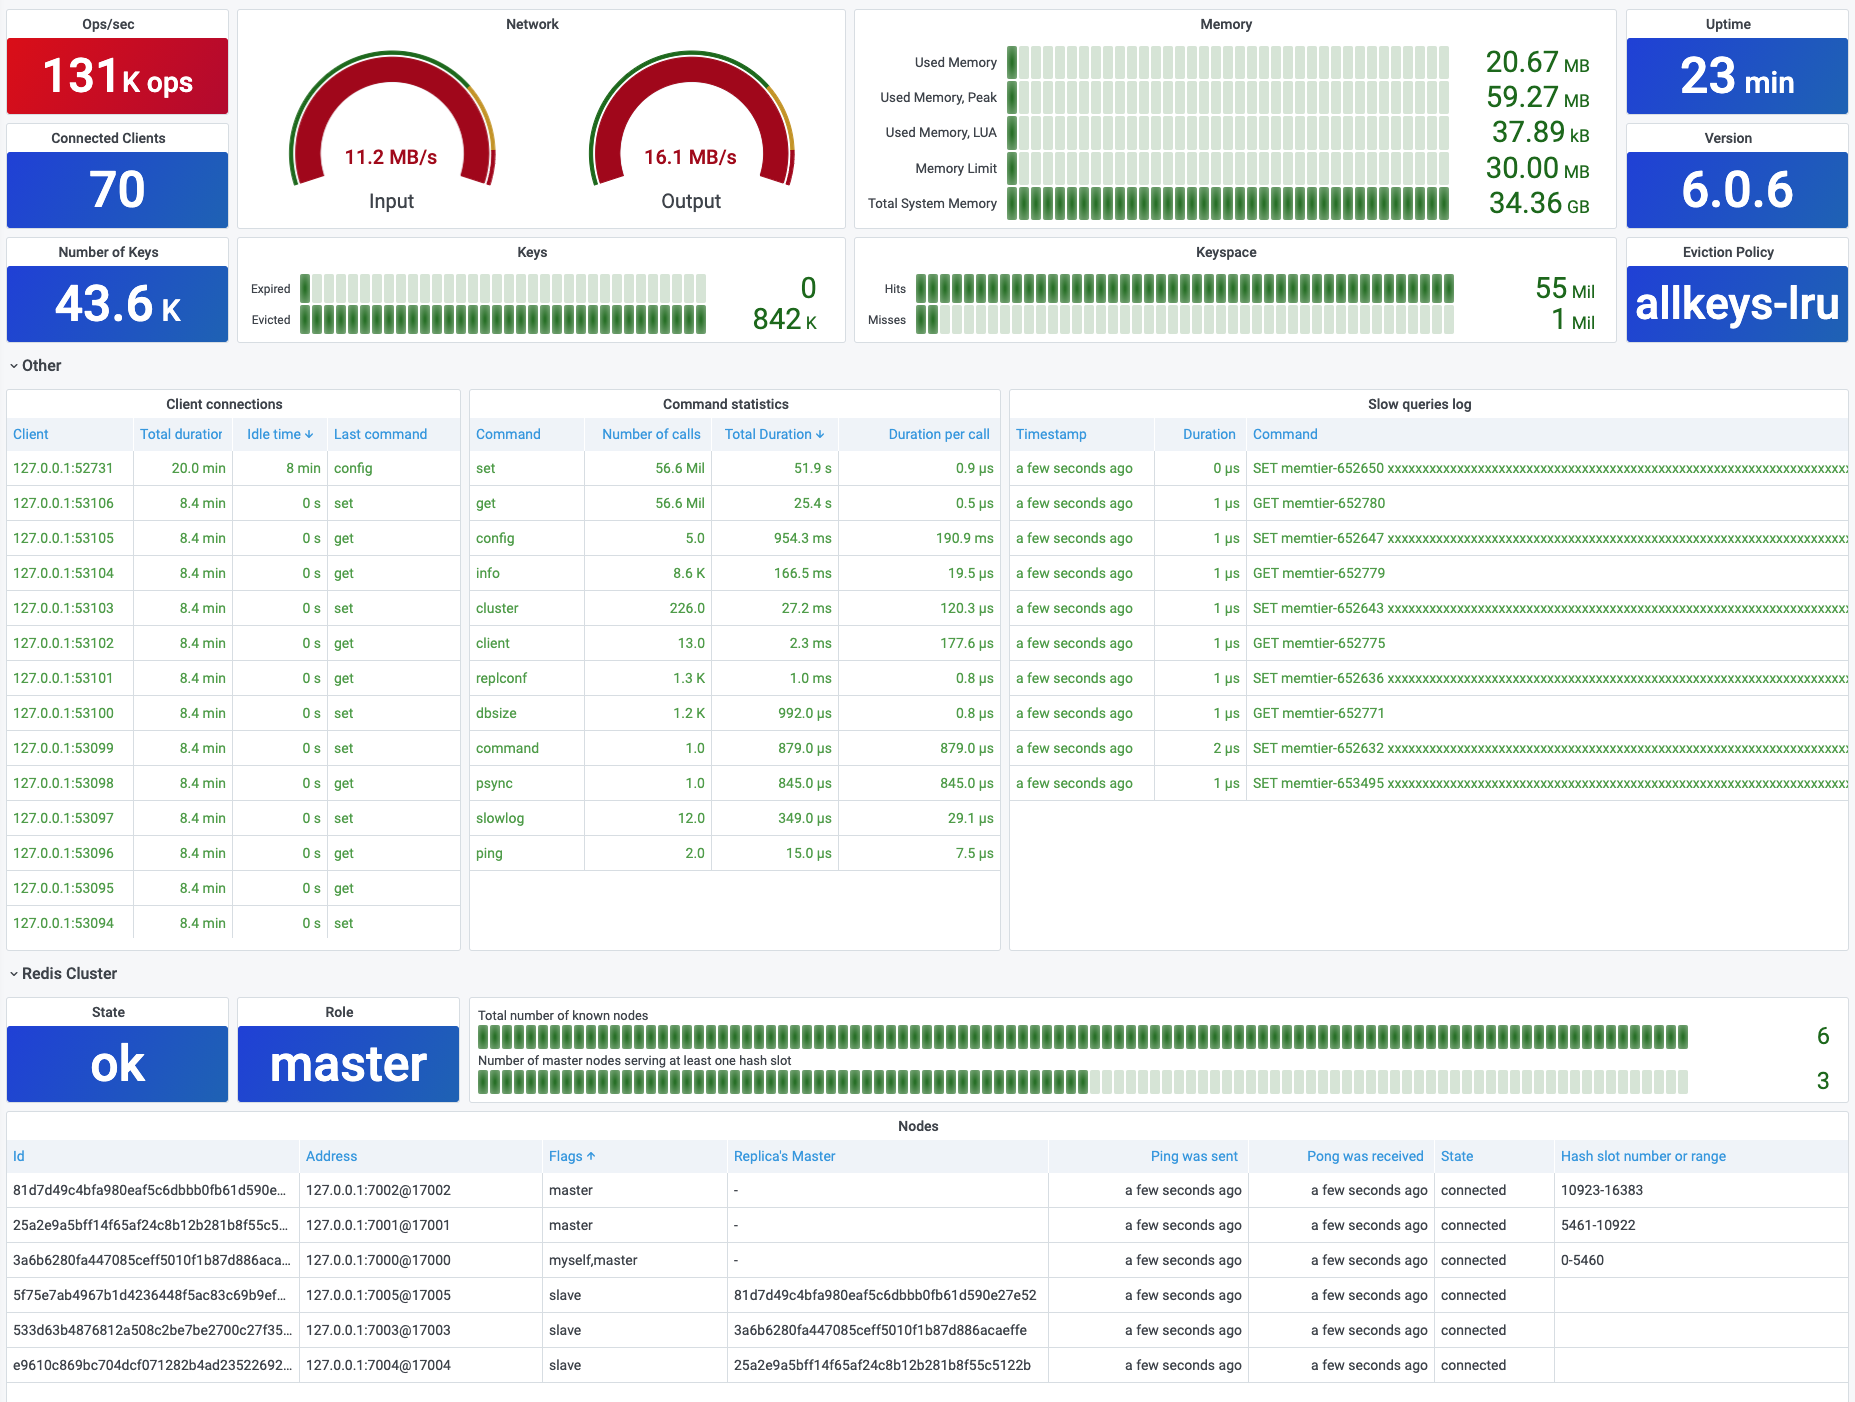
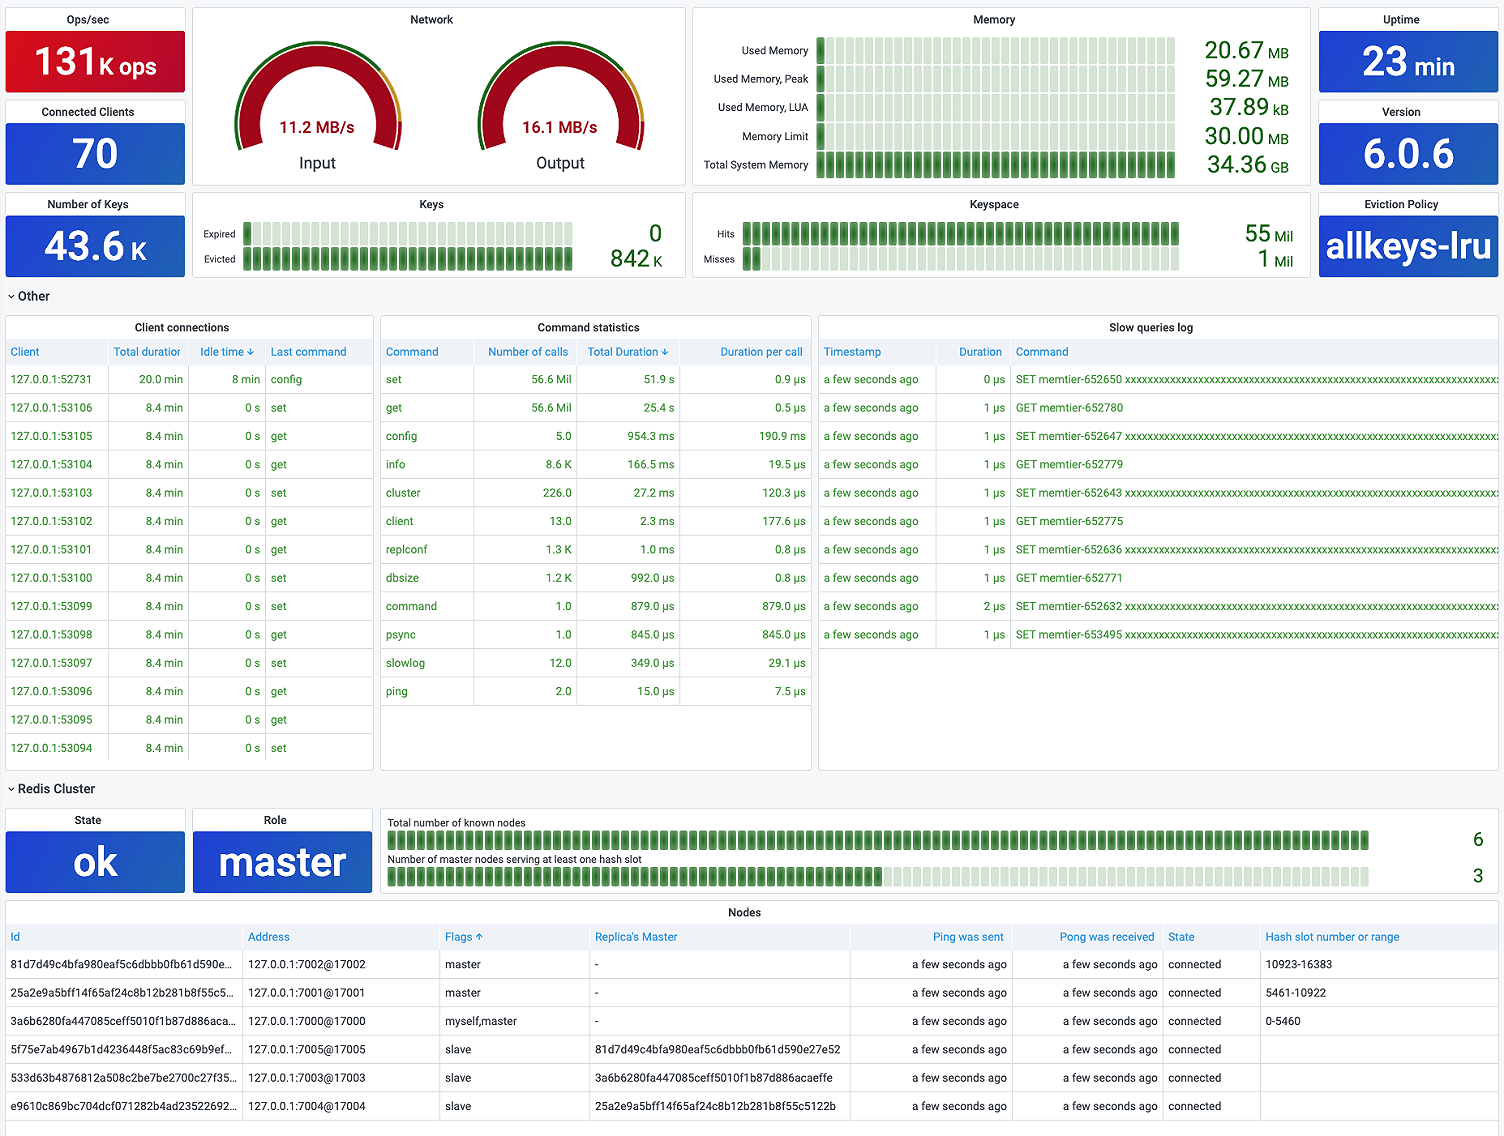
With the Redis plugins for Grafana, you can build a dashboard showing the most important Redis metrics, such as memory and a slow queries log.
The plugins supplement the capabilities of Prometheus, offering support for bringing other types of data extracted from Redis into Grafana and for creating a wider variety of dashboards. Prometheus is used to store historical metrics collected from Redis using Redis Exporter and other collectors. The plugins can access such historical data if it’s saved in Redis, but also monitor and provide Redis data on demand from Redis modules like RedisTimeSeries, RedisGears, RedisGraph, and others. This lets you use Grafana to display additional data from those modules along with metrics. For companies that already use Prometheus, Grafana can combine the metrics data from Prometheus with the additional data from the other modules in the same dashboard.
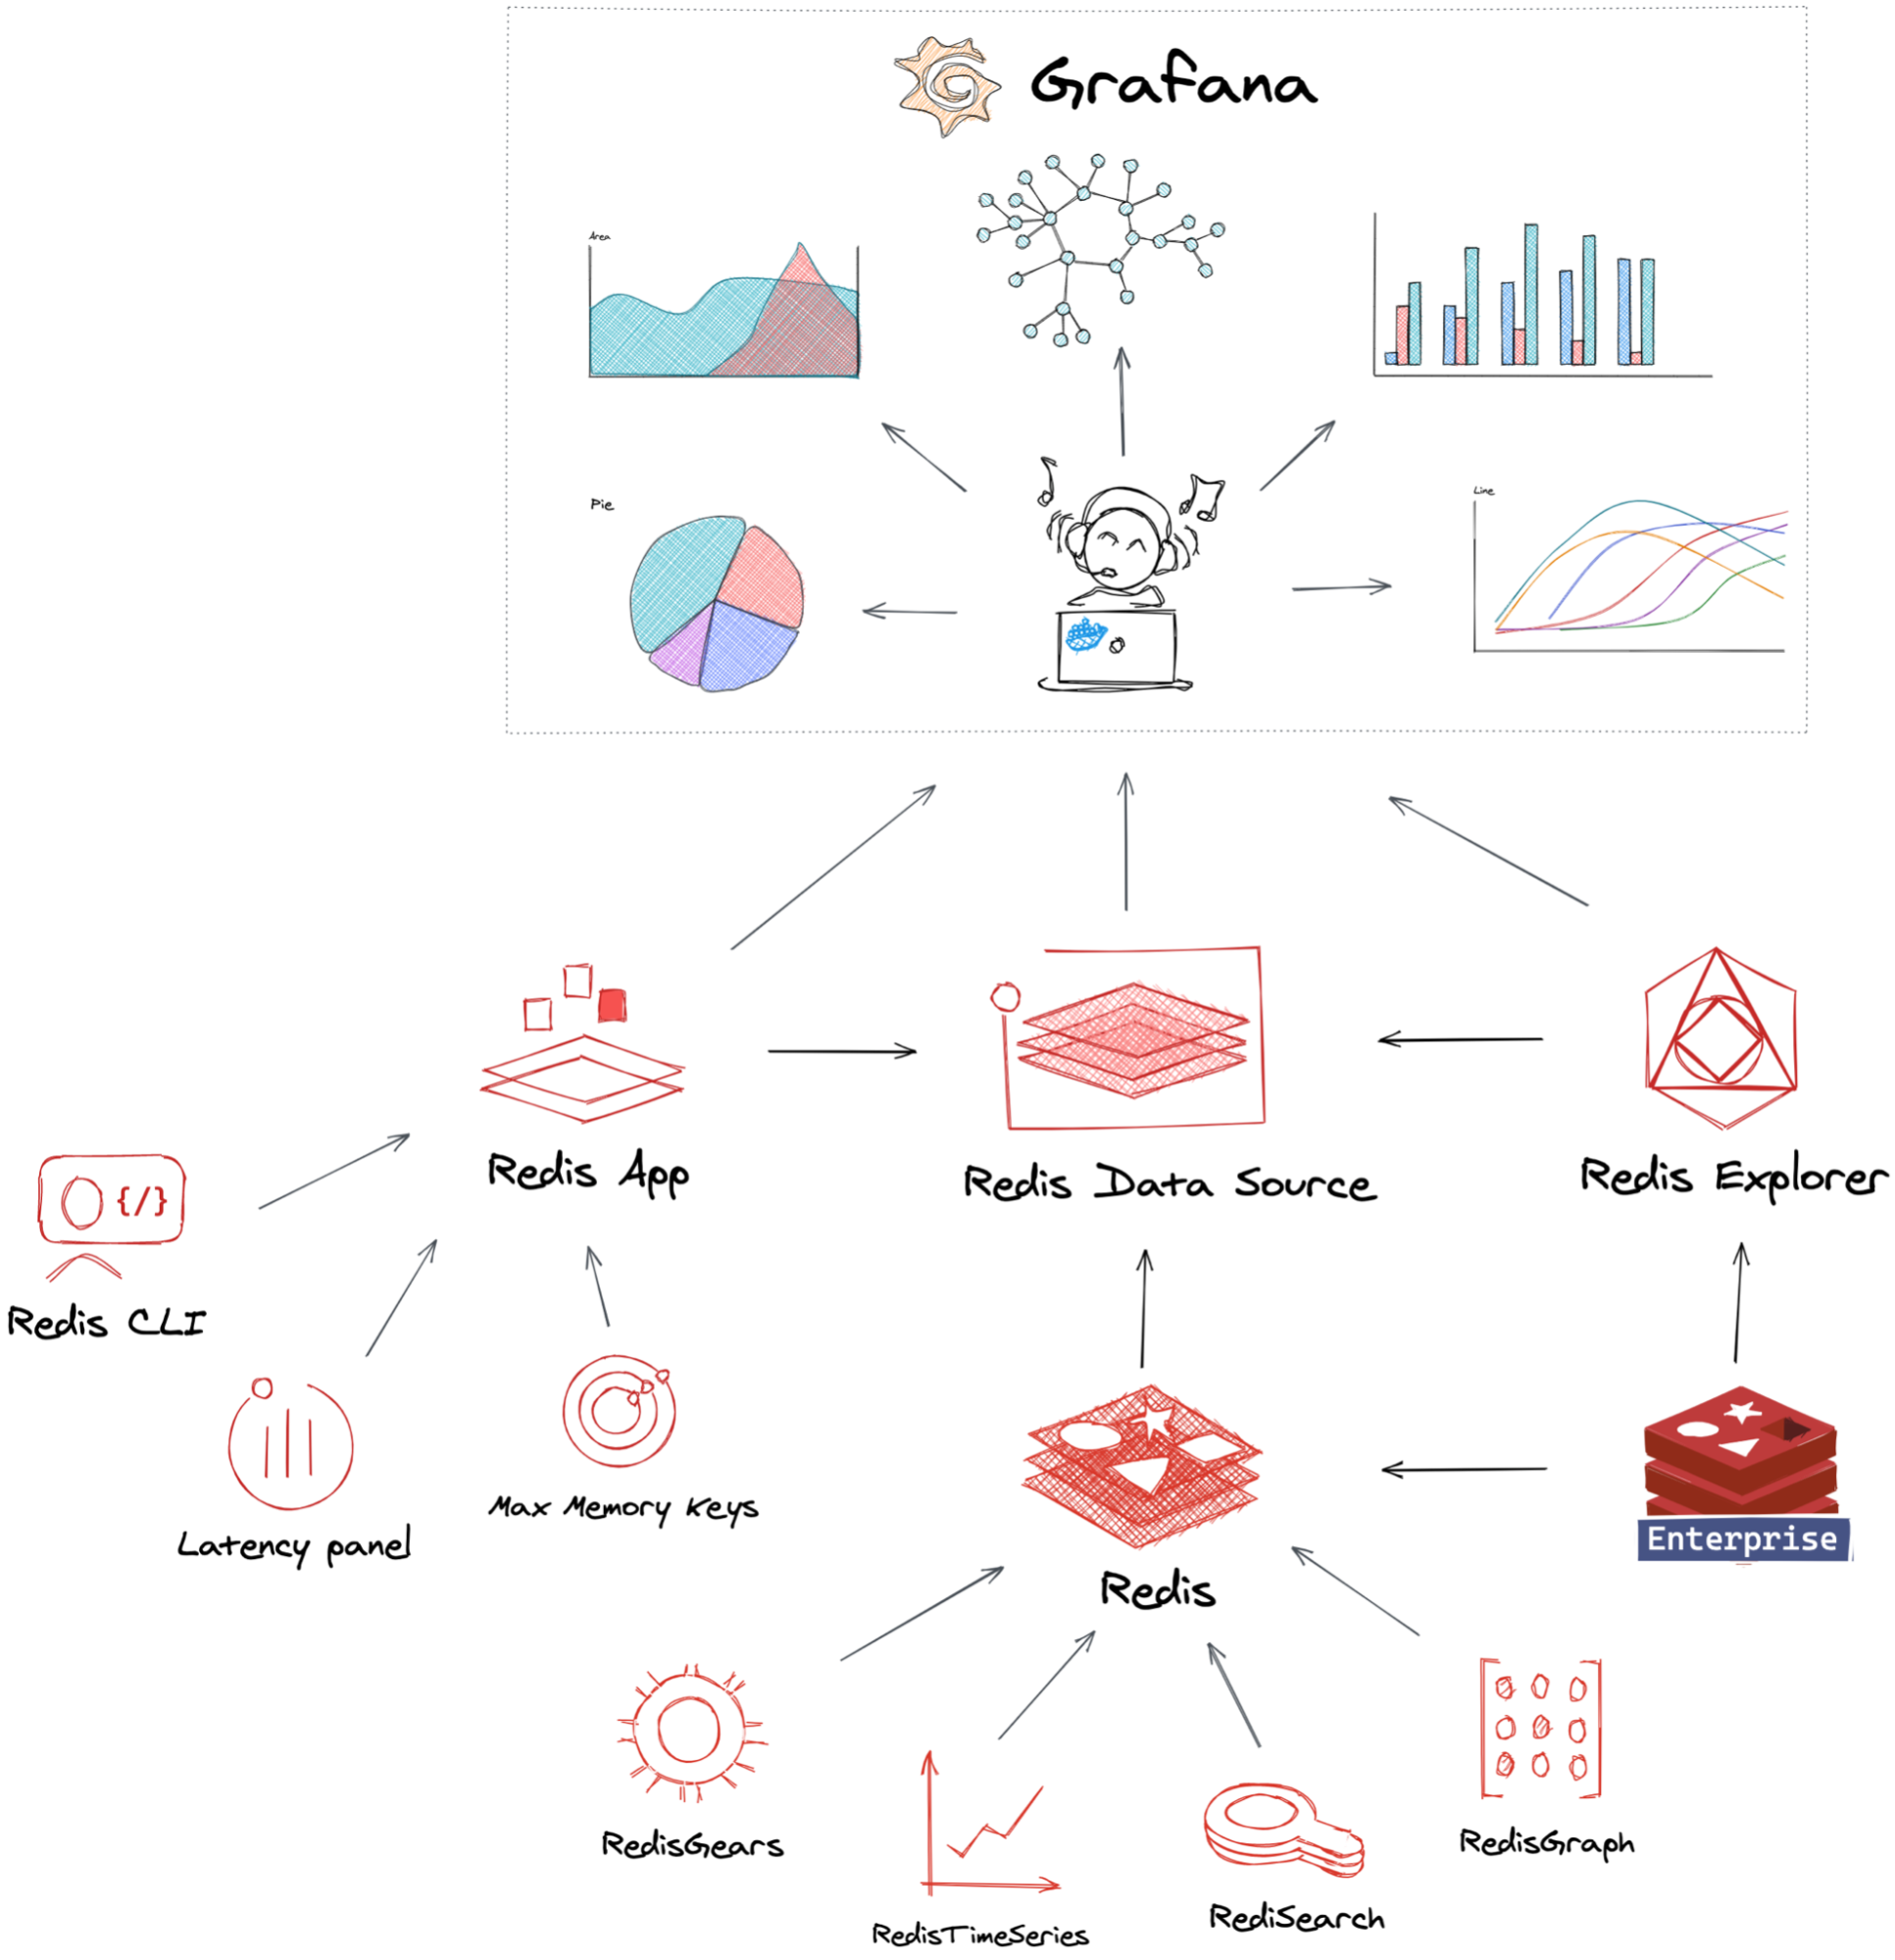
The Redis plugins for Grafana provide ways to pull data from Redis for visualization in Grafana.
The core purpose of these plugins is to access and visualize application-related data. In one scenario, a company could use the plugins to build a dashboard that tracks how its database is performing without regard to content, while a separate dashboard (or a separate panel on the same dashboard) could also track what content is being accessed most often.
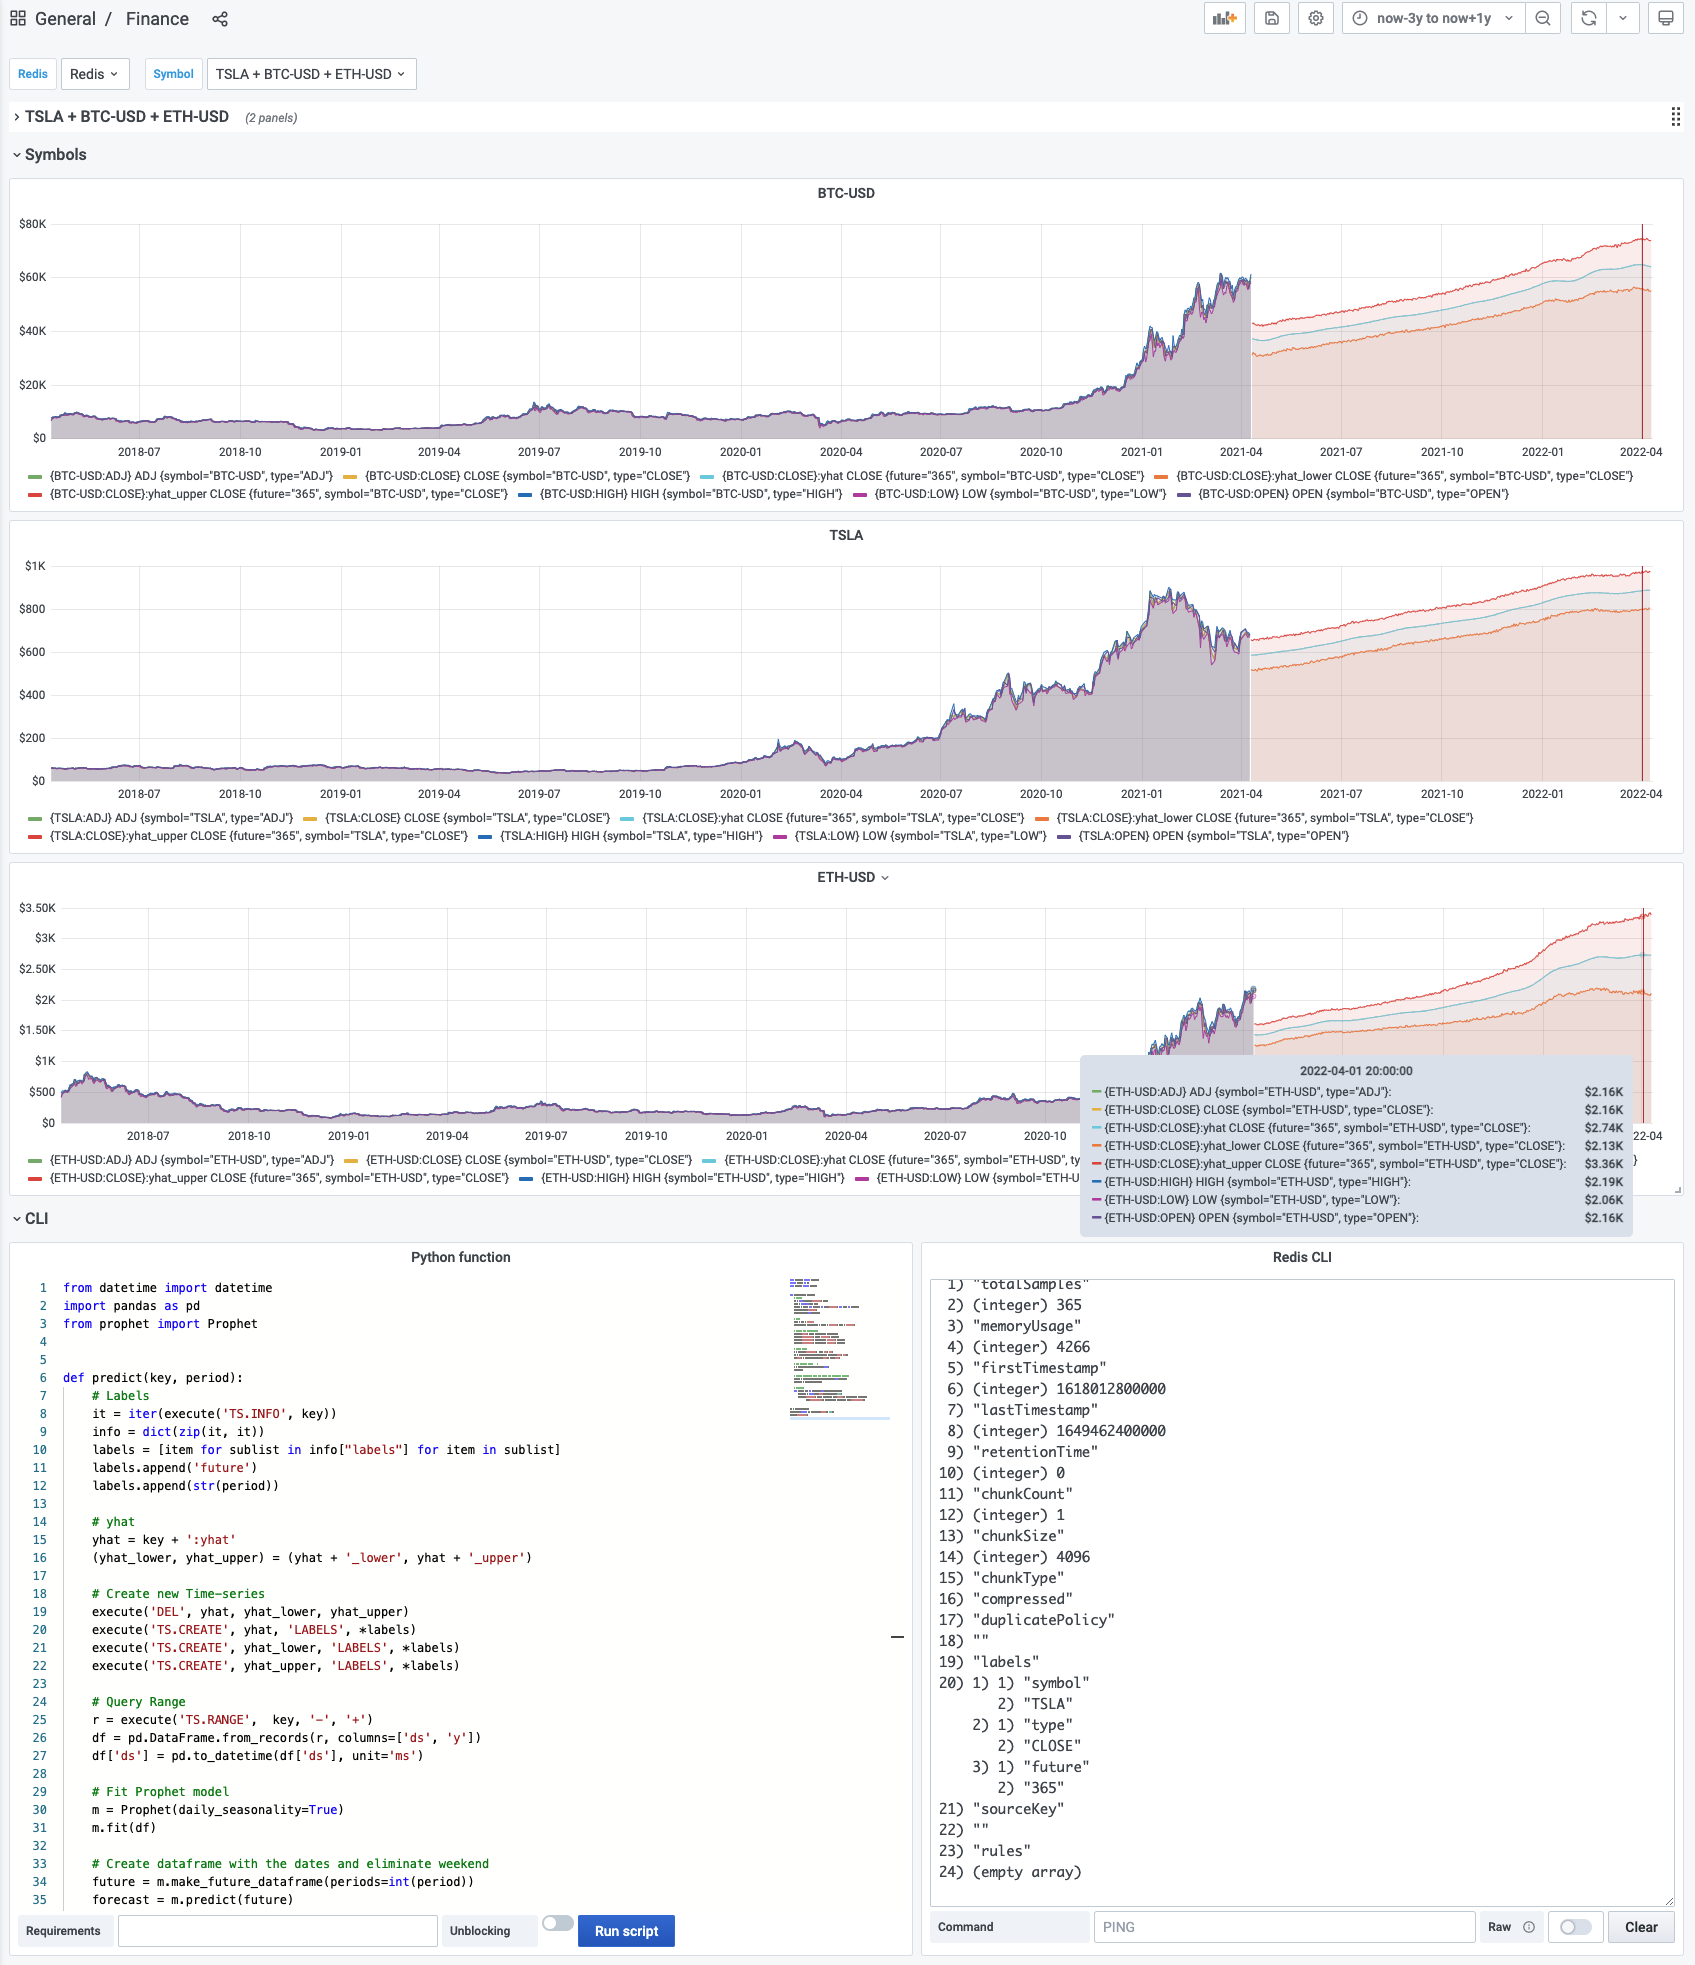
With the plugins, you can use RedisGears, Prophet, and Grafana for forecasting stocks and crypto prices.
This kind of integration could, for example, let a financial services firm build dashboards to observe transaction patterns over time and display the likelihood of fraudulent transactions based on matching them to known patterns. Or a pop-up store could keep track of product availability; how many customers are ordering, how many orders have been completed, and the gap between them; how fast orders are coming in and how quickly they’re being filled; and other critical metrics. This example project is described in greater detail here.

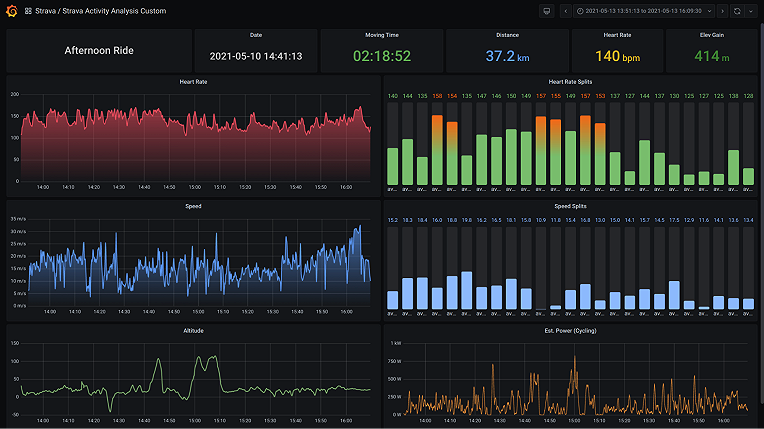
You can use the plugins to visualize real-time data pipelines in Grafana, drawing data from RedisTimeSeries and RedisGears.
The plugin lineup
The Redis plugin ecosystem consists (so far) of three products:
- Redis Data Source is able to connect to Redis open source or Redis databases managed by Redis Enterprise. Redis Data Source provides predefined dashboards; it allows users to monitor Redis data and also supports Redis modules like RedisTimeSeries, RedisGears, RedisGraph, and others.
- Redis Application provides application pages, dashboards, and custom panels for Redis Data Source. It helps users manage Redis Data Sources and provides quick access to Redis Overview, Redis CLI, and RedisGears dashboards. These tools let you build custom panels for Grafana, a capability that only these plugins provide.
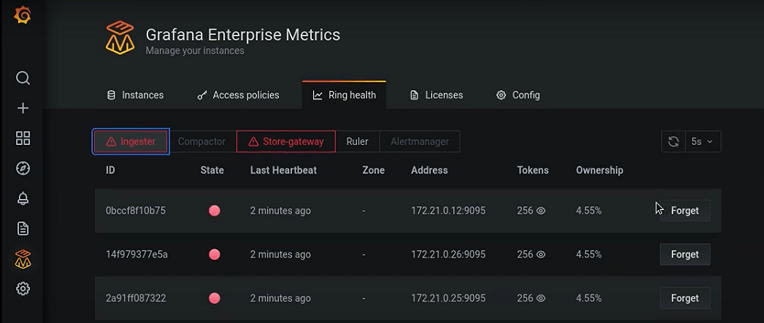
- Redis Explorer is able to connect to Redis Enterprise software clusters using REST API and provides application pages to add Redis Data Sources for managed databases. It also includes dashboards to see cluster configuration, nodes, and databases.
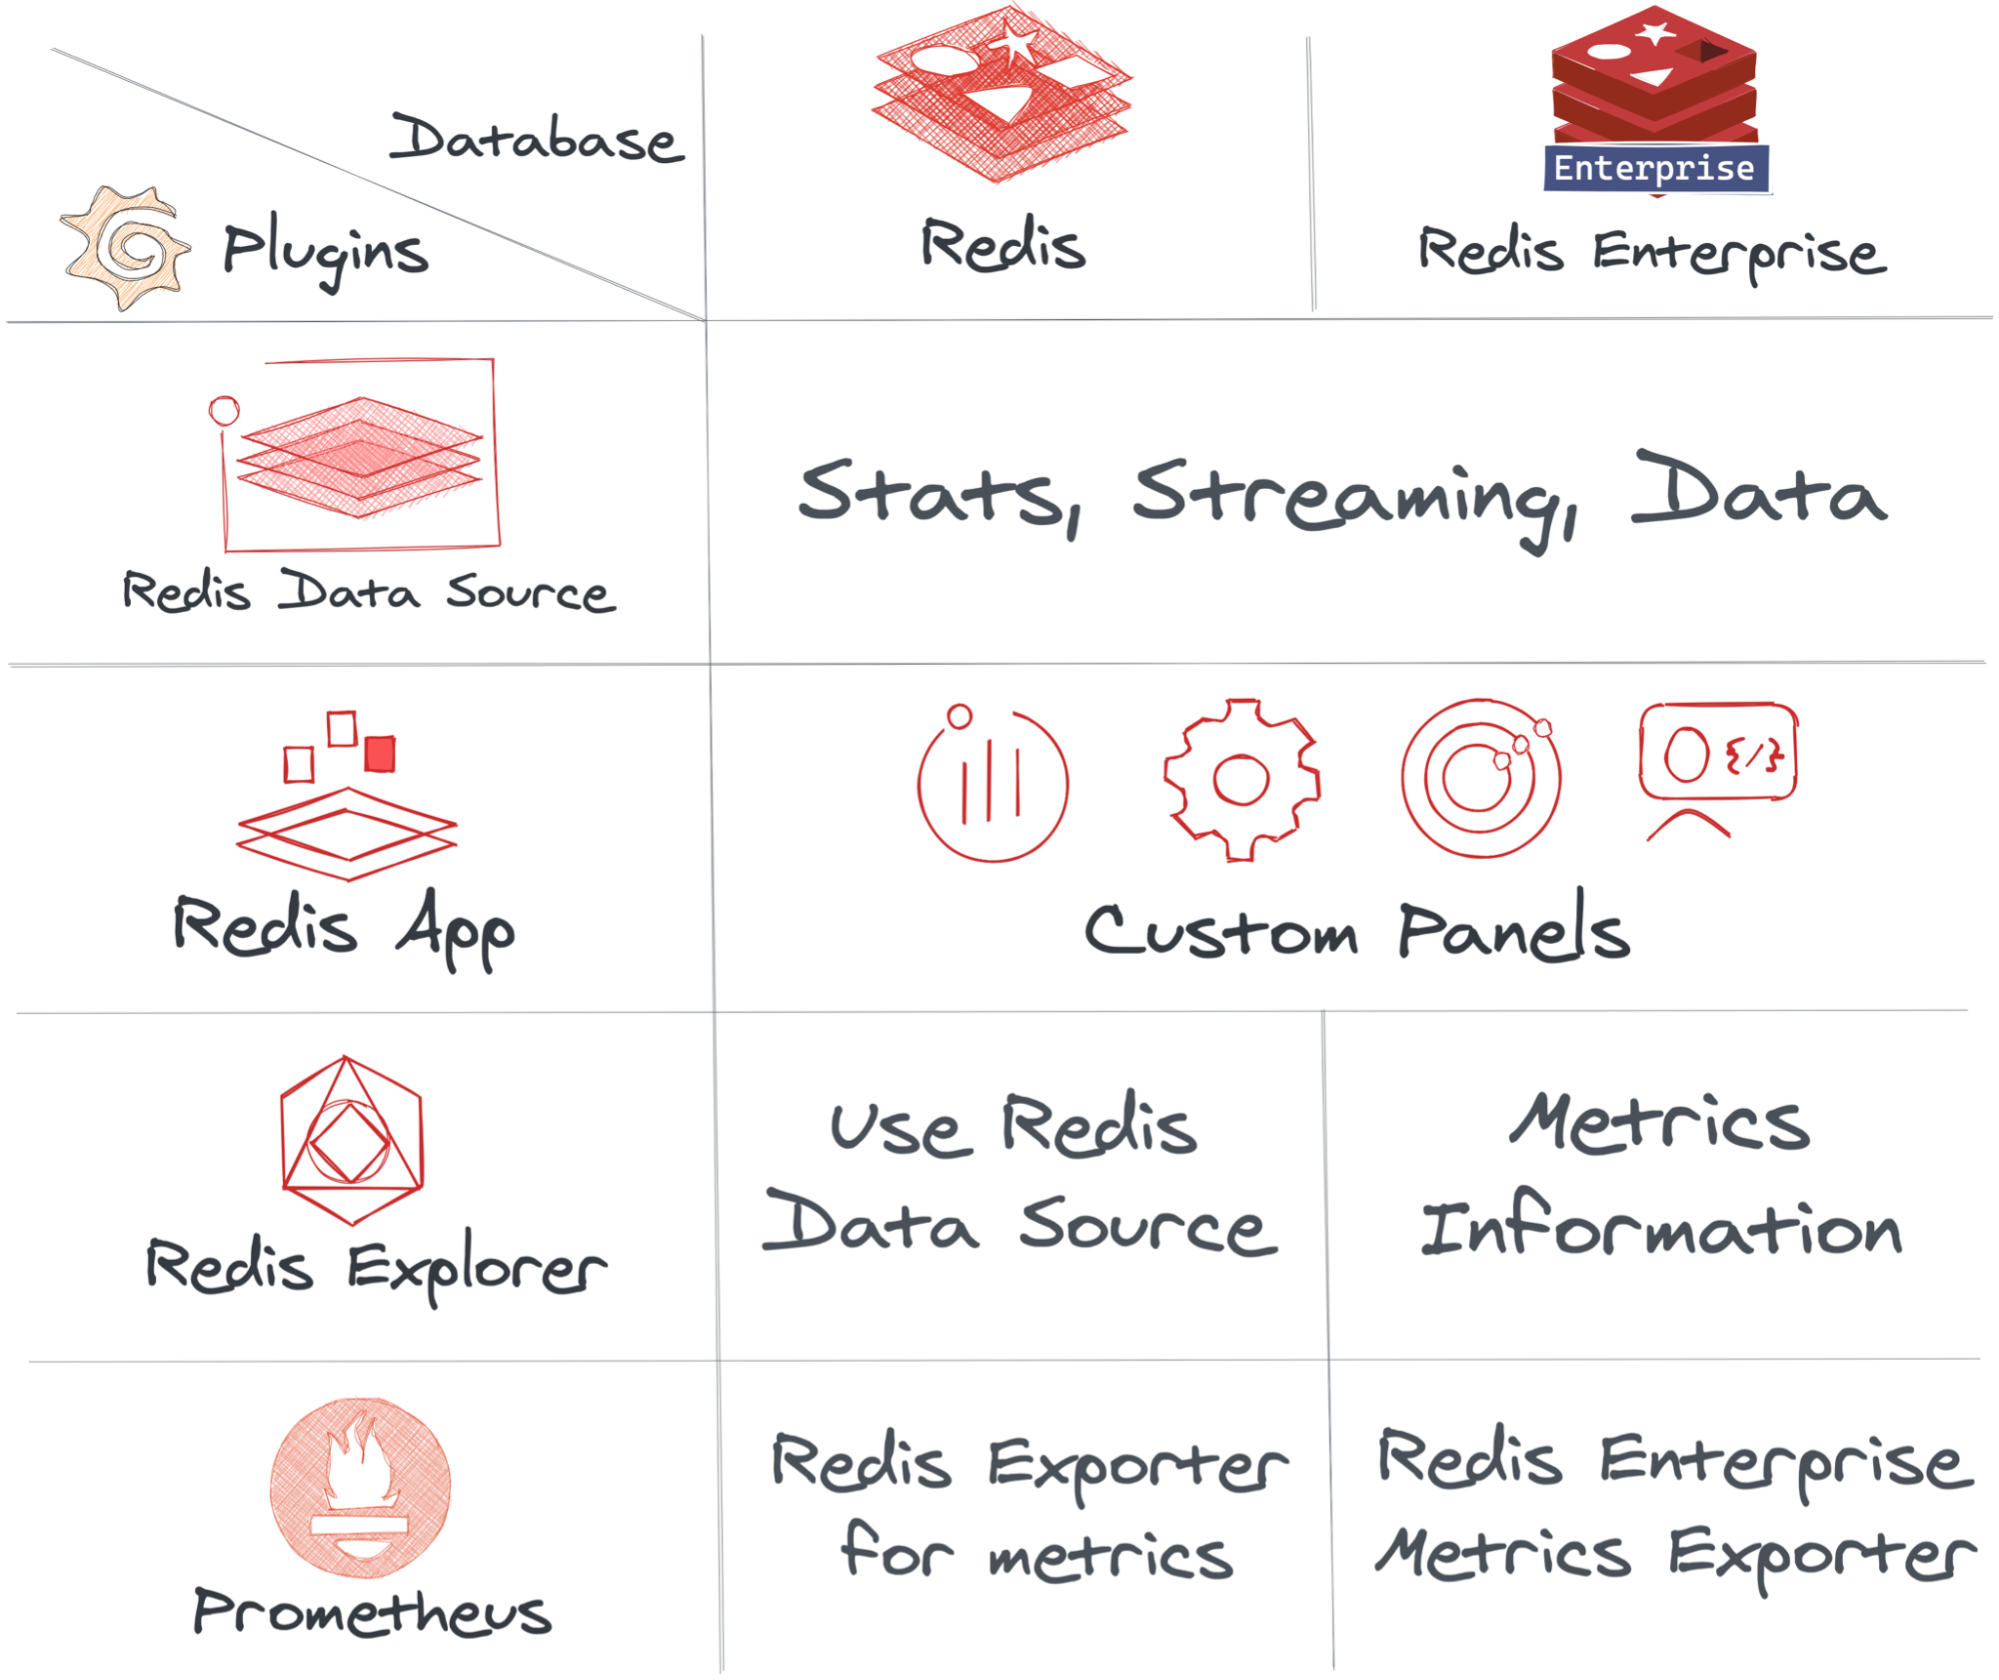
The Redis plugin ecosystem consists of three products that supplement the capabilities of Prometheus.
Summary and takeaways
The Redis plugins for Grafana let you connect Grafana to Redis to visualize more types of data in more ways than otherwise would be possible. They are, for example, the only direct way to stream and monitor Redis application data in real time via a Grafana dashboard.
Furthermore, in addition to providing more functionality and making it easier to visualize Redis data directly in Grafana, the plugins let you achieve everything without having to switch between multiple applications or export data from one application to bring it into another. All the increased functionality comes with a more streamlined workflow.
Want to learn about new and improved data source plugins for Grafana? Tune into Plugin showcase: Building a single pane of observability glass at GrafanaCONline 2021 on Wednesday, June 9, for a demo of Redis plugins and more!