Monitor your production line with the new Grafana Enterprise data source plugin for SAP HANA®
This post has been updated to reflect changes in the availability of the SAP HANA® data source plugin for Grafana Cloud users.
Greetings! This is Abdelkrim from the Solutions Engineering team, and I am with Sriram from the Enterprise Plugin team. We both joined Grafana Labs in February this year, and we already have some stories to share with you.
I came to Grafana Labs from a big data and analytics background, and I witnessed a lot of companies storing monitoring and performance data in all kinds of analytics platforms (data lakes, data warehouses, cloud, etc.). Unfortunately, these analytics platforms are often isolated from the observability platforms, and data cannot be used. So I was super excited when Sriram posted in our internal Slack about his new Grafana Enterprise data source plugin for SAP HANA®. (SAP HANA® is the trademark or registered trademark of SAP SE or its affiliates in Germany and in several other countries.)
SAP HANA® is a high-performance, in-memory database designed for analyzing high-speed transactions. It enables all kinds of use cases where near-zero query latency over a massive data set is required. These real-time query needs are a sweet spot for Grafana as well.
With the data source plugin for SAP HANA®, you can visualize your SAP HANA® data alongside all of your other data sources in Grafana, as well as log and metric data in context. Yet another silo broken and a single-pane view of all your data!
This plugin includes a built-in query editor and supports variables, complex annotations, set alerting thresholds, access control and permissions, and more. Let’s see how we can use it for monitoring the yield and quality of a production factory!

Setup
Setting up the SAP HANA® plugin is simple and straightforward. First, you will need to download and install the plugin from our plugins page.
Once you’ve installed the plugin, configure SAP HANA® as a data source by going to Configuration > Data sources > Add data source. Select SAP HANA®. Add the server details, authentication credentials, and the schema that you want to query. An SAP HANA® schema is the equivalent of a database in traditional DBMS. Alternatively, click on the Permissions tab to enable data source permissions, an Enterprise feature that allows you to control who can query the data source. Your data source is now ready to query!

Adding variables
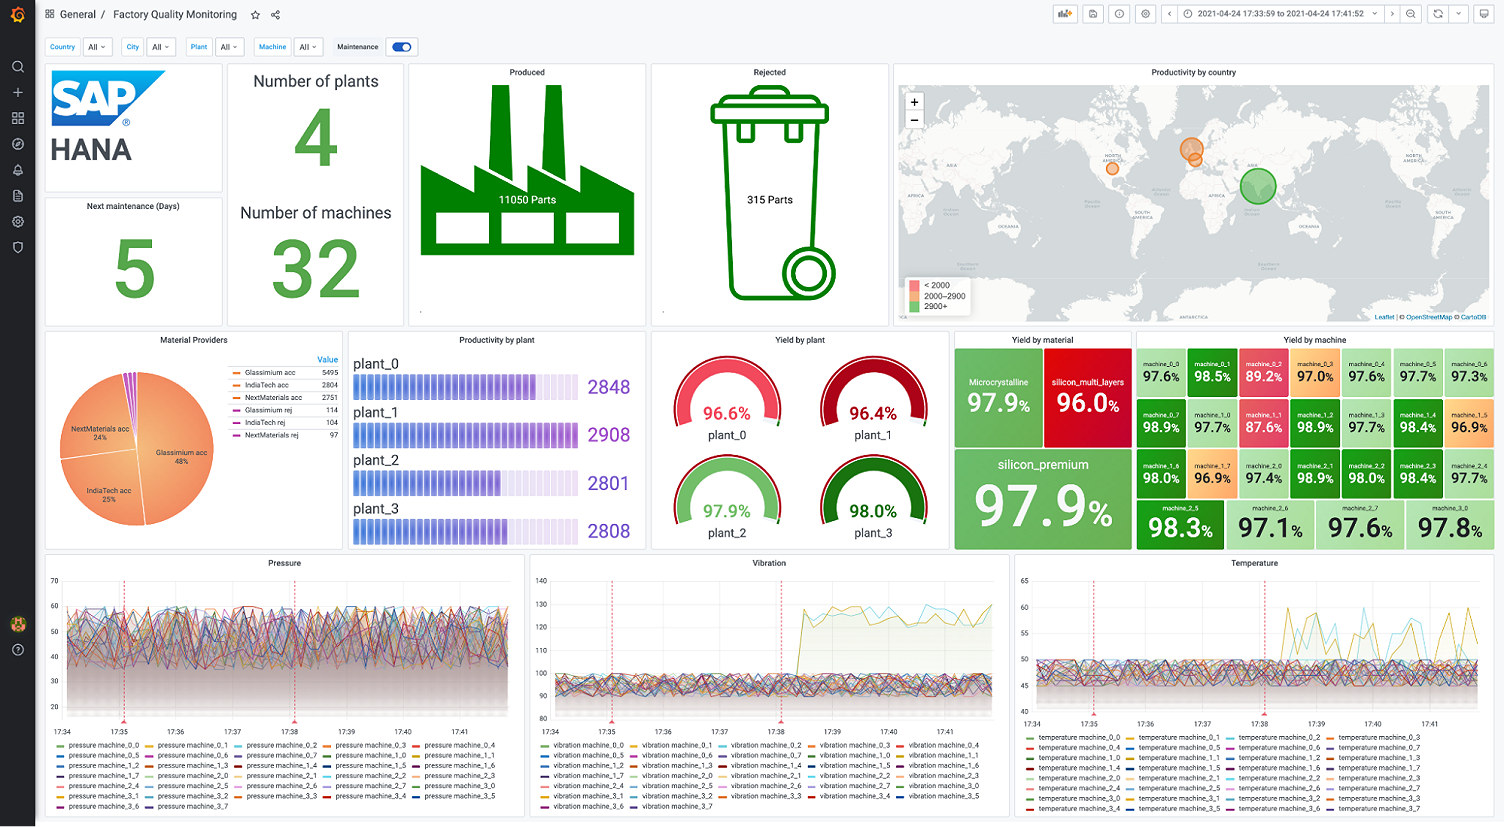
In our use case, we are monitoring the quality and the productivity of multiple machines in several plants spread over the world. When a quality issue is detected, the plant manager will need to slice and dice to find the root cause. So let’s extract these dimensions as template variables.
To do so, we just need to write the SQL query that retrieves the data from SAP HANA®. We need to have a hierarchy between Countries/Cities/Plants and Machines. If we select France as a country, we want only French cities in the City variable. To do so, we add the WHERE "country" IN (${Country}) to the query.

Queries and macros
We are now ready to get some data back. Let’s visualize the productivity of the machines. Productivity is defined as the total number of parts produced, whether they were accepted or rejected by the quality check system. To do this, we will write the below SQL query. The query editor is a smart auto-completion editor, allowing you to format data as table or time series.

Notice the dynamic filtering of the dashboards by defining variables and referencing them in the SQL query. We are also using the macro $__timeFilter on the column “timestamp” to focus our analysis on the time slot selected in the dashboard.
From the results, it seems that some machines are struggling compared to the others. Let’s add some time series data from sensors to see what’s happening. Now, we will execute another query to get temperature values from our machine sensors together with their timestamps. To show this data, we switch the SQL editor to the time series format. Wow! There are two machines that are heating more than the others. But what triggered this change?

Annotations to the rescue
The SAP HANA® plugin supports annotations. This overlays visual markers on any graph to correlate events in SAP HANA® (such as maintenance activities) against time series metrics from other data sources, such as the sensor data. By adding this table as an annotations source, we get very insightful contextual data.
Fortunately, all operations performed by the machine operators are logged in a separate SAP HANA® table called operations. By enabling this, we discover that our problems started to happen right after changing the raw material we are using on some machines. We found the cause!

To proactively detect such situations in the future, we can set up alerts for our SAP HANA® graphs, for instance, if the average temperature on a machine goes above a certain threshold.
Learn more
To find out more information about the SAP HANA® data source plugin, which is available for users with a Grafana Cloud account or with a Grafana Enterprise license, check out the SAP HANA® solutions page or contact our team.
Please let us know what you think of this new plugin on the Grafana Labs Community Slack. We look forward to learning about the use cases you will build with it.
And if you would like to build the next plugin or help our customers use it, Grafana Labs is hiring across the board! This blog is a testimony that you can have an impact very quickly at Grafana Labs, as Sriram and I joined just three months ago. :)
If you’re not already using Grafana Cloud — the easiest way to get started with observability — sign up now for a free 14-day trial of Grafana Cloud Pro, with unlimited metrics, logs, traces, and users, long-term retention, and access to one Enterprise plugin.