What’s new in Grafana Enterprise Metrics 1.3, our scalable, self-hosted Prometheus service
We built Grafana Enterprise Metrics (GEM) to empower centralized observability teams to provide a multi-tenanted, horizontally scalable Prometheus-as-a-Service experience for their end users.
The GEM plugin for Grafana is a key piece of realizing this vision. It provides a point-and-click way for teams operating GEM to understand the state of their cluster and manage settings for each of the tenants within it. With GEM 1.3, we’ve enhanced the plugin to allow GEM operators to do even more management directly within the plugin, giving users another option beyond just configuration files or command-line flags.
GEM plugin now reports hash-ring health
Five of the microservices within GEM (ingester, store-gateway, compactor, ruler, and alertmanager) rely on hash rings to divide up work between copies of each microservice. For example, in a system with 12 tenants and 2 compactors, the ring ensures that compactor1 manages tenants 1-6 and compactor2 manages tenants 7-12. Add another compactor and the ring will evenly distribute the 12 tenants between the 3 compactors.
Proper functioning of the rings is crucial to proper functioning of your metrics cluster. Previously, understanding which rings are functioning as expected required hitting a lot of disparate API endpoints. We decided to make monitoring this state easier by integrating it into the plugin.
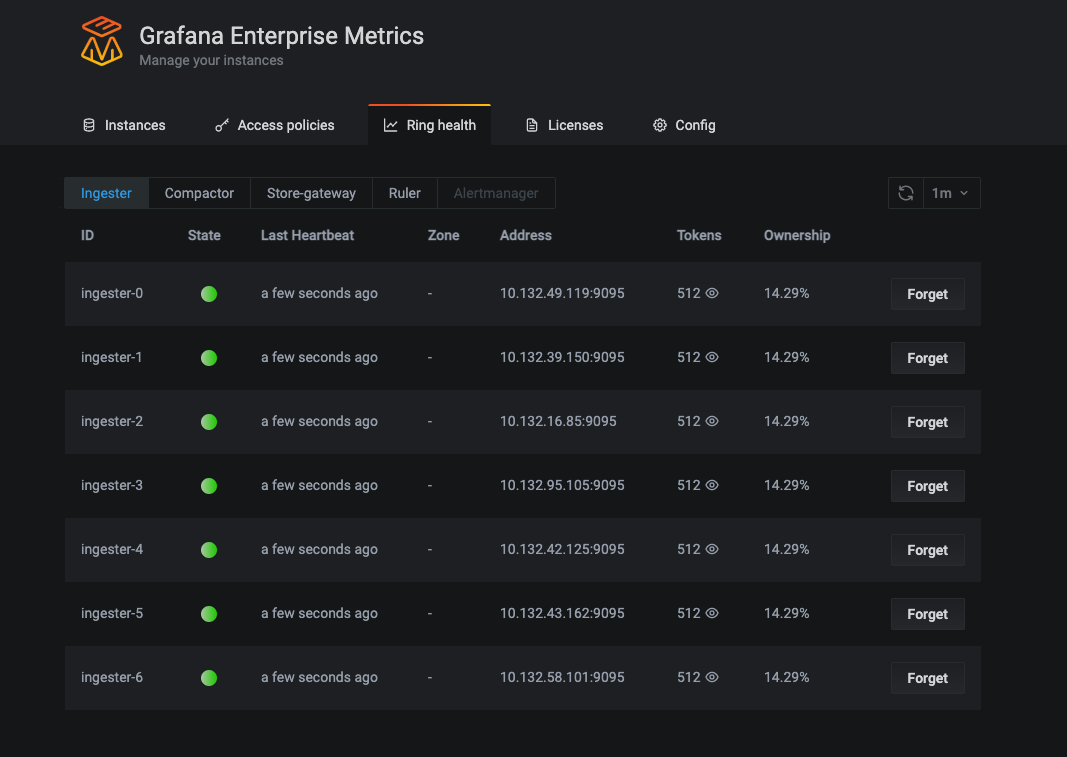
Ring health page in the Grafana Enterprise Metrics plugin. In the example above, the ingester, compactor, store-gateway, and ruler are all using hash rings to distribute work. The alertmanager is greyed out because the hash ring is disabled. (This cluster is only running one alertmanager.)
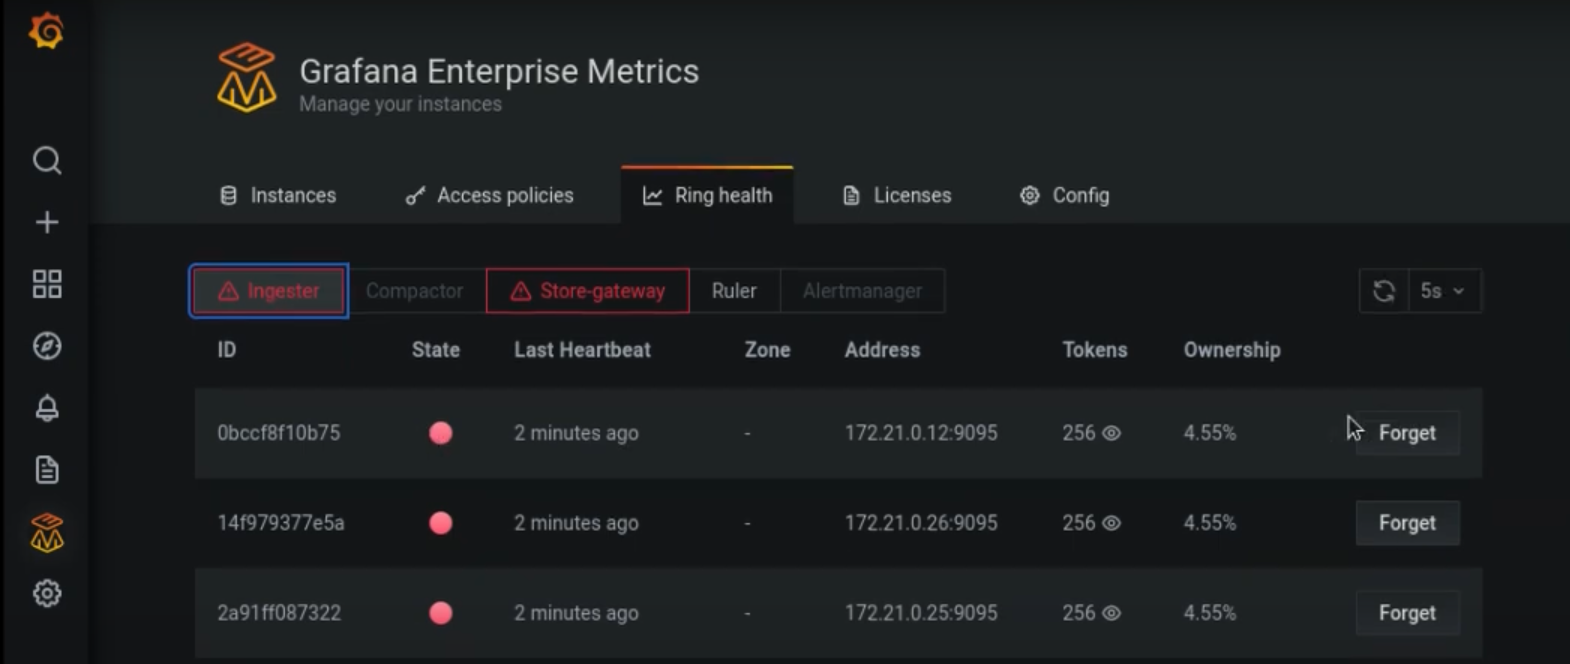
View of the ring health page demonstrating two rings (ingester and store-gateway) with unhealthy ring members. This allows GEM operators to identify the existence and source of problems in their system.
Users can switch between views of ring health for each microservice, and remove the unhealthy ring members using the “Forget” button. On one page, they can immediately see which rings are active, which are healthy, and which are unhealthy.
GEM plugin now allows you to set custom tenant limits
One of the great things about GEM’s multi-tenancy functionality is it allows you to set custom limits for each tenant. Usually the way we see this play out in practice is that a centralized observability team creates a tenant for each team within their organization. Consider an example where an observability team is supporting Application Team A and Application Team B.
Both of them are sending Prometheus metrics to GEM, and both want to build dashboards, create alerts, and query their metrics.
As the centralized observability team, you know that your compute budget isn’t infinite. You want to provide the best possible experience for Team A and B, without letting either of them monopolize the resources of the cluster. One way to do this is with global limits: You can set maximum thresholds for how much any single tenant can read or write.
But as it turns out, Application Team A is actually three times the size of Team B. You don’t want to set the global limit so low that Team A can’t send all the metrics they need, nor do you want to set the limit to what Team A needs, because that allows Team B, at their much smaller size, to run wild.
The solution here is custom tenant limits. For example, you can set Application Team B’s max ingest rate to 10,000 samples per second, and Application Team A’s max ingest rate to 30,000 samples per second. Maybe you anticipate that Team B, though smaller, will need to run longer time-horizon queries than Team A, because they’re responsible for long-term capacity planning. In that case, you might want to set Team B’s max_samples_per_query limit higher than Team A’s.
Historically, the way to update these limits was to change a config file and deploy it across nodes. This isn’t easy for non-Kubernetes customers who have to manage a text file that’s copied across tens or hundreds of machines. Even for Kubernetes-based users (most of whom rely on ConfigMaps for this purpose), limit changes can be slow to roll out because they require triggering a CI/CD process.
To alleviate this pain point, we’ve made it possible to create and edit custom tenant limits directly in the GEM plugin.
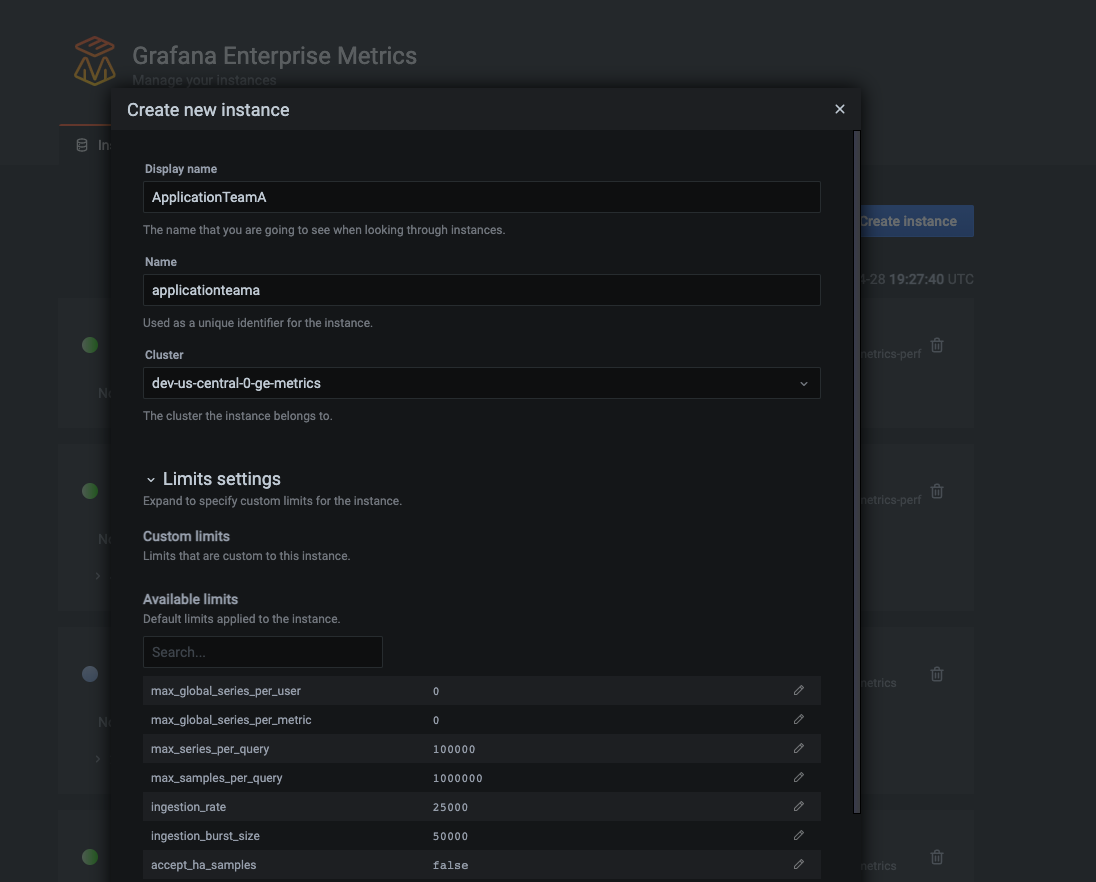
Setting custom instance limits at the time of creating the instance. (Grafana Enterprise Metrics uses the word “instance” when referring to a “tenant.”)
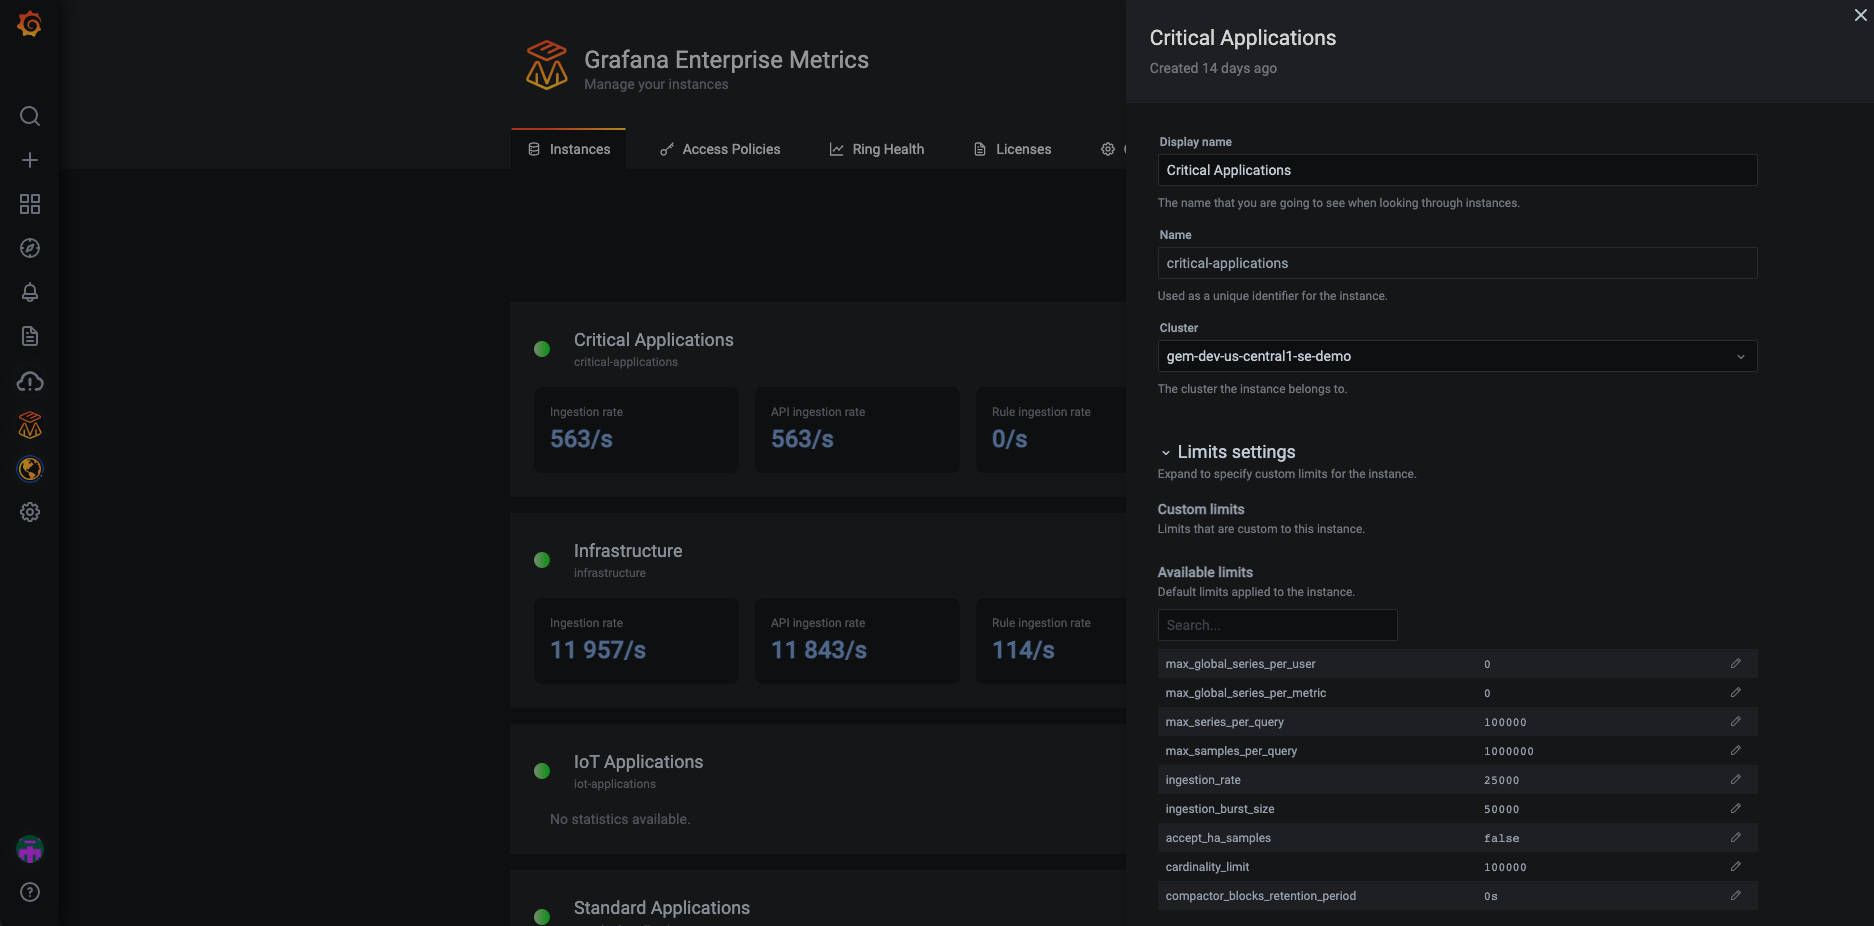
Screenshot showing sidebar for editing limits for an instance that already exists.
Under the hood, the GEM plugin relies on GEM’s Admin-API to make editing these limits possible. This means that teams who don’t want to use the plugin can always use the Admin-API directly to make these same changes. This might, for example, be useful for observability teams who want to automate their setup via their own internal portal.
Wrapping up
We have more big plans for the GEM plugin, including visualizations to help users better understand each tenant’s usage over time, as well as other cluster health indicators beyond ring status. We’ll continue to post updates about new features here on the blog.
If you’d like to learn more about Grafana Enterprise Metrics, you can watch the “Running Prometheus-as-a-service with Grafana Enterprise Metrics” webinar on demand. You can also read more about GEM in the docs, and contact us if you’d like to try it out!