
Get instant Grafana dashboards for Prometheus metrics with the Elixir PromEx library
Alex Koutmos is currently a Founding Engineer at Whoosh.io. After getting hooked on the BEAM reading Elixir in Action by Saša Jurić in 2015, he has been working professionally with Elixir since 2016. Alex also publishes Elixir blog posts on https://akoutmos.com and regular Elixir tips on Twitter under the #MyElixirStatus hashtag. When Alex is not on the BeamRadio podcast, he maintains a few packages on Elixir libraries on Hex.pm.
I have been using Grafana for almost four years now, and in that time it has become my go-to tool for my application observability needs. Especially now that Grafana allows you to also view logs and traces, you can easily have all three pillars of observability surfaced through Grafana. As a result, when I started working on the Elixir PromEx library, having Grafana be the end target for the metrics dashboards made perfect sense. In short, PromEx is a library that aims to provide both Prometheus metrics and Grafana dashboards for many popular Elixir ecosystem libraries, and it takes less than 5 minutes to set up. To see how PromEx leverages Grafana, let’s dive into PromEx’s architecture and see what parts of the Grafana HTTP API it uses.
Under the hood of PromEx
While Grafana and Prometheus are not coupled to any one particular programming language or ecosystem, I believe that PromEx would not have been possible without the Erlang and Elixir community tooling available in the BEAM Telemetry GitHub Organization. The tools in this GitHub organization provide library authors in the Erlang and Elixir community a consistent interface through which they can surface internal library events. These Telemetry events can then be used to format structured logs, capture Prometheus metrics, and even form the basis for OpenTelemetry traces. All library users need to do is attach handlers to these Telemetry events, and any time the event is triggered, the user’s callback is invoked and passes any measurements and metadata associated with the event. Below is a snippet of Elixir code that demonstrates this (taken from the Broadway library):
# Libraries publish metrics like so:
defp emit_start_event(name, start_time, messages) do
  metadata = %{name: name, messages: messages}
  measurements = %{time: start_time}
  :telemetry.execute([:broadway, :processor, :start], measurements, metadata)
end

# And you can attach to arbitrary events like so:
:telemetry.attach(
  "handler_id",
  [:broadway, :processor, :start],
  fn _event_name, event_measurement, metadata, _config ->
    IO.inspect("#{metadata.name} started processing a message at #{measurements.time}")
  end,
  nil
)
At the time of writing, there are 134 libraries on Hex.pm that leverage Telemetry and the aforementioned tooling. This means that all of those 134 libraries surface internal events in a uniform and easily consumable format. With this consistent foundation in place, PromEx provides a plugin style framework where you can attach Prometheus metrics collectors to hook on to those Telemetry events à la carte. For example, let’s pretend we have a Phoenix web application that also leverages Postgres via Ecto and the job processing library Oban. Using PromEx, we can create a configuration module that attaches Telemetry handlers for all of the Telemetry events that those libraries expose in an as-needed fashion (as defined in the plugins function):
defmodule MyCoolApp.PromEx do
  use PromEx, otp_app: :web_app

  @impl true
  def plugins do
    [
      PromEx.Plugins.Application,
      PromEx.Plugins.Beam,
      {PromEx.Plugins.Phoenix, router: MyCoolAppWeb.Router},
      {PromEx.Plugins.Ecto, repos: [MyCoolApp.Repo]},
      {PromEx.Plugins.Oban, oban_supervisors: [Oban]}
    ]
  end

  @impl true
  def dashboard_assigns do
    [
      datasource_id: "prometheus"
    ]
  end

  @impl true
  def dashboards do
    [
      {:prom_ex, "application.json"},
      {:prom_ex, "beam.json"},
      {:prom_ex, "phoenix.json"},
      {:prom_ex, "ecto.json"},
      {:prom_ex, "oban.json"}
    ]
  end
end
With only five lines of code in our plugins function, we have Prometheus metrics for our application (dependencies, uptime, etc.), the Erlang Virtual Machine, Phoenix (our web framework), Ecto (our database library), and Oban (our job processing library). So where does Grafana tie into all of this? Let’s unpack that in the next section as we discuss the dashboards function.
Leveraging the Grafana HTTP API
One of my biggest pain points when working with monitoring solutions has been the development and deployment of dashboards. It would always be a manual process of going to my Grafana instance after the application has been deployed, adjusting existing visualizations and adding new ones. In addition, the dashboards were never part of any source control system so you could not code review any PromQL queries in the visuals to make sure that you were visualizing the correct thing. Lastly, there were never any processes of promoting Grafana dashboards across the environments as applications went from DEV -> STAGING -> PROD. In my opinion, the lifecycle of the dashboard should align with the lifecycle of the application given that the dashboard surfaces metrics for a particular version of the application.
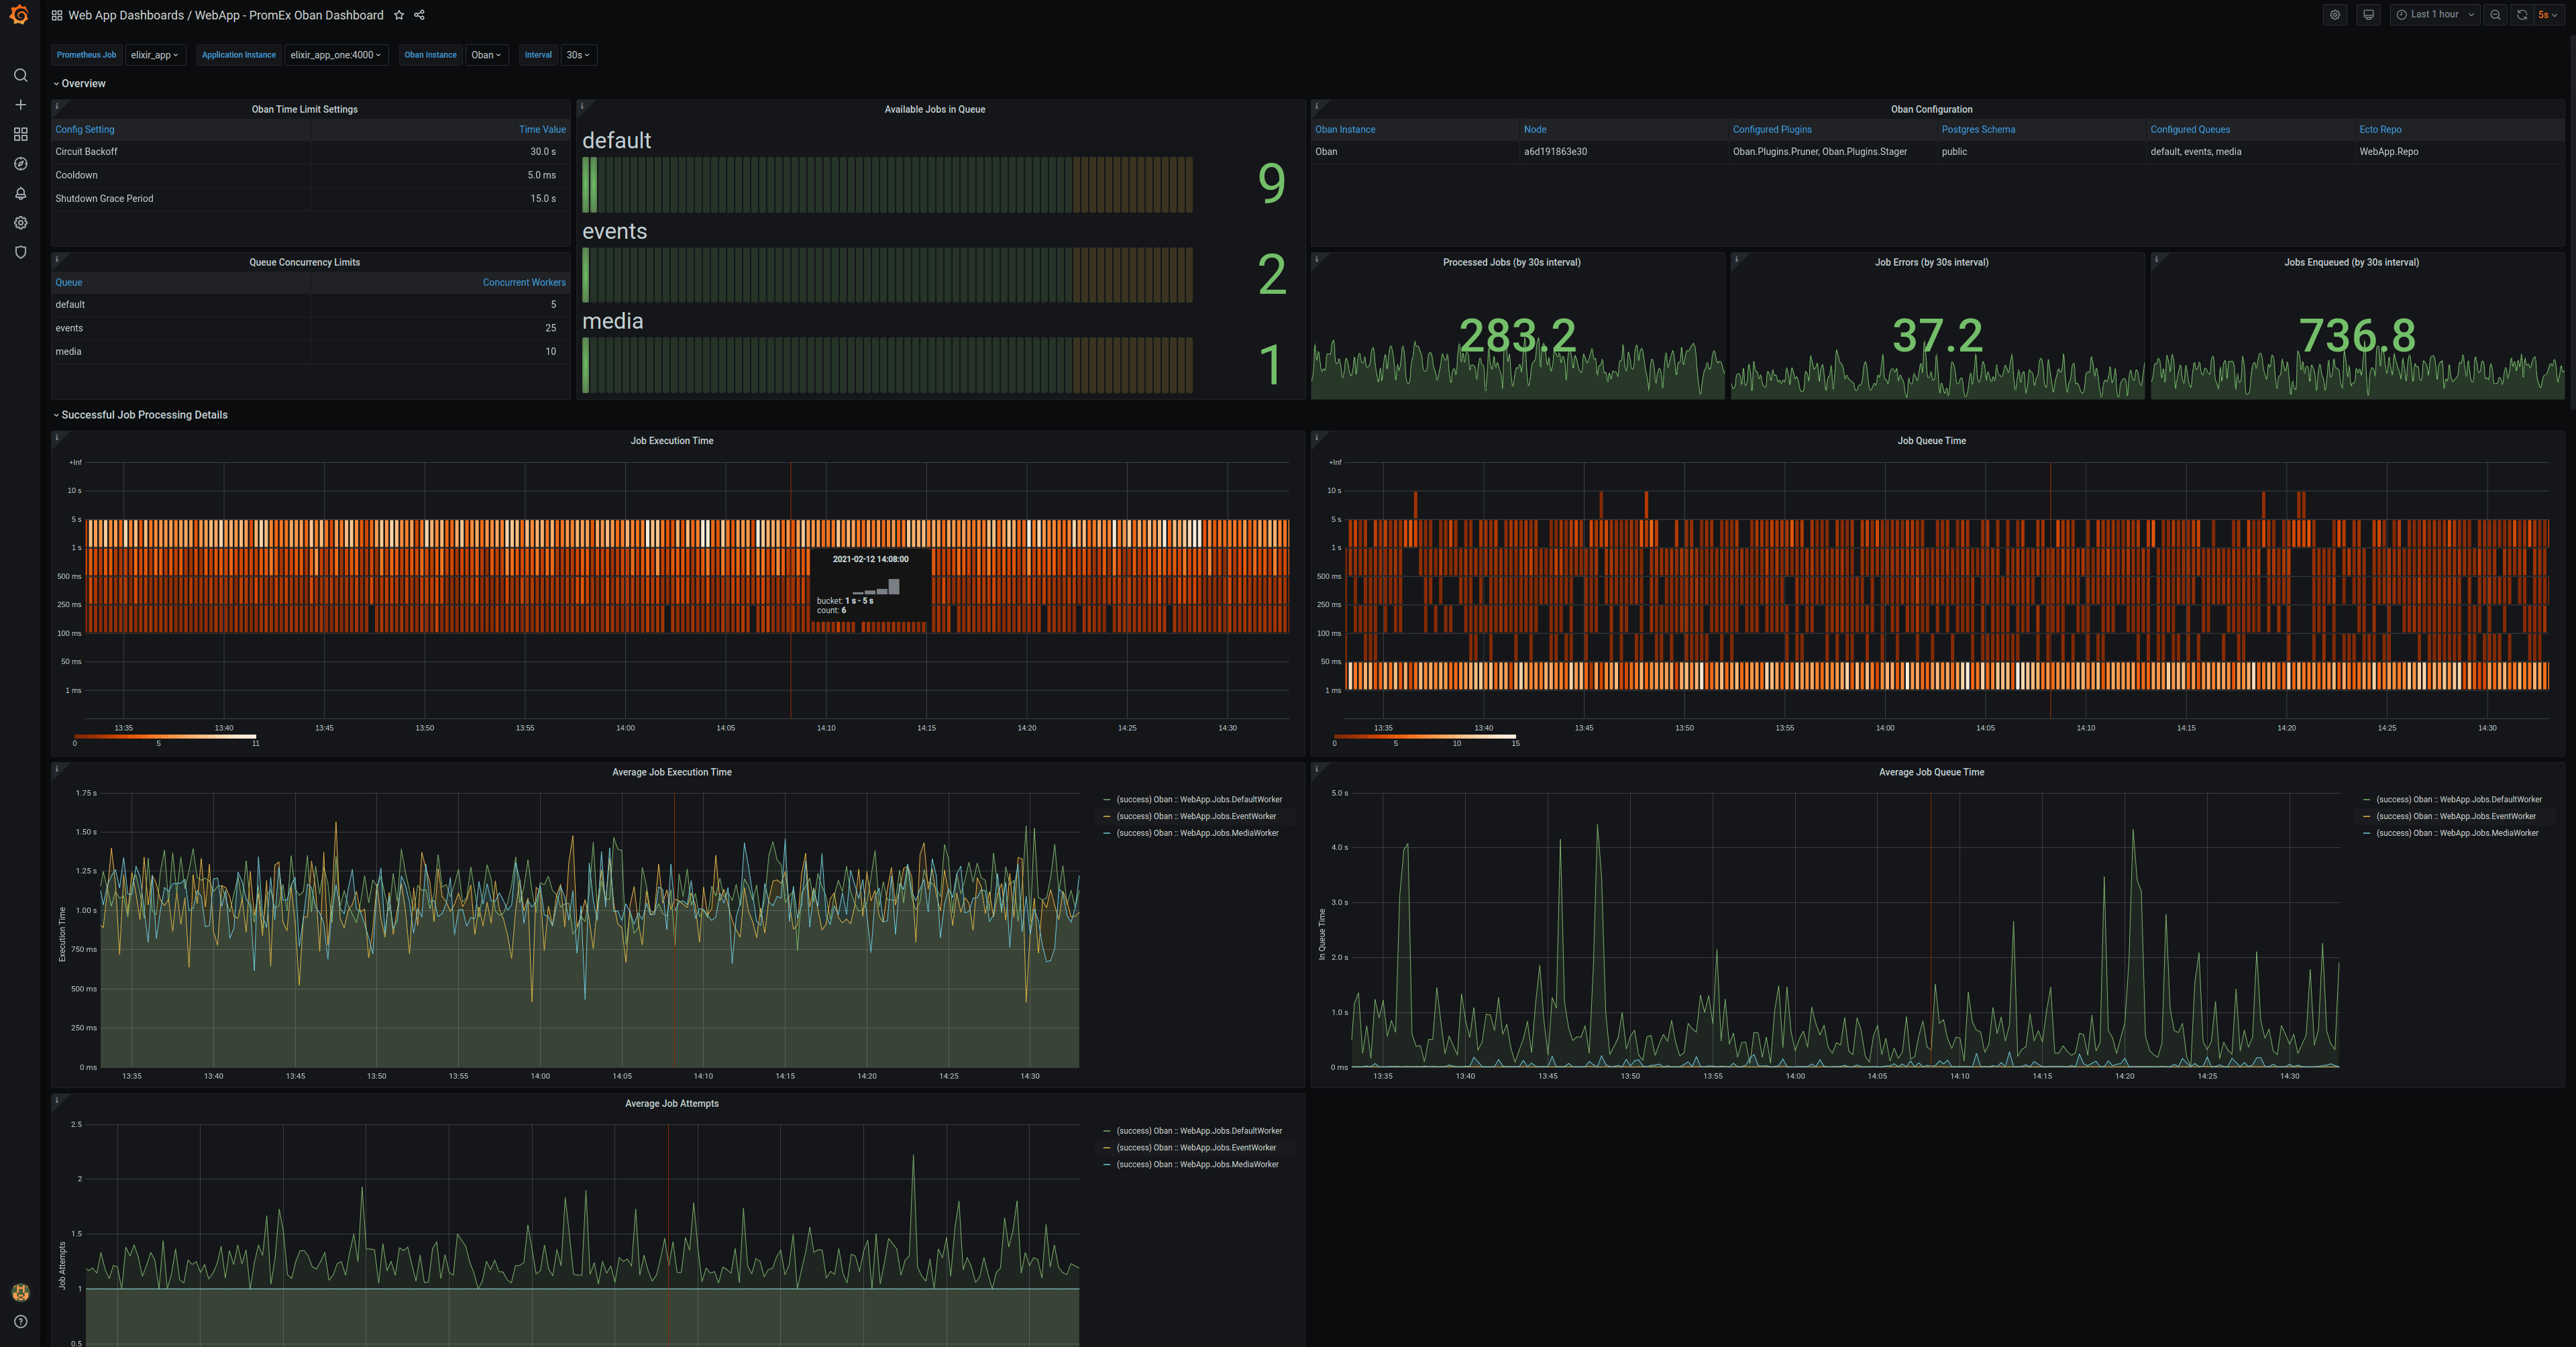
To fix these pain points, PromEx ships with the corresponding Grafana dashboards to visualize the metrics captured by each of the plugins (you can also write your own plugins/dashboards and leverage PromEx the same way that the first-party plugins/dashboards do). As a result, as new versions of PromEx are published, you automatically get new Prometheus metrics and Grafana dashboards without having to do anything. Under the hood, PromEx leverages the Grafana Dashboard API to upload dashboards on application init so you never have to worry about uploading or editing dashboards ever again. In addition, via the Annotations API, PromEx will also annotate the dashboards so you can have lifecycle markers for when an application instance started and when it stopped. That means you can have dashboards like this with zero effort from your end:

What’s next for PromEx?
There are a few things currently on the docket for PromEx, including:
- Optionally packaging Grafana Agent and supervising it under PromEx, so that metrics can be pushed to remote Prometheus instances via remote_write right from the application.
- Adding additional library plugins. PromEx currently has 6 first-party plugins, but with 134 community libraries using Telemetry, there is quite a bit more work to do.
- Integrating with the OpenTelemetry Erlang/Elixir project and providing support for exemplars.
Conclusion
While PromEx is specifically built for the Erlang/Elixir ecosystem, I believe that the patterns employed here are applicable to many other languages and ecosystems. The Grafana HTTP API is feature-rich and really allows you to use Grafana as more of a dashboard hosting tool in order to get fine-grained control as to how your dashboards are deployed. The other benefit is that with Grafana running locally on your machine, you can update your dashboards as you add new features during your development phase and have confidence that things are being rolled out when they should be.

