Learn how to monitor your energy use at home with a Raspberry Pi, Grafana and Prometheus
About six months ago, I decided to start a little project at home that combined my interest in IoT with my experience as a solutions engineer here at Grafana Labs. I’d noticed my energy bills were high, so I set out to use a Raspberry Pi, along with Prometheus and Grafana, to monitor my consumption so I could determine what part of my house was using the most energy.
After our April 8 webinar on monitoring your Raspberry Pi with Grafana Cloud, I wanted to share my project notes in case anyone out there is looking for another software experiment idea.
What am I monitoring?
- Top 5 devices at home currently consuming the most power
- Current day power usage
- Last 7 days energy consumption
- Power spikes this week
- And more!
Hardware
- Raspberry Pi (Or another server)
- Emporia Vue 2 energy monitor
Software
Architecture Diagram
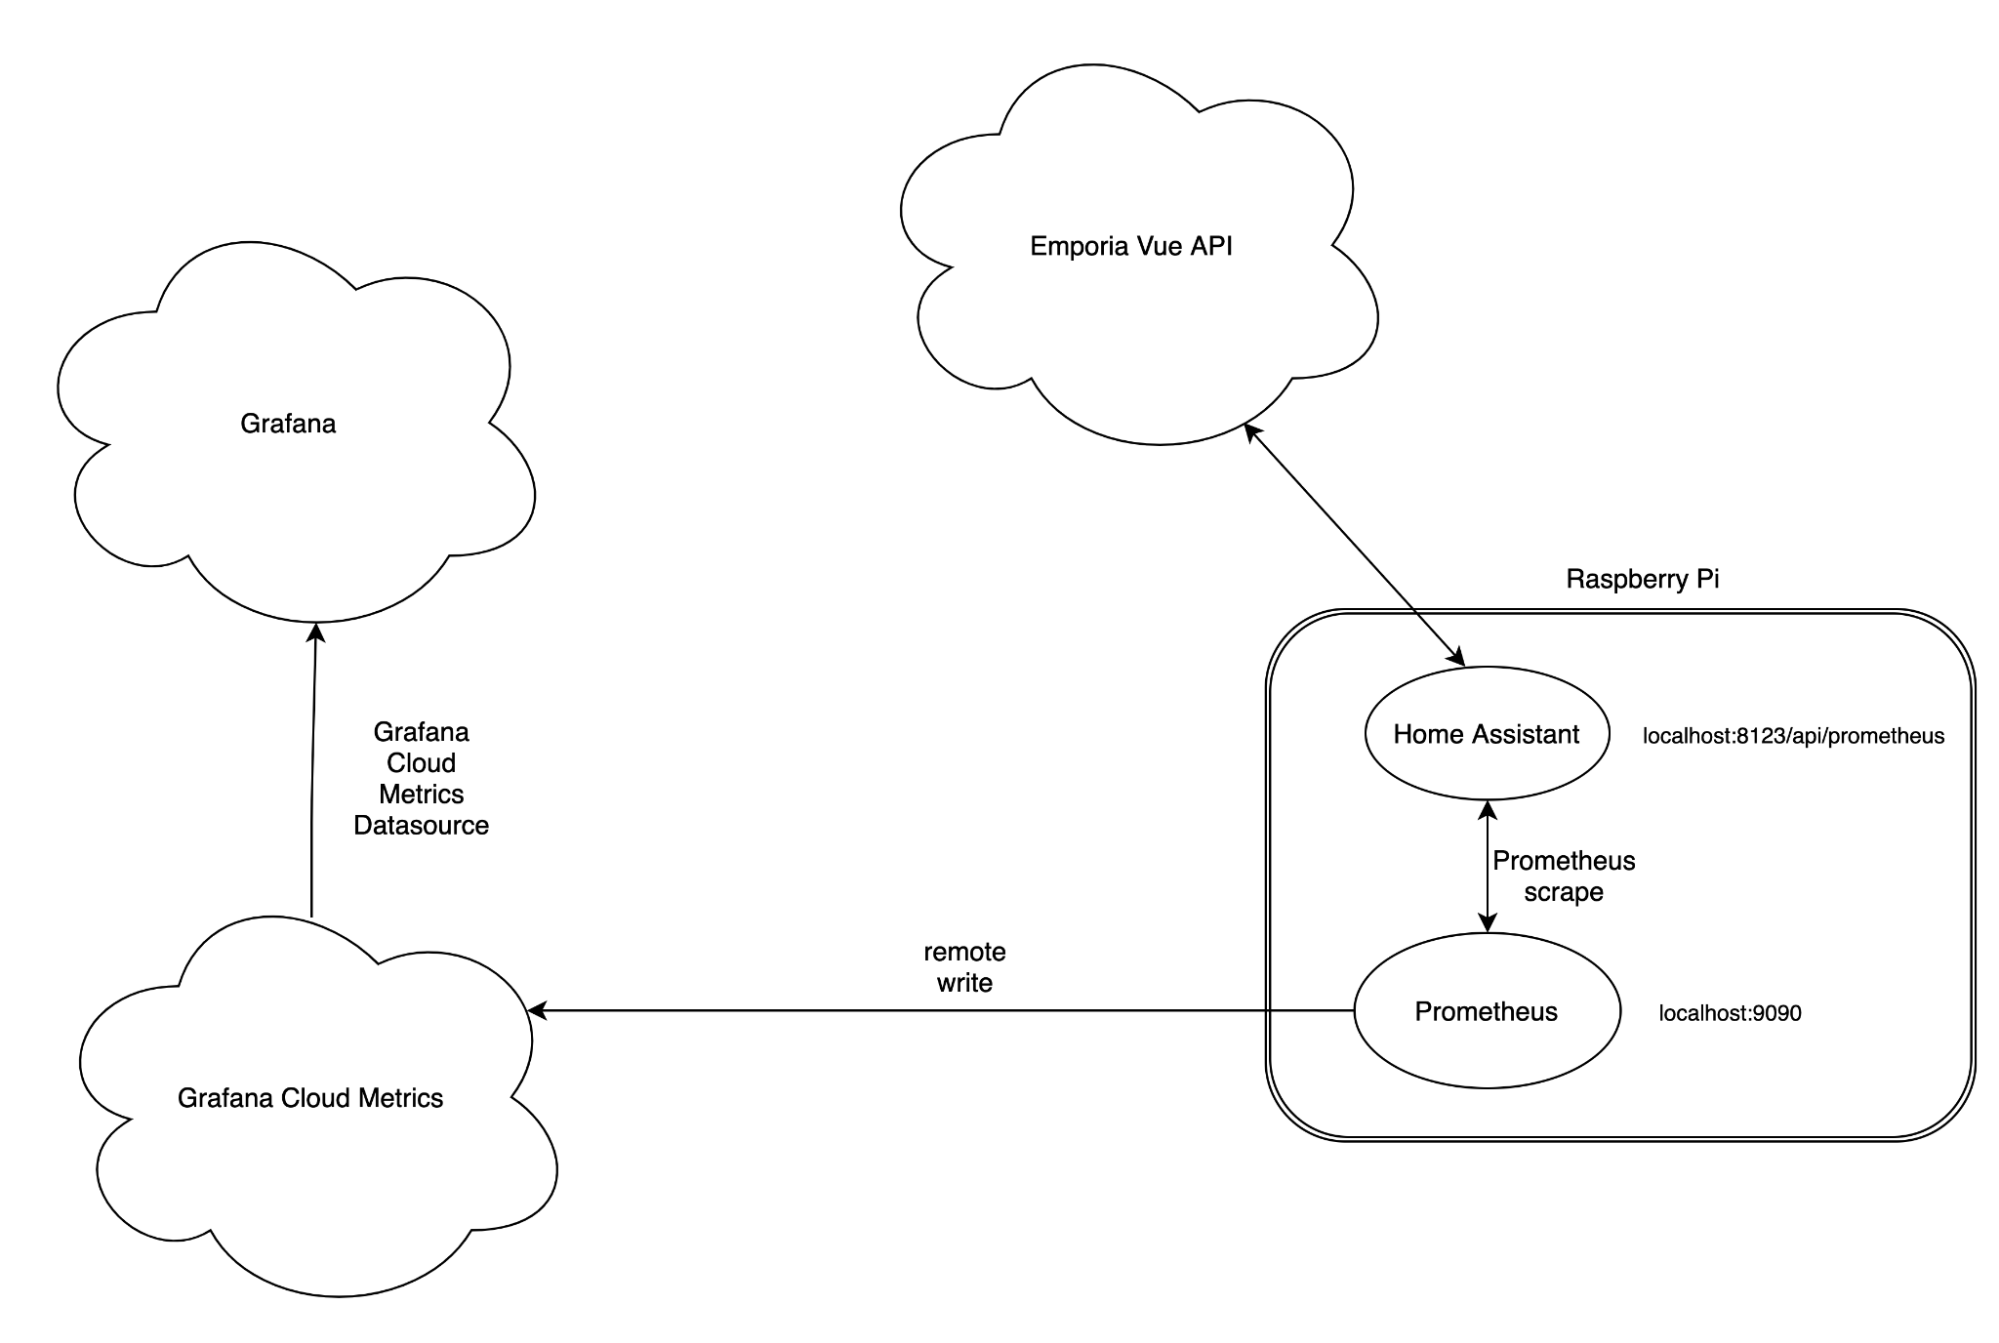
A quick explanation of the diagram above: On the right you see my Raspberry Pi. Inside it are two containerized applications running HomeAssistant and Prometheus. HomeAssistant is grabbing the energy metrics from Emporia Vue’s cloud API. Prometheus is then scraping those metrics now stored in HomeAssistant and remote writing them to my free Grafana Cloud stack. Then I use Grafana to visualize everything using the Prometheus data source that’s available by default in Grafana Cloud.
As a side note, I’m planning on writing a Prometheus exporter, which will natively scrape from Emporia Vue’s API. Once that’s complete, I won’t have to use HomeAssistant and the exporter will take its place.
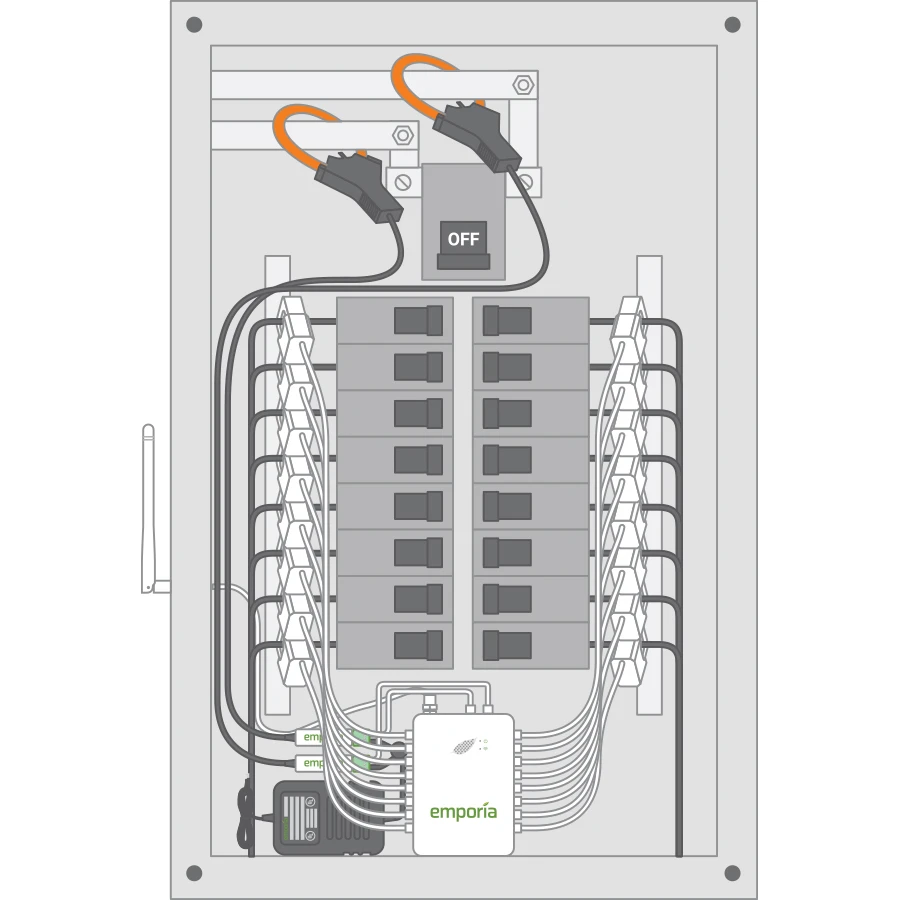
Installing the Emporia Vue 2
To start, you’ll need to get the Emporia Vue 2 setup in your home circuit board. The Emporia Vue app has great instructions and important safety information, so go slow and read all the directions — but it’s pretty easy to install. They even have a link to get a certified electrician to come and install it if you’re more comfortable having someone else do it.
Here’s a diagram of how it should look (my wiring was not this neat 😀):
Setting up Grafana Cloud
The next step is to set up Grafana and Prometheus. I decided to use Grafana Cloud — which comes with a managed Grafana and Prometheus service — for data storage and data visualization. You can sign up for a forever free account that comes with 10,000 active series for Prometheus or Graphite metrics and 50GB for logs in Loki, which is definitely more than enough for this monitoring solution.
Once you’ve created your Grafana Cloud account, you will be redirected to the onboarding walkthrough page. Find Prometheus (shown below) and click continue to configure it.
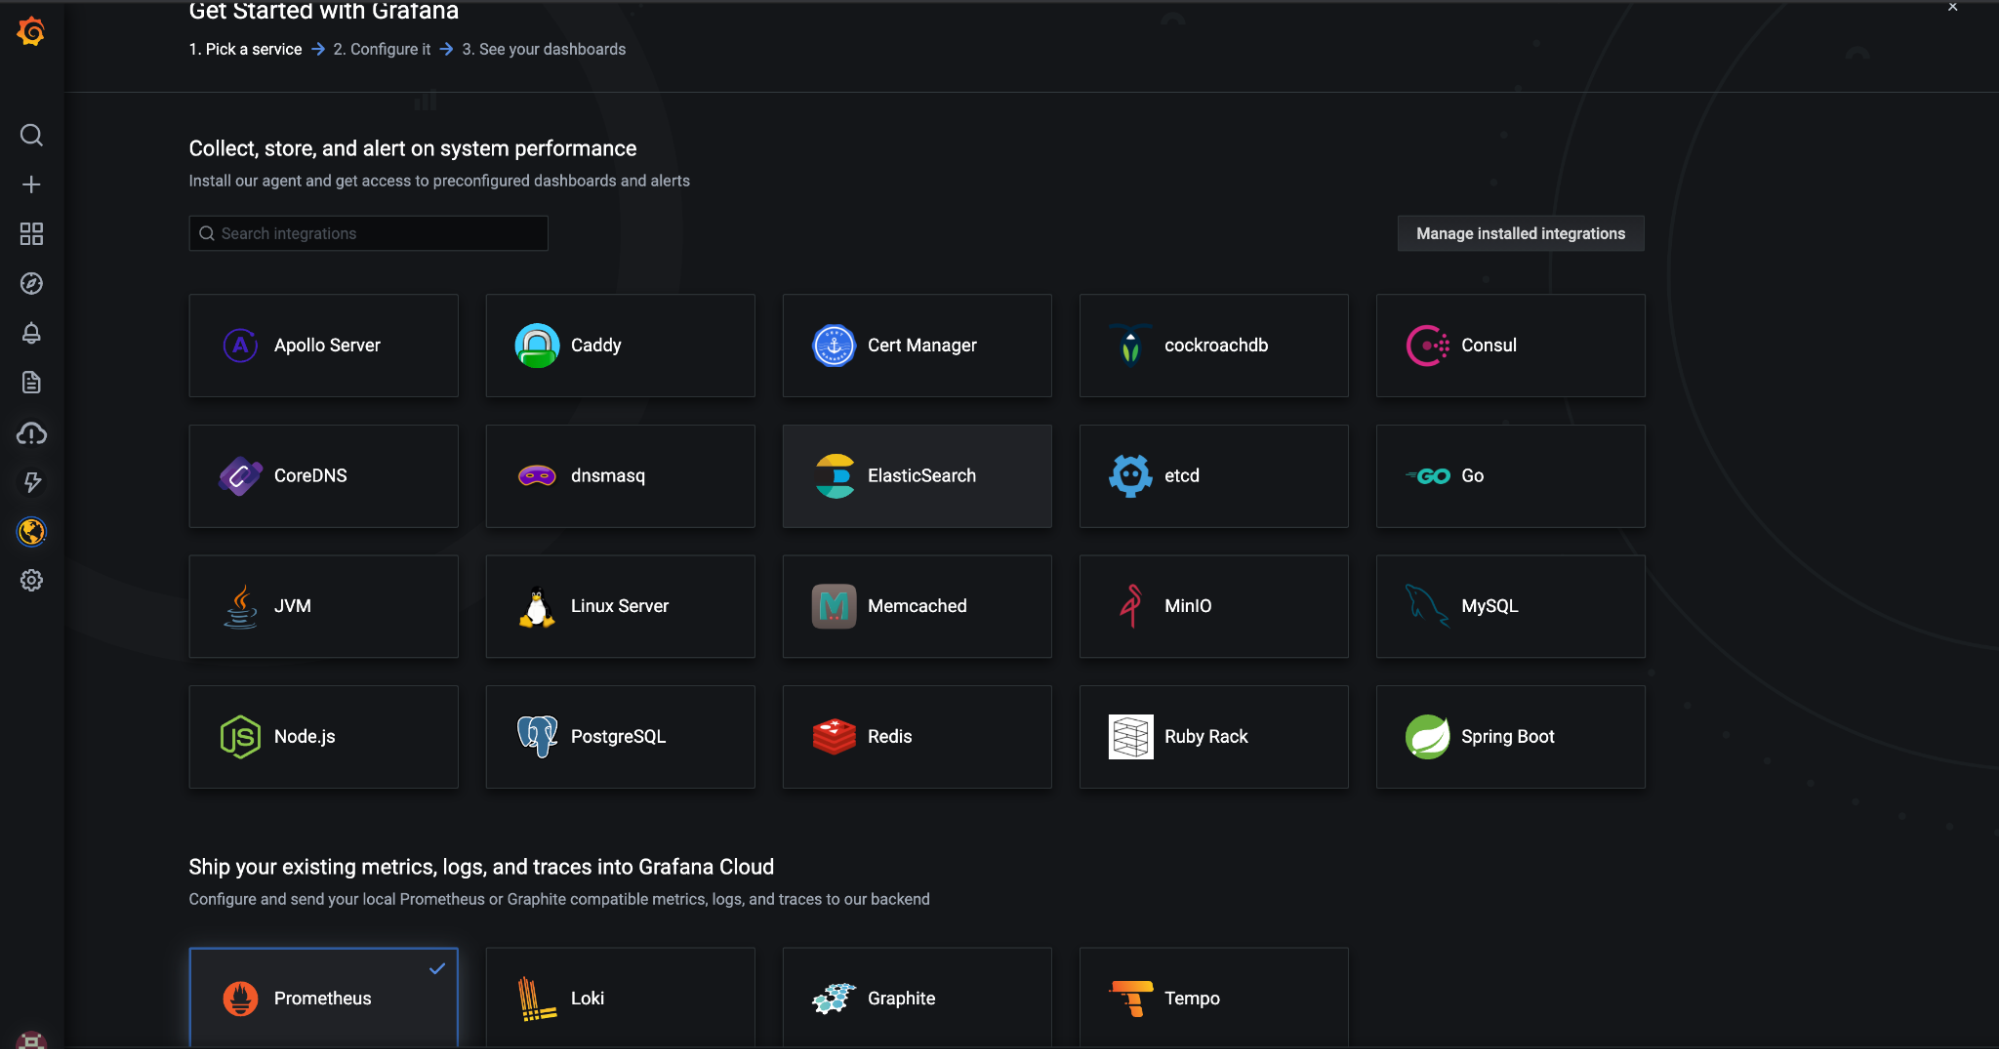
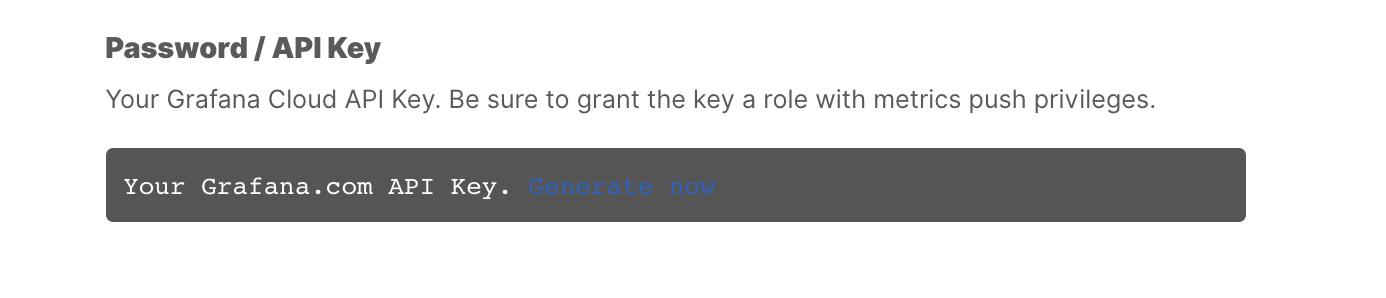
That should take you to a page with your instance url, Username/InstanceID, and API Key. If you scroll down a bit you’ll see a field that says Prometheus Remote_Write Configuration. You’ll need this configuration when we edit the prometheus.yml file later.

On that same page you’ll be able to create your API Key to fill in the password field in the remote_write configuration above. To create the key, click the blue “generate key” link in the API Key field. It’s kind of hard to see at first, so here’s a screenshot:
Configuring The Raspberry Pi
You’ll need to get a Raspberry Pi up and running with an OS that can run Docker. I chose Raspberry PI OS for mine. To get set up quickly, check out this easy install guide here.
Before you can get HomeAssistant & Prometheus running on your Raspberry Pi, you’ll need to download and install docker & docker-compose. Then, download these files from my github to help your installation:
- prometheus.yml (Prometheus config file that tells Prometheus where to scrape metrics from and how to send them to Grafana Cloud)
- docker-compose.yml (The start script for docker-compose that will install and run HomeAssistant and Prometheus for you)
- configuration.yml (HomeAssistant config file with the option for native Prometheus metrics turned on)
Edit the prometheus.yml and fill in your Grafana Cloud url, userid, and API key so the metrics go to your account.
Configuring HomeAssistant
Go to your Raspberry Pi’s IP address:8123 (ex:192.168.2.2:8123) to see the HomeAssistant Home Page. You now must create an access token so Prometheus has permission to scrape metrics from HomeAssistant API.
Long Lived Access Token
- Select your username on the lower left
- Scroll to the very bottom
- Select Create Token
- Save this token to your password manager (it will go away from sight)
- Put this token in your prometheus.yml file under the homeassistant scrape config
Once you create a login you can follow these directions to get Emporia Vue connected to homeassistant. Once you’ve done this, you should start to see metrics being published to Grafana Cloud!
Finishing Up
Run the command below to install and start the two containers running HomeAssistant and Prometheus.
docker-compose up-d
Running Grafana
Now that you’ve done the hard part, it’s time to login to your cloud instance of Grafana and import the energy usage dashboard. If you’ve done all the steps correctly, you should be able to see live energy consumption data on your dashboard.
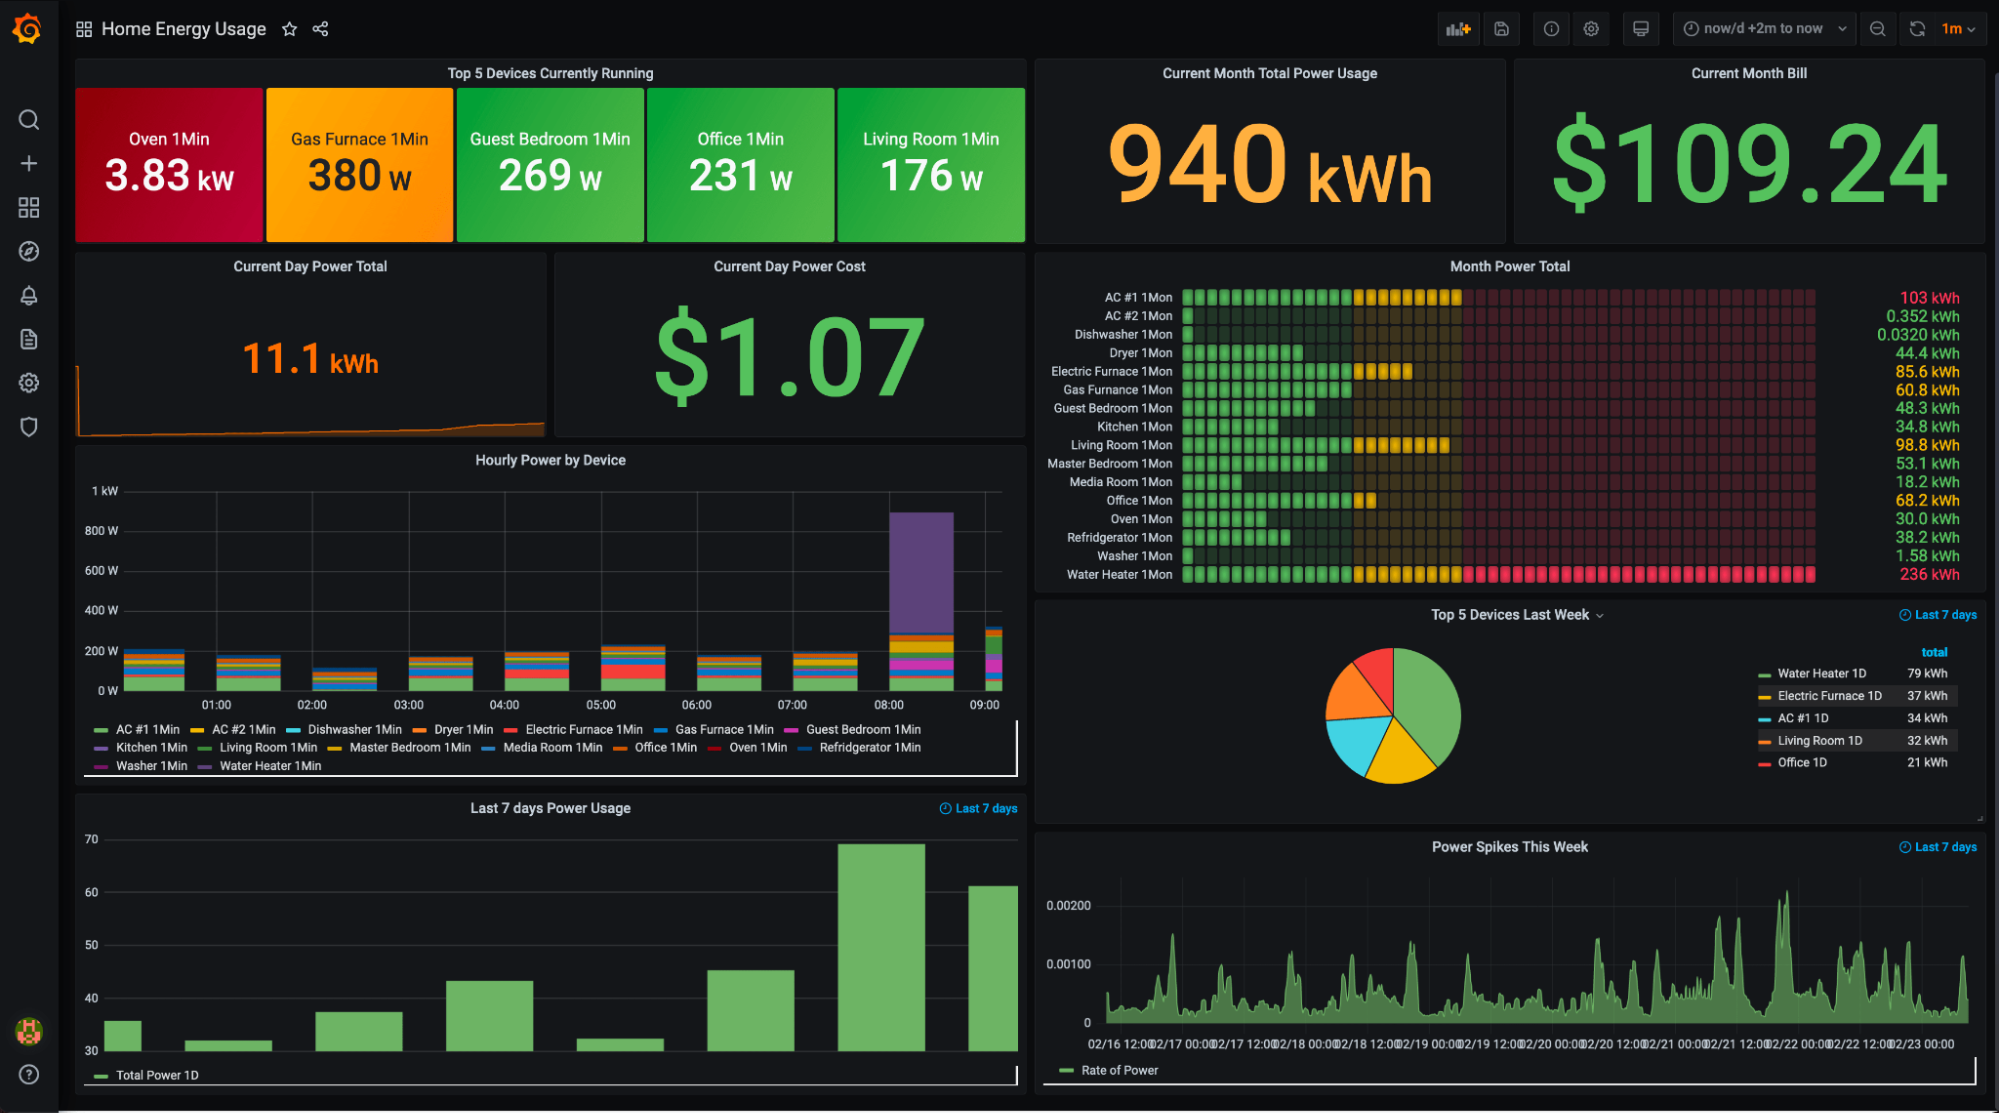
My home energy usage dashboard
And you’re done! I hope you enjoyed this blog post and now have a better understanding of your power bill — as well as Prometheus and Grafana. If you set this up for yourself, please reach out and let me know how it goes. I learned that my water heater uses about 50 percent of my energy bill every month! Time for cold showers . . .
The easiest way to get started with Grafana, Prometheus, Loki for logging, and Tempo for tracing is with Grafana Cloud, and we’ve recently added a new free plan and upgraded our paid plans. If you’re not already using Grafana Cloud, sign up today for free and see which plan meets your use case.