
Easily monitor your Tencent Cloud services with the new Grafana plugin
Plugins make it easier for Grafana users to get faster time to value. With a few clicks, you can start tapping into the different data stores you and your business already leverage — and see them all in one place in your Grafana dashboard.
I’m a huge fan of partner-developed plugins for a few reasons, with my favorite being subject matter expertise. Who better to develop your plugin than the team that knows the product inside out? Figuring out exactly what data you should care about can take time — or you can have the experts guide you.
So I’m excited to announce the addition of the Tencent Cloud Monitor App plugin, built by the Tencent Cloud team, to the Grafana catalog.
Tencent Cloud is a public cloud service provider that fuses Tencent’s infrastructure-building capabilities with the advantages of its massive user platform and ecosystem. Organizations across various sectors rely on Tencent Cloud for their infrastructure needs.
The benefits of the Tencent Cloud plugin
This app plugin allows you to monitor the performance and load characteristics of an extensive list of Tencent Cloud services, including Cloud Virtual Machines (CVM) and Cloud Databases (TencentDB). You can find the full list of the services supported here.
Functionally, the plugin leverages the Tencent Cloud Monitoring API (3.0) to retrieve metrics. Additionally, it includes dashboard templates that contain turnkey experiences for performance and load-monitoring of those services. Here’s a dashboard monitoring Cloud Virtual Machines:

How to get started
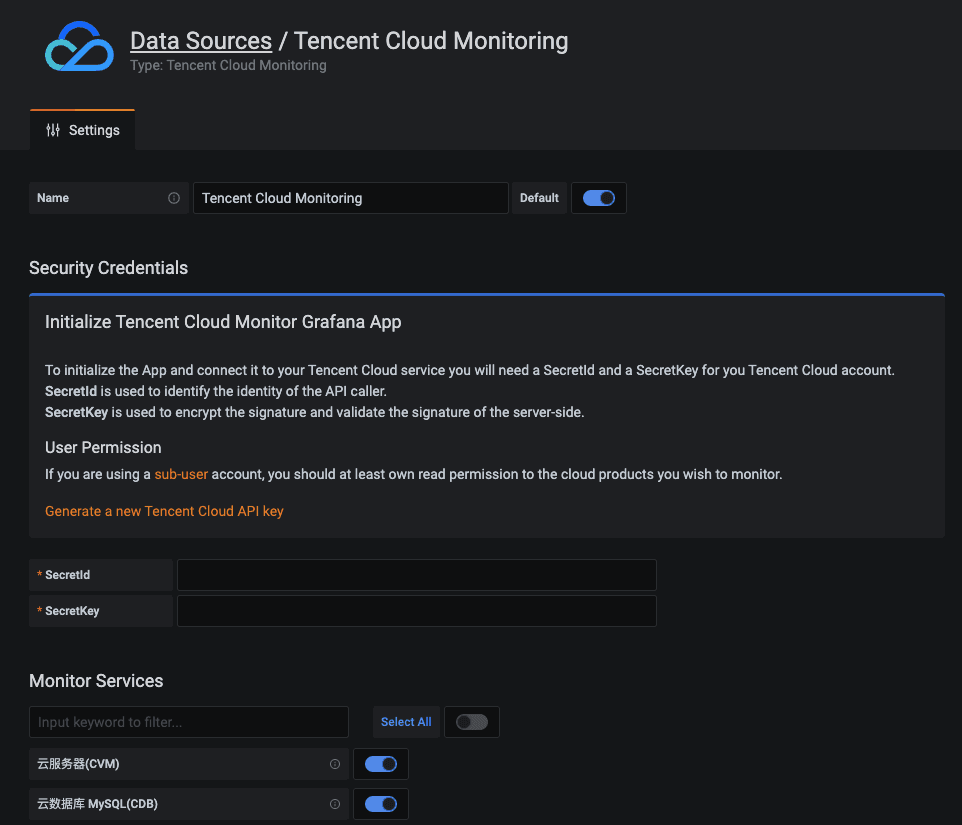
If you’re a Tencent Cloud user, you can easily get started with Grafana to monitor your environment. All you need to do is download and install the Grafana software to an operating system of your choice (we run on most platforms), and simply add the Tencent Cloud Monitor App plugin once you have Grafana running. From there, the configuration is just a matter of inputting credentials and identifying services you want to pull.
For a detailed install walk-through, have a look at the install docs. The plugin is compatible with both open source Grafana and Grafana Enterprise, an enhanced version of Grafana that includes enterprise features, support, and plugins for data sources for other commercial tools such as Splunk, New Relic, MongoDB, ServiceNow, Oracle, and Snowflake.
If you’re interested in trying Tencent Cloud, you can read more about it here.
With this new plugin, Tencent Cloud users can leverage the power and ease of Grafana’s monitoring capabilities to enhance their Tencent Cloud experience. Try it out, and let us know what you think!

