
How to troubleshoot remote write issues in Prometheus
Note: All links in this document point to code from Prometheus v2.26.0. The exact location or names of things may have changed.
Prometheus’s remote write system has a lot of tunable knobs, and in the event of an issue, it can be unclear which ones to adjust.
In this post, we’ll discuss some metrics that can help you diagnose remote write issues and decide which configuration parameters you may want to try changing.
How does remote write work?
First, let’s discuss how remote write is implemented. In the past, remote write would duplicate samples coming into Prometheus via scrape.
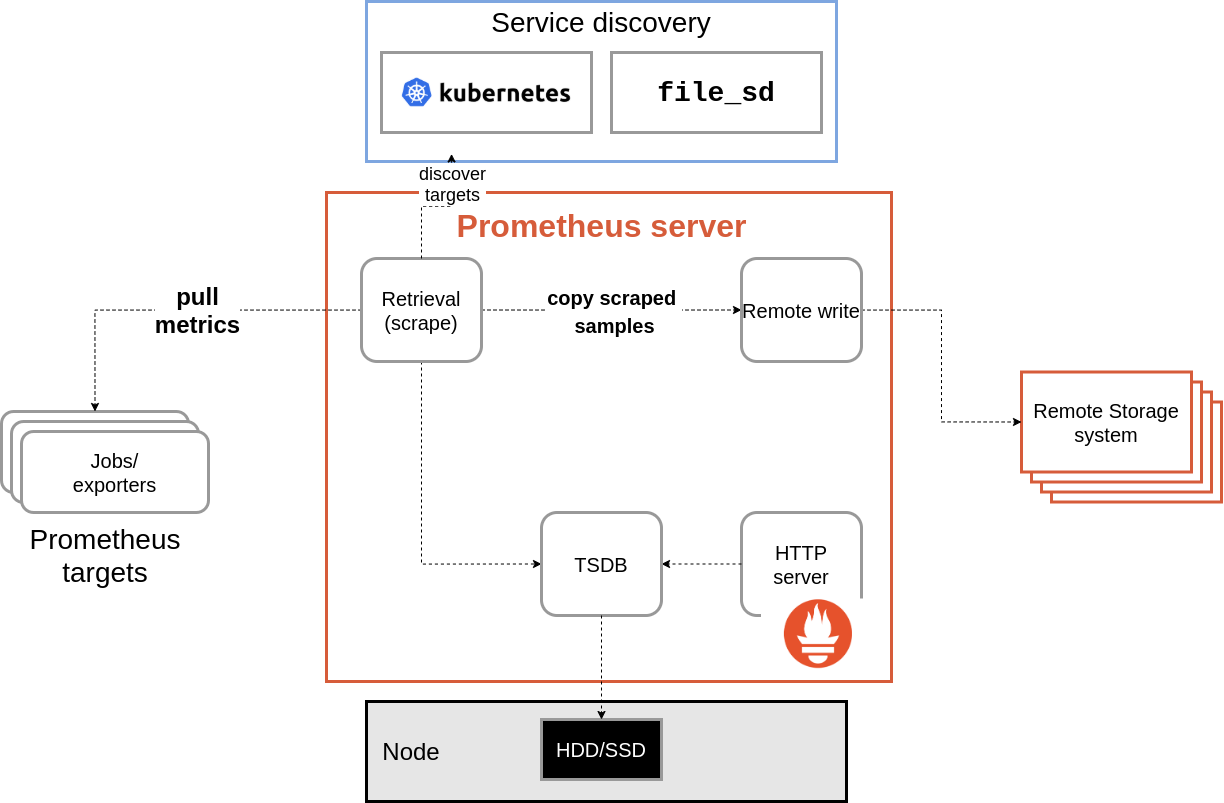
This was beneficial because it meant remote write would receive all relevant info for a sample. It would then send the data on to the remote storage endpoint. The main issues here were that we needed to use a fixed size buffer to buffer samples from scrapes if, for any reason, there was an issue with sending samples on to the remote endpoint.
It’s important to note that one of our design goals with remote write is to avoid data loss, meaning we try to ensure every sample that’s scraped and stored in Prometheus is also sent out over remote write, if possible. This fixed size buffer meant we either had to drop new samples or older samples already in the buffer if we tried to append to the buffer and it was full. The other scenario is that the buffer could be sized to handle a larger amount of samples, but in many cases, Prometheus instances are running at or near their memory limit when remote write is behaving properly in the first place.
Increasing the buffer size would mean any disruption that would interfere with Prometheus sending to the remote endpoint could OOM that Prometheus instance. In both scenarios, we could lose data. In an effort to reduce the chance of data loss, we decided to make some design changes to remote write.
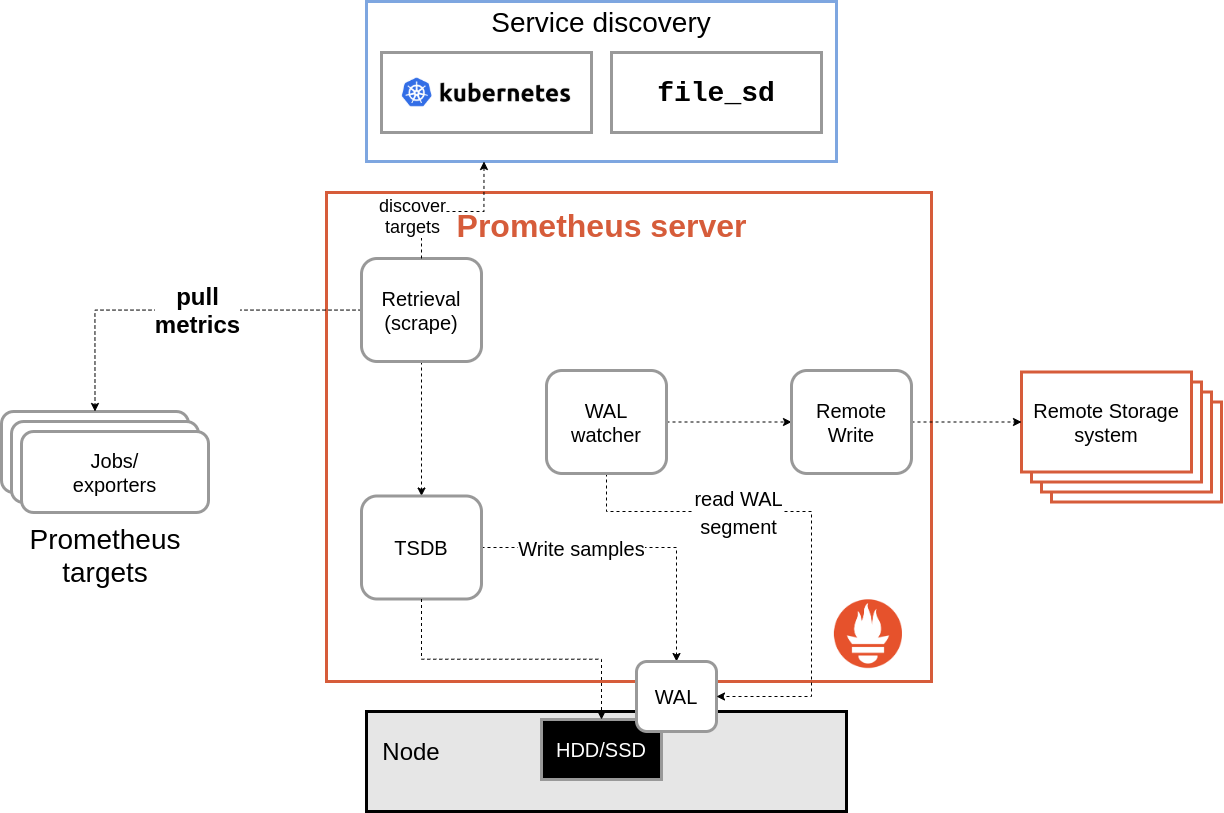
The major change we made is that remote write now reads data from Prometheus’ write ahead log instead of buffering samples directly from scrape.

Data generated by scrape is written to the WAL, so this essentially gives us a 2- to 3-hour buffer on disk of data for remote write. The RW system now has a subroutine that reads the WAL and passes the data back to remote write.
Remote write still has a small in-memory buffer, and the routine reading the WAL pauses where it is if it’s not able to append new data to the buffer. This means we no longer drop data if the buffer is full, and the buffer doesn’t need to be large enough to handle a longer outage.
As long as the remote endpoint isn’t down for hours, remote write no longer loses data (with some caveats, like Prometheus restarts), since the WAL is truncated every two hours or so.
Troubleshooting and metrics
Remote write metrics
The list of metrics for remote write can be found here and here.
Here’s a look at some remote write and remote write-adjacent metrics and what info they give us.
prometheus_wal_watcher_current_segmentshows the current WAL segment file that each remote write instance is currently reading from. This metric can be compared to the following one as the first step to determining if remote write is falling behind.prometheus_tsdb_wal_segment_currentis the WAL segment file that Prometheus is currently writing new data to.prometheus_remote_storage_highest_timestamp_in_secondsessentially shows the highest timestamp (i.e. newest in terms of chronology) that has been stored in the WAL for any sample.prometheus_remote_storage_queue_highest_sent_timestamp_secondsshows the highest timestamp successfully sent by remote write.prometheus_remote_storage_shardswill tell us how many shards are currently running for each remote endpoint.prometheus_remote_storage_shards_minandprometheus_remote_storage_shards_maxshow us the min/max shards based on your current configuration.prometheus_remote_storage_shards_desiredwill show us how many shards the sharding calculation wants to run based on the throughput and rate we talked about earlier.prometheus_remote_storage_retried_samples_totalcould indicate problems with the network or remote storage endpoint if there is a steady high rate for this metric. That may mean we need to reduce throughput of remote write to reduce load on the other end.prometheus_remote_storage_sent_batch_duration_seconds_bucketcould also give us more of an indication of the same issues. This is a histogram of latency for sending to the remote endpoint.
Problems and troubleshooting
One common issue is that as a result of a config reload or Prometheus restart, remote write can fall behind in the WAL in terms of sending on to the remote endpoint.
By looking at prometheus_remote_storage_highest_timestamp_in_seconds and prometheus_remote_storage_queue_highest_sent_timestamp_seconds, you can get a sense of how far behind remote write is for a given endpoint.
The Prometheus mixin includes an alert that uses these last two metrics to alert us about remote write falling behind.
In the event of longer outages, you might consider looking at prometheus_wal_watcher_current_segment and prometheus_tsdb_wal_segment_current. These values should be the same 99% of the time, but in the event of a long outage and compaction of the Prometheus TSDB, roughly the oldest ⅔ of WAL segments are considered for deletion.
Additionally, remote write makes use of sharding to increase it’s throughput capacity. We distribute all the samples we need to send across a set of shards and scale the number of shards based on recent throughput vs. the rate of samples coming in.
First, if remote write is behind we should check if we’re already running the maximum number of shards using prometheus_remote_storage_shards and prometheus_remote_storage_shards_max.
We should also be looking at prometheus_remote_storage_shards_desired to see if it’s value is greater than prometheus_remote_storage_shards_max.
If desired shards is greater than max shards, you may want to consider bumping up your max_shards value in your config for that remote write queue.
The mixin also includes an alert for this.
Configuration options
If we want to increase or reduce throughput, we can tweak the following queue config parameters:
min_shardsandmax_shardsUsually you would not changemin_shardsunless you have a minimum number of shards you know your remote write is always going to use, in which case increasing this value could improve recovery time when Prometheus restarts. It’s more likely you’d want to changemax_shards, either to increase or reduce the maximum throughput by setting a limit for this value. For example, in the case of remote write falling behind and never catching up, if you look at the desired shards metric and see it’s been greater than the max shards metric, you may consider increasing this value.max_samples_per_sendThis is essentially the batch size of each remote write send. Increasing this value can increase throughput for the same # of shards and same # of packets. If you suspect your network is congested by many remote write sends of small sizes, bump this value up.capacityThis is the buffer size for each individual shard. Generally this should be able to handle buffering a few requests, based on themax_samples_per_send. You can increase this value to increase the throughput of each shard or increase this value while reducing max shards to attempt to get the same throughput for less network overhead.batch_send_deadlineThis is the maximum amount of time between sends for an individual shard. If we don’t buffermax_samples_per_sendbefore this amount of time, we send what we have buffered. Generally you won’t want to change this value. But if you turn on debug logging, you’ll be able to see if your shards are hitting this deadline, which could indicate your configuration allows for more throughput than you need or there’s potentially a bug if you’re seeing these log lines plus remote write not down sharding.min_backoffandmax_backoffThese are used to retry sends of a single batch of samples from a shard. Because we try to not lose your data, retries are endless. If you suspect retries are happening too often and increasing your network load, you may want to increase the max backoff.
Conclusion
Remote write is still being actively worked on, and we have plans for further improvements to both remote write and the other portions of Prometheus that it relies on with the goal of making the system more reliable. If you run into bugs, have suggestions for improvements, or want to make a contribution yourself, please reach out to the remote storage maintainers on GitHub or any official Prometheus discussion platform.