
Using Telegraf plugins to visualize industrial IoT data with the Grafana Cloud Hosted Prometheus service
One of the biggest challenges with data visualization for complicated software systems is getting quick access to the underlying data and connecting it to some form of cloud-hosted solution. Traditionally it has required quite a bit of middleware and upfront setup with additional tooling. But with the advent of Grafana Cloud and the wider open source tooling infrastructures such as Telegraf, it is much easier to siphon off data from complicated and highly specialized systems and into battle-tested, open source metric and visualization tools such as Prometheus and Grafana. And there’s the added benefit of low-cost and flexible long-term data storage.
Here we will focus on one such application within the industrial IoT sector for a Modbus-based PLC system, leveraging Telegraf plugins and the Grafana Cloud stack!
Getting started
Modbus is a data communications protocol originally published by Modicon (now Schneider Electric) in the late 1970s for use with its PLCs. Modbus has become one of the de facto standard communication protocols and is now a commonly available means of connecting industrial electronic devices.
Grafana Cloud is a composable observability platform, integrating metrics, logs, and traces with Grafana. It helps users leverage the best open source observability software – including Prometheus, Grafana Loki, and Grafana Tempo – without the overhead of installing, maintaining, and scaling them.
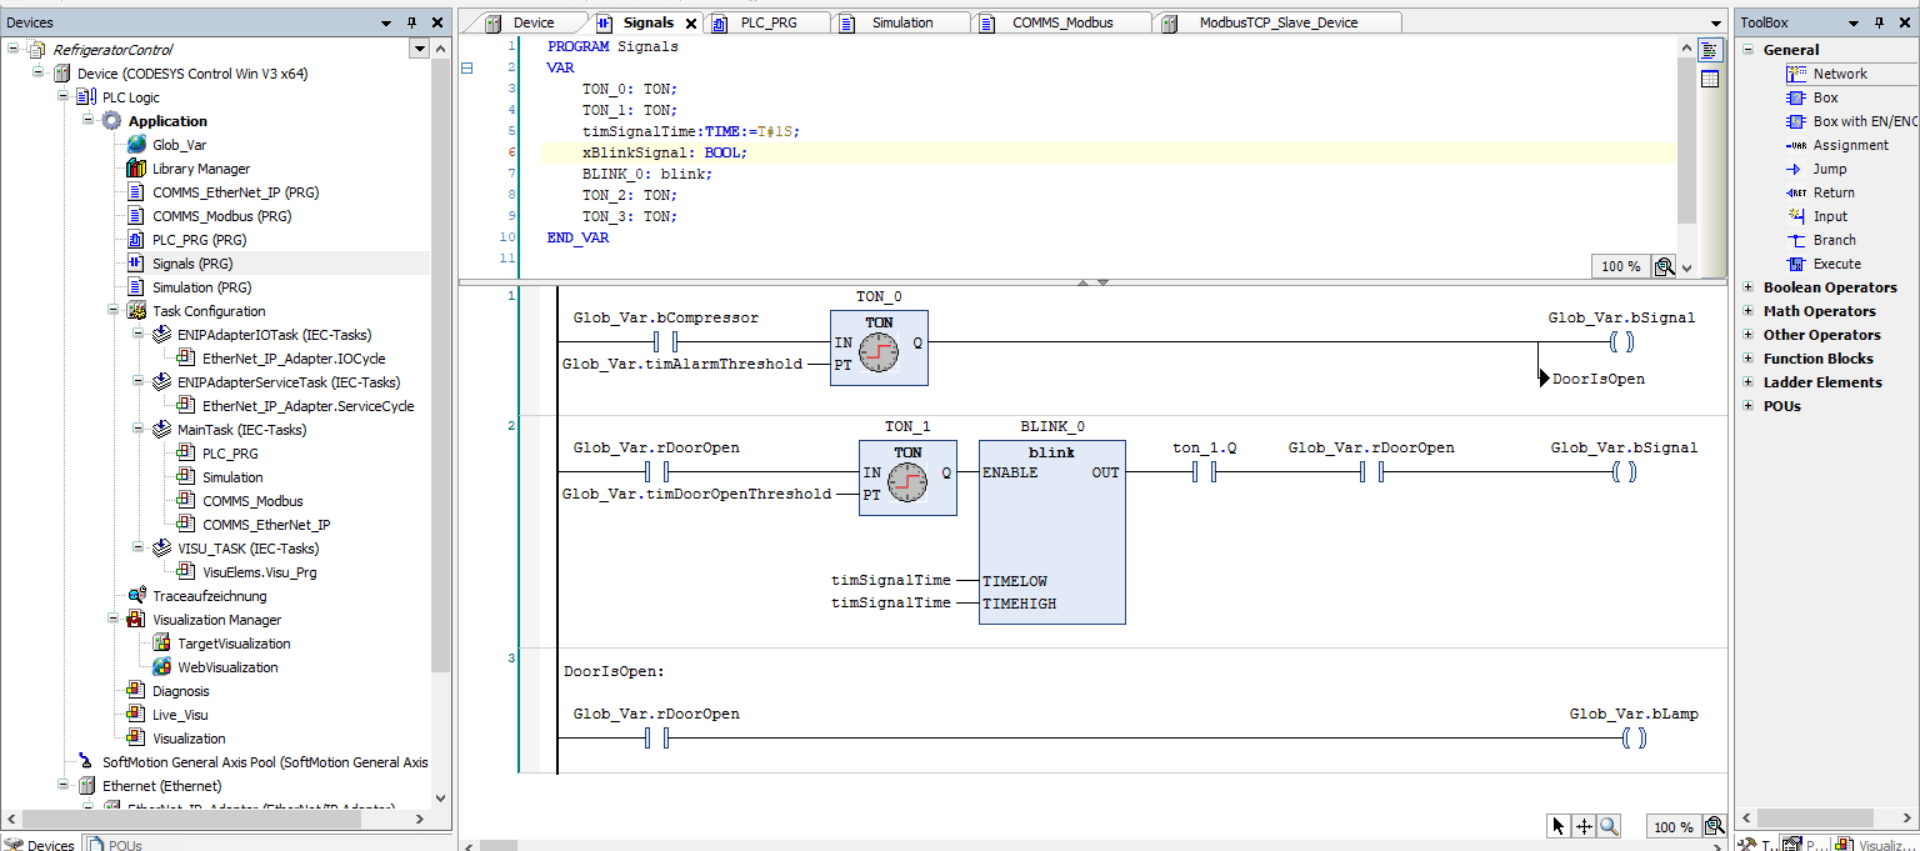
In order to generate some realistic data streams for this demonstration, we created a simple real-time PLC simulator based on the Codesys Control SoftPLC system.
We adopted the demo Refrigerator Controller project to support a simple Modbus Client Device, with all the associated program inputs and outputs mapped to their respective memory structures as supported by the protocol. Let’s take a glimpse at what that was like.
The simulated system was programmed with the industry standard IEC 61131-3 programming languages and data types.

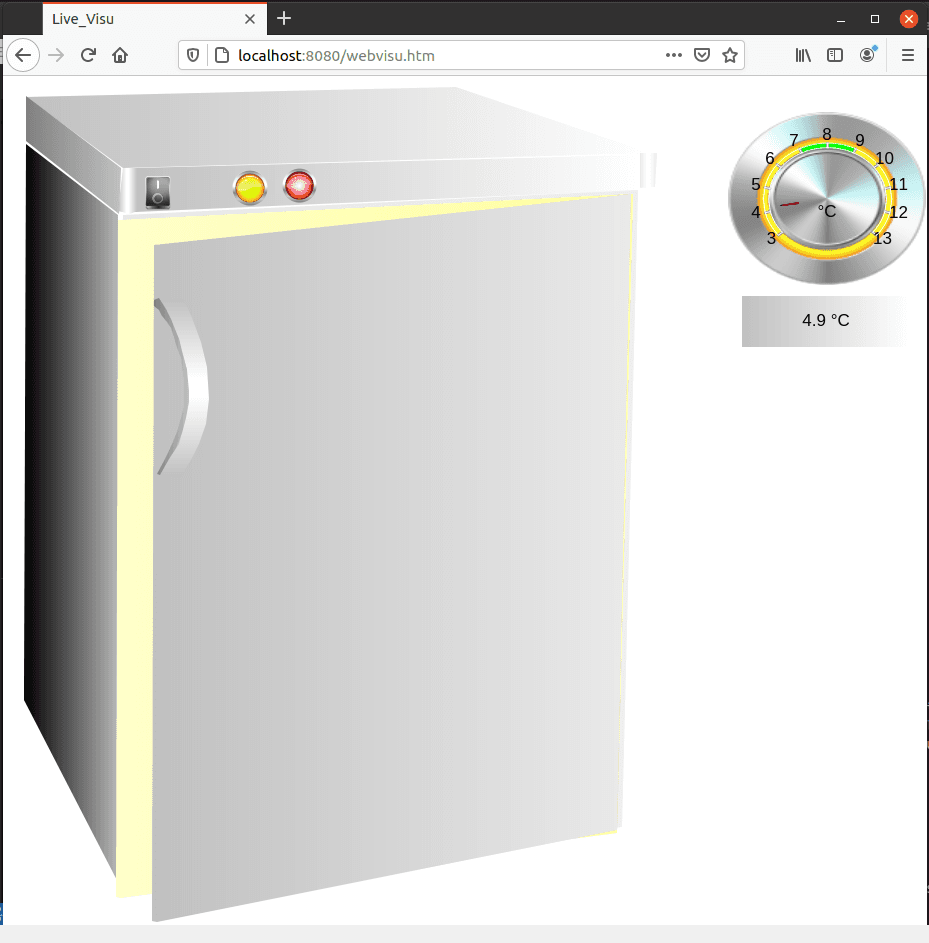
The simulated Refrigerator was made available over the browser interface so that a user can interact with it as shown below:
In order to monitor the important parameters related to the Refrigerator controller (namely the temperatures and the status indicators), we leveraged the Grafana Cloud Hosted Prometheus service to push the data streams out to the cloud to be visualized in Grafana, also hosted on the cloud as part of the observability stack!
We used the open source Modbus Telegraf input plugin to scrape the desired data from the simulation at a set interval, using the standard settings native to the plugin. In order to get this data out to the Hosted Prometheus service, we used the HTTP Telegraf output plugin. Here is what the minimum required output configuration looked like:
# A plugin that can transmit metrics over HTTP
[[outputs.http]]
  ## URL is the address to send metrics to
  url =

  ## HTTP Basic Auth credentials
  username =
  password =

  ## Data format to output.
  data_format = "prometheusremotewrite"

  ## Additional HTTP headers
  [outputs.http.headers]
     Content-Type = "application/x-protobuf"
     Content-Encoding = "snappy"
     X-Prometheus-Remote-Write-Version = "0.1.0"
Note: You can obtain the necessary configuration parameters for your instance of the Grafana Cloud Hosted Prometheus service under your Grafana.com account portal.
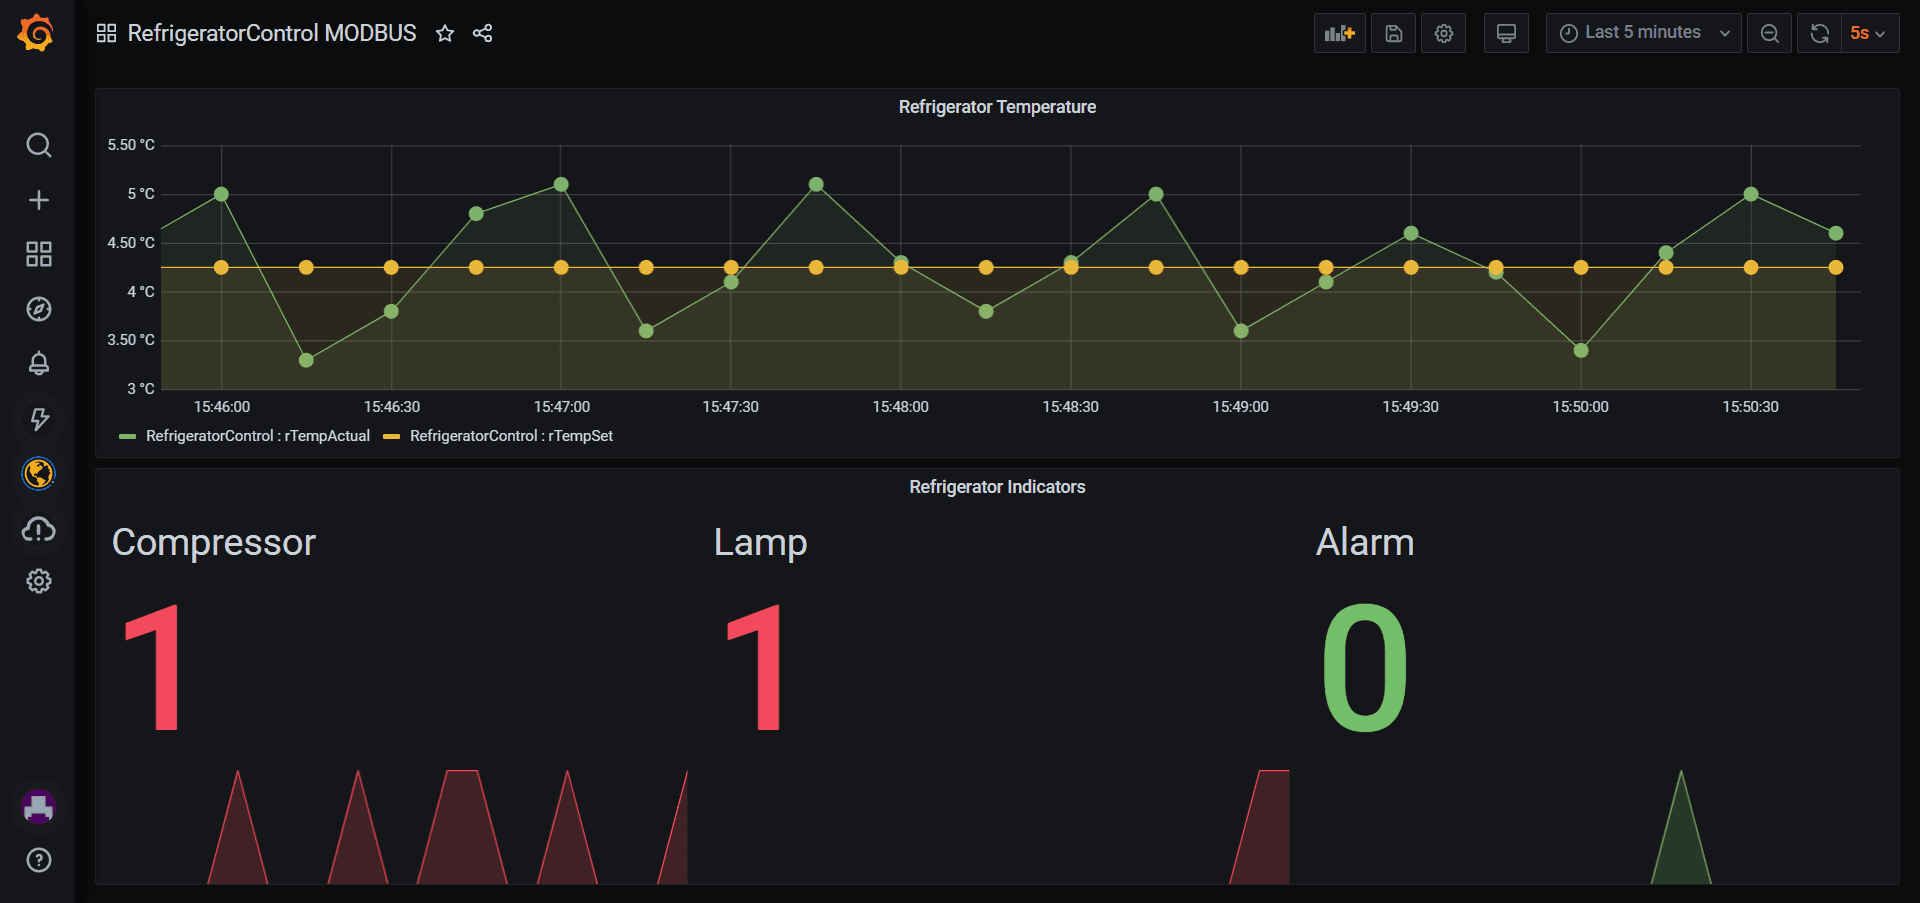
Next, it was time to visualize the metrics as usual using the hosted Grafana instance. All the exported metrics were made available by the Prometheus data source in Grafana. Here is a simple dashboard we came up with. Tada! 🎉
Conclusion
This simple demonstration shows how easy it is to send metrics using Telegraf plugins to the Grafana Cloud infrastructure, without the pain of setting up your own instances for Prometheus, Loki, and Tempo. These tools are already part of the full observability stack available to you with Grafana Cloud at a very affordable cost. We’ve also introduced a great free tier that includes 10K series for Prometheus or Graphite metrics and 50GB of logs — ideal for any experimentation with your existing applications. You can create a free account here.

