Intro to exemplars, which enable Grafana Tempo’s distributed tracing at massive scale
Exemplars are a hot topic in observability recently, and for good reason.
Similarly to how Prometheus disrupted the cost structure of storing metrics at scale beginning in 2012 and for real in 2015, and how Grafana Loki disrupted the cost structure of storing logs at scale in 2018, exemplars are doing the same to traces. To understand why, let’s look at both the history of observability in the cloud native ecosystem, and what optimizations exemplars enable.
At their core, exemplars are a way to jump from meaningful metrics and logs to traces via an ID. Grafana Tempo, Grafana Labs’ open source, high-scale distributed tracing backend, is built around this idea, as exemplars make the cost and performance characteristics of distributed tracing a lot nicer. Ideally, you never have to sample your traces, and Tempo makes that realistic.
History
Prometheus
Ignoring Prometheus’ outstanding scalability, compression, and performance for a moment, let’s focus on the label sets: They are metadata about your time series. What cluster, what service, which customer, what deployment level, and more can all be encoded in non-hierarchical key value pairs. If you’re reading this, I will most likely not need to convince you of how disruptive, impactful, and long-lasting this change to the industry was; I would merely like to remind you of it, as it’s relevant in the rest of the text.
This was revolutionary just a few years ago:
acme_http_router_request_seconds_sum{path="/api/v1",method="GET"} 9036.32
acme_http_router_request_seconds_count{path="/api/v1",method="GET"} 807283.0
acme_http_router_request_seconds_sum{path="/api/v2",method="POST"} 479.3
acme_http_router_request_seconds_count{path="/api/v2",method="POST"} 34.0
OpenMetrics
Already back in 2015-2016, my intention was to apply the same label sets to logs and traces as well. That’s why OpenMetrics has been living in a GitHub org called OpenObservability since 2017 and not “just” an org called OpenMetrics.
Grafana Loki
With Loki, that dream came true in 2018: Seamlessly move between your metrics and logs, without issue. That’s where the tagline “Like Prometheus but for logs” is coming from.
That leaves us with applying label sets to traces, right?
OpenMetrics & OpenCensus
In 2017, OpenMetrics and OpenCensus met, trying to see if the two projects could merge. While that didn’t work out due to incompatibilities in design goals, operational model, and data model, this meeting still changed the fate of OpenMetrics and Prometheus, and was the nucleus of what has led to Grafana Tempo.
I presented my idea of applying the same label sets Prometheus puts on metrics and traces, and some of the Googlers present dismissed this for traces; they told me searching does not scale.
Let me emphasize that point: Googlers told me that searching for traces does not scale.
If Google tells you that searching for something does not scale, you’d better listen and make that your happy path.
While the meeting notes sadly don’t capture who made that point so I can’t credit them, or say much about exemplars at all, it was important enough back then to write it down; if only as just a single word.
Fun fact: In those notes, you can see that OpenMetrics was still living in a personal repo at that time: https://github.com/RichiH/OpenMetrics.
Second fun fact: Initially https://github.com/OpenObservability/OpenMetrics was forked from https://github.com/RichiH/OpenMetrics. GitHub had to change that by hand in the database as there were no processes to support this, back then.
Today; or exemplars 101
Essentially, exemplars are about three ideas:
- Tightly couple traces to other observability data.
- Jump into traces by ID only.
- Jump into traces only if you know the trace is interesting, and why. Avoid the needle-in-haystack.
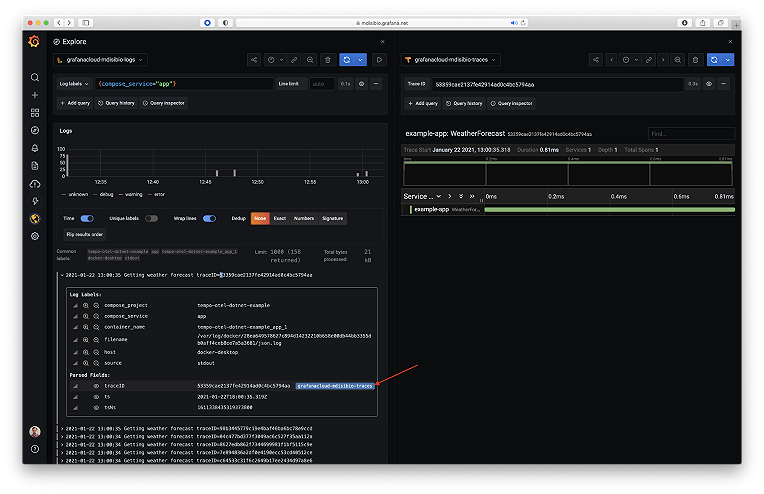
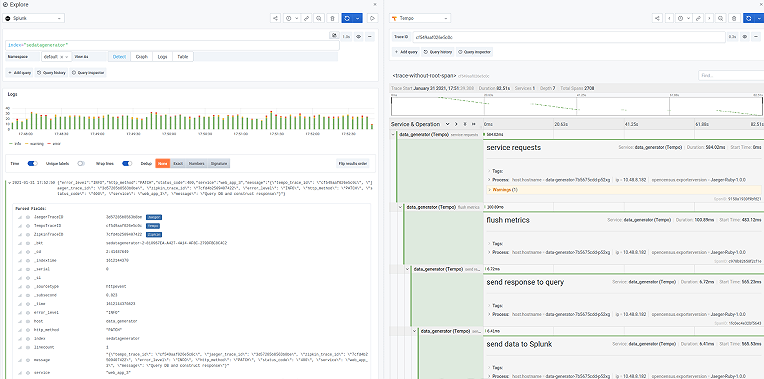
Tightly coupled
It’s trivially easy to attach trace IDs to metrics via exemplars. Put a # after your metric value (and potentially timestamp) to signal that an exemplar is present, and add your data.
Borrowing the example from the OpenMetrics specification:
# TYPE foo histogram
foo_bucket{le="0.01"} 0
foo_bucket{le="0.1"} 8 # {} 0.054
foo_bucket{le="1"} 11 # {trace_id="KOO5S4vxi0o"} 0.67
foo_bucket{le="10"} 17 # {trace_id="oHg5SJYRHA0"} 9.8 1520879607.789
foo_bucket{le="+Inf"} 17
foo_count 17
foo_sum 324789.3
foo_created  1520430000.123
If the trace_id label name and value remind you of the spec proposed by the W3C Distributed Tracing Working Group, that’s not a coincidence. We deliberately took in the W3C spec, while not mandating it. This allows us to build on existing specification work, while not tying OpenMetrics down before the distributed tracing space has settled down.
Let’s look at the actual exemplars in there:
The histogram bucket showing latencies of less than one second has a trace with a runtime of 0.67 seconds and the ID KOO5S4vxi0o.
The histogram bucket showing latencies under 10 seconds has a trace with a runtime of 9.8 seconds at a time of 1520879607.789 with the ID oHg5SJYRHA0.
That’s. It.
ID only
Indexes are expensive. Putting the full context and metadata on a trace means you need to search for traces by them, and that means indexing them. But you want to have the same labels on your metrics, logs, and traces (and continuous profiles, crashdumps, etc.). But as you already have that metadata on your other data, how about reusing the same indexes to save cost and time?
By attaching traces to a specific time series or log at a specific point in time, you can do just that. For the traces themselves, you simply index on the ID, and done.
Interesting traces only
Automated trace analysis is a wide field; a lot of superb engineering power is spent on making this haystack searchable.
What if there was a cheaper and more efficient way?
Logs can already tell you about an error state or similar. You do not need to analyze traces to find that error.
Counters, histograms, etc. in metrics are already a highly condensed and optimized form of data, distilled to what matters in this context. You do not need to analyze all traces to find that one trace that shows a high latency.
Your logs and your metrics already tell you why a trace is interesting. Your labels give you the context of how and where that trace was generated. At the point of jumping into the trace, you already know what you’re looking for and why. This speeds up discovery a lot.
Summary
The summary could be this: Engineering is always about trade-offs made to accommodate design goals and constraints.
Prometheus shifted the industry at large to a new set of trade-offs, creating the bedrock of cloud native observability. Grafana Loki is doing the same to logging. Grafana Tempo is doing it for distributed tracing through the power of exemplars.
Tempo’s job is to store massive amounts of traces, place them in object storage, and retrieve them by ID. As all of this follows a holistic design, moving seamlessly between metrics, logs, and traces has become possible at truly cloud native scale.

Exemplars have been supported in Grafana since 7.4. You can get free open-beta access to Tempo with Grafana Cloud.
And, as always, The Pitch: As you can see, many innovations that are new today come after years of vision and preparation. I am in the very lucky position to be able to choose where I work, and I chose to work at Grafana Labs because it shares my vision. If you think your vision is similar, or if you just want to see and support how our shared vision is pursued from within, we’re always hiring as fast as we can.