

What’s new in Grafana Cloud for March 2021: improvements to alerting, synthetic monitoring, and more
As the product manager for Grafana Cloud, I am constantly following the progress of all the new features that our engineering teams are working on, from early ideation to release. We’re always excited to share updates with the community, so you can all try them out and let us know what you think. So each month, I’ll be rounding up the latest Grafana Cloud features and improvements on the blog.
If you’re not already familiar with it, Grafana Cloud is the easiest way to get started observing metrics (Prometheus and Graphite), logs (Grafana Loki), traces (Grafana Tempo), and dashboards. We have free and paid Grafana Cloud plans to suit every use case — you can sign up for free now.
Here’s what we’ve been up to! Grafana Cloud users will start seeing these features rolled out over the next few weeks.
Agent and integrations
We continue to make big improvements to the agent and integrations, giving you more ways to get started monitoring your systems with as little friction as possible.
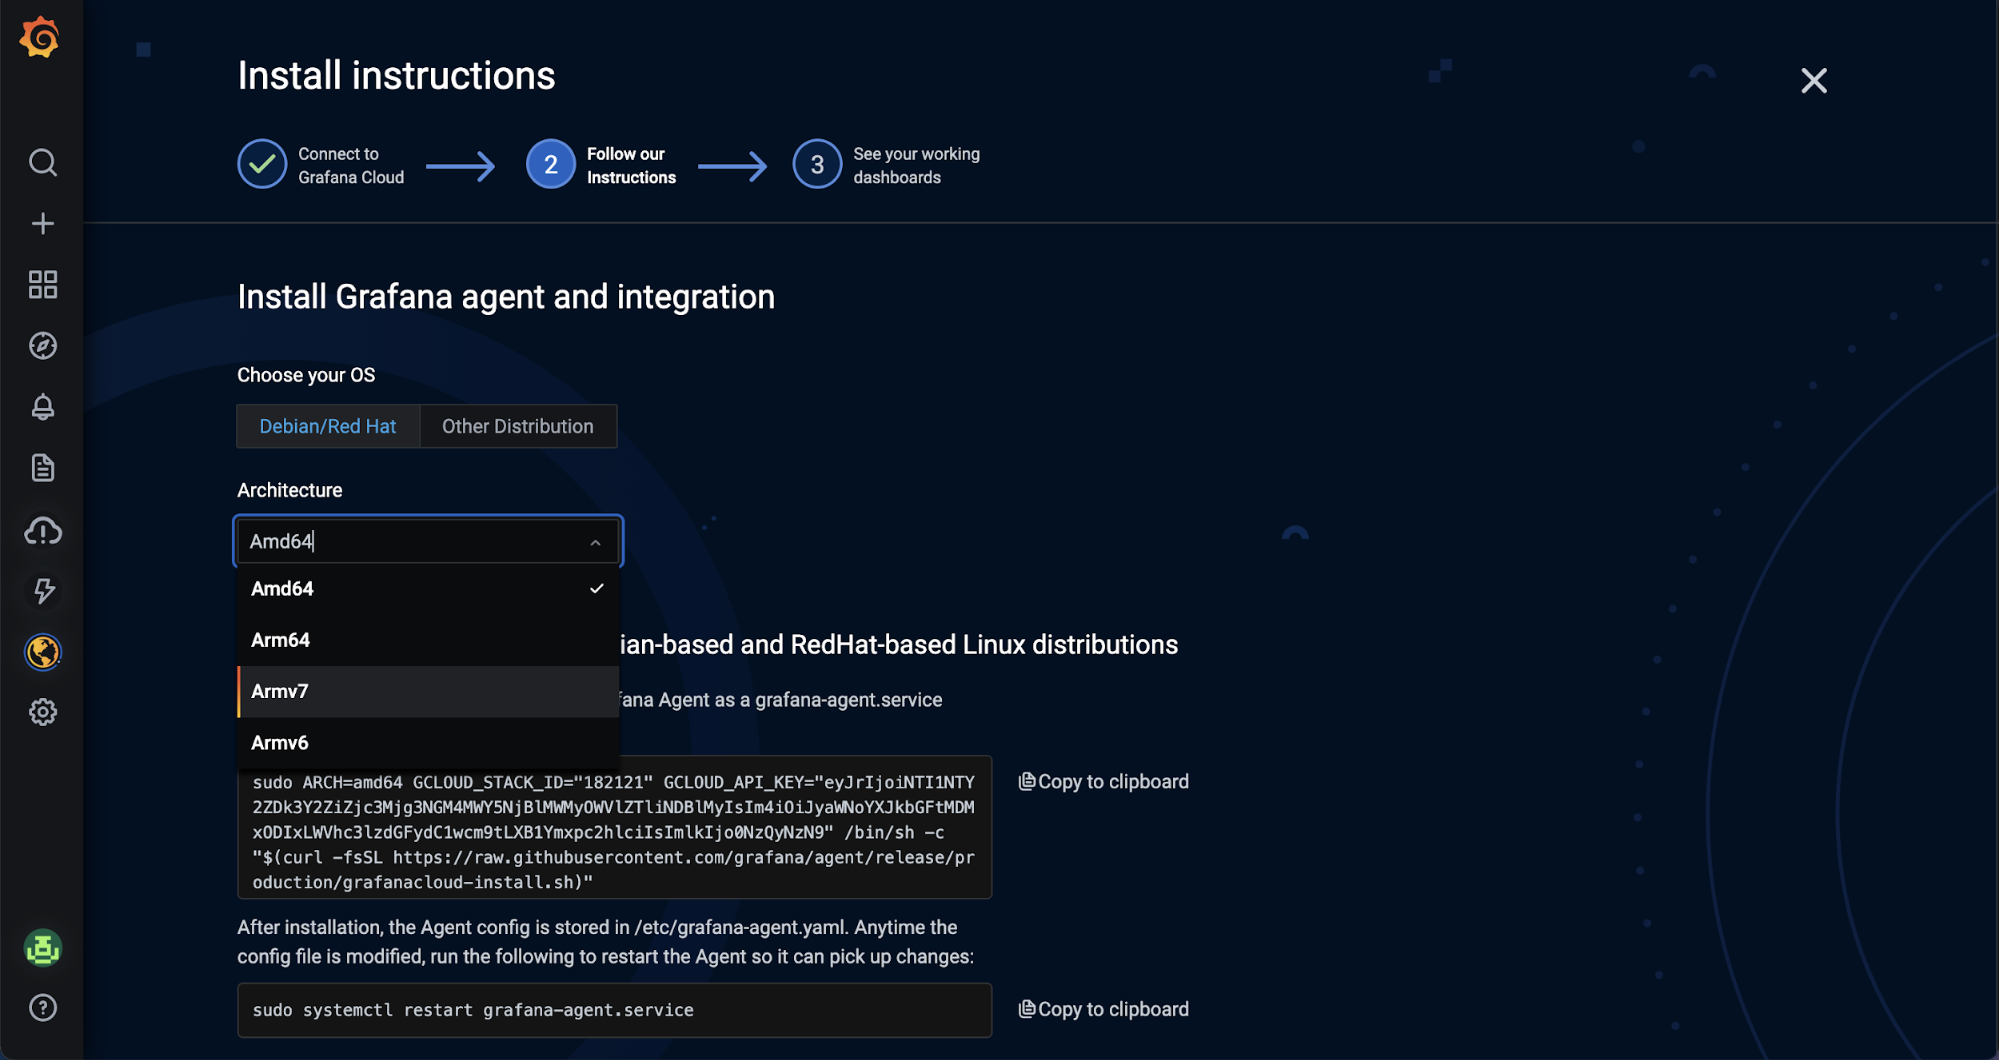
- The agent and integrations are now easier than ever to install, packaged together for different architectures for RedHat-based or Debian-based operating systems. This means you can now configure a new integration with just one copy-and-paste command instead of three.
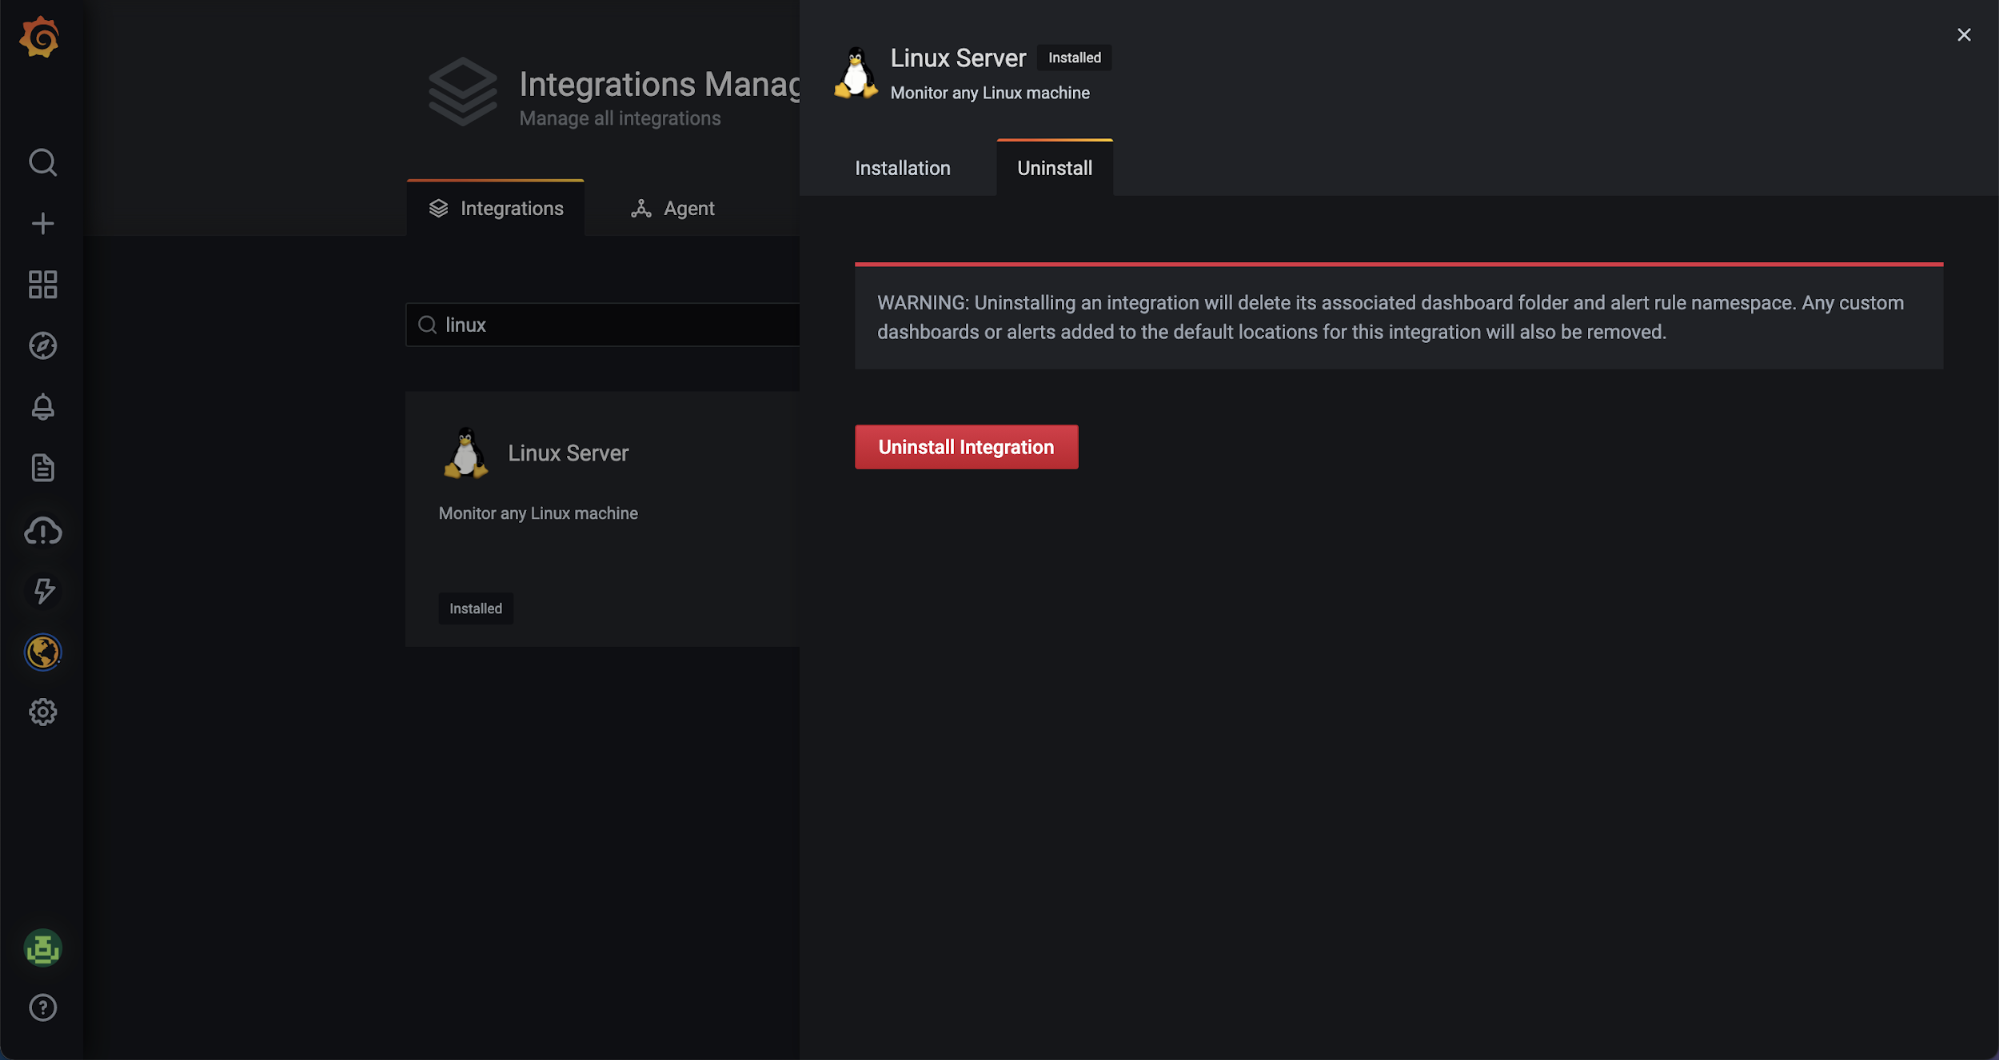
- Managing integrations has gotten more simple, with a one-click uninstall added to the integrations management page. This will automatically remove the Grafana dashboard folder and its content as well as the cloud alerting rule groups and its content, which are tied to the integration.
Cloud alerting
A few quality-of-life improvements have been released for the cloud alerting interface.
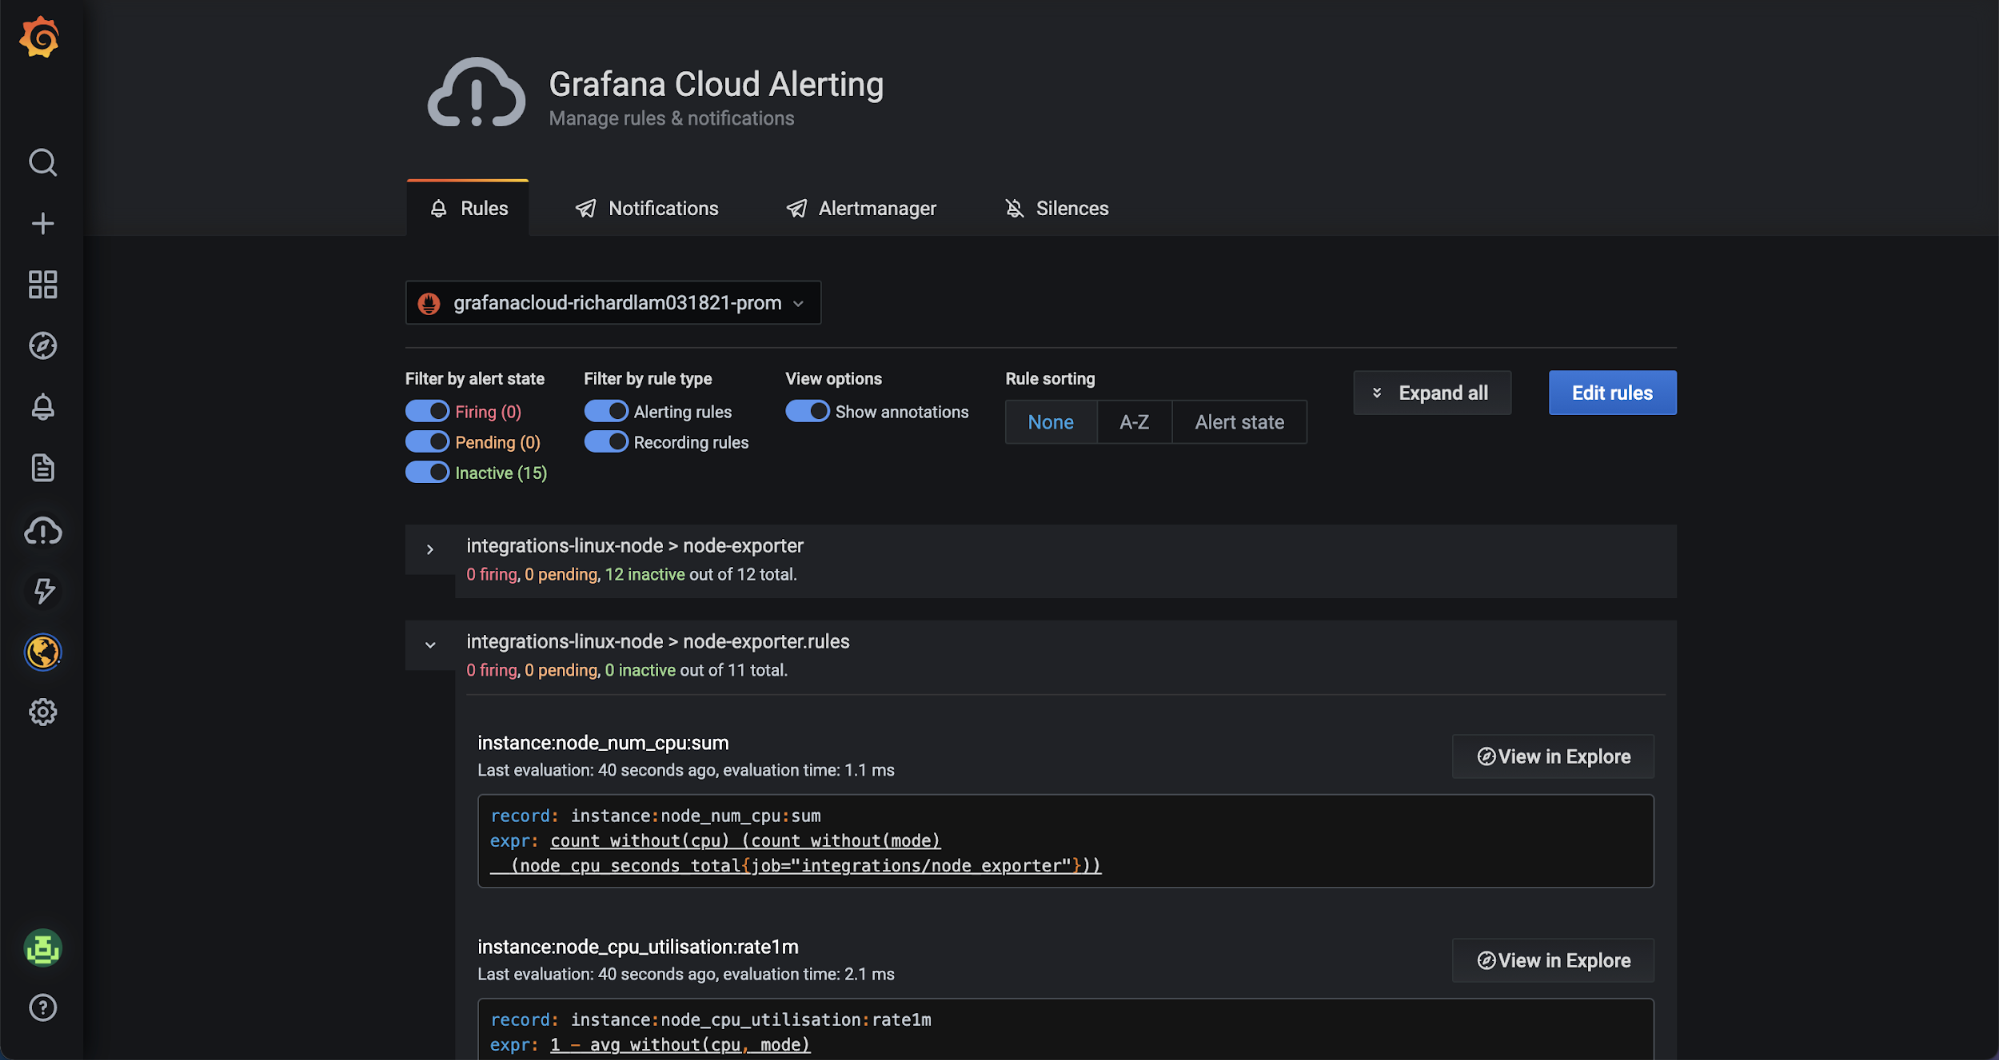
- The Rules page has been updated to make things a little bit easier to read. As a part of this change, rule groups are now collapsible in the list, and rules are easier to discern across groups.
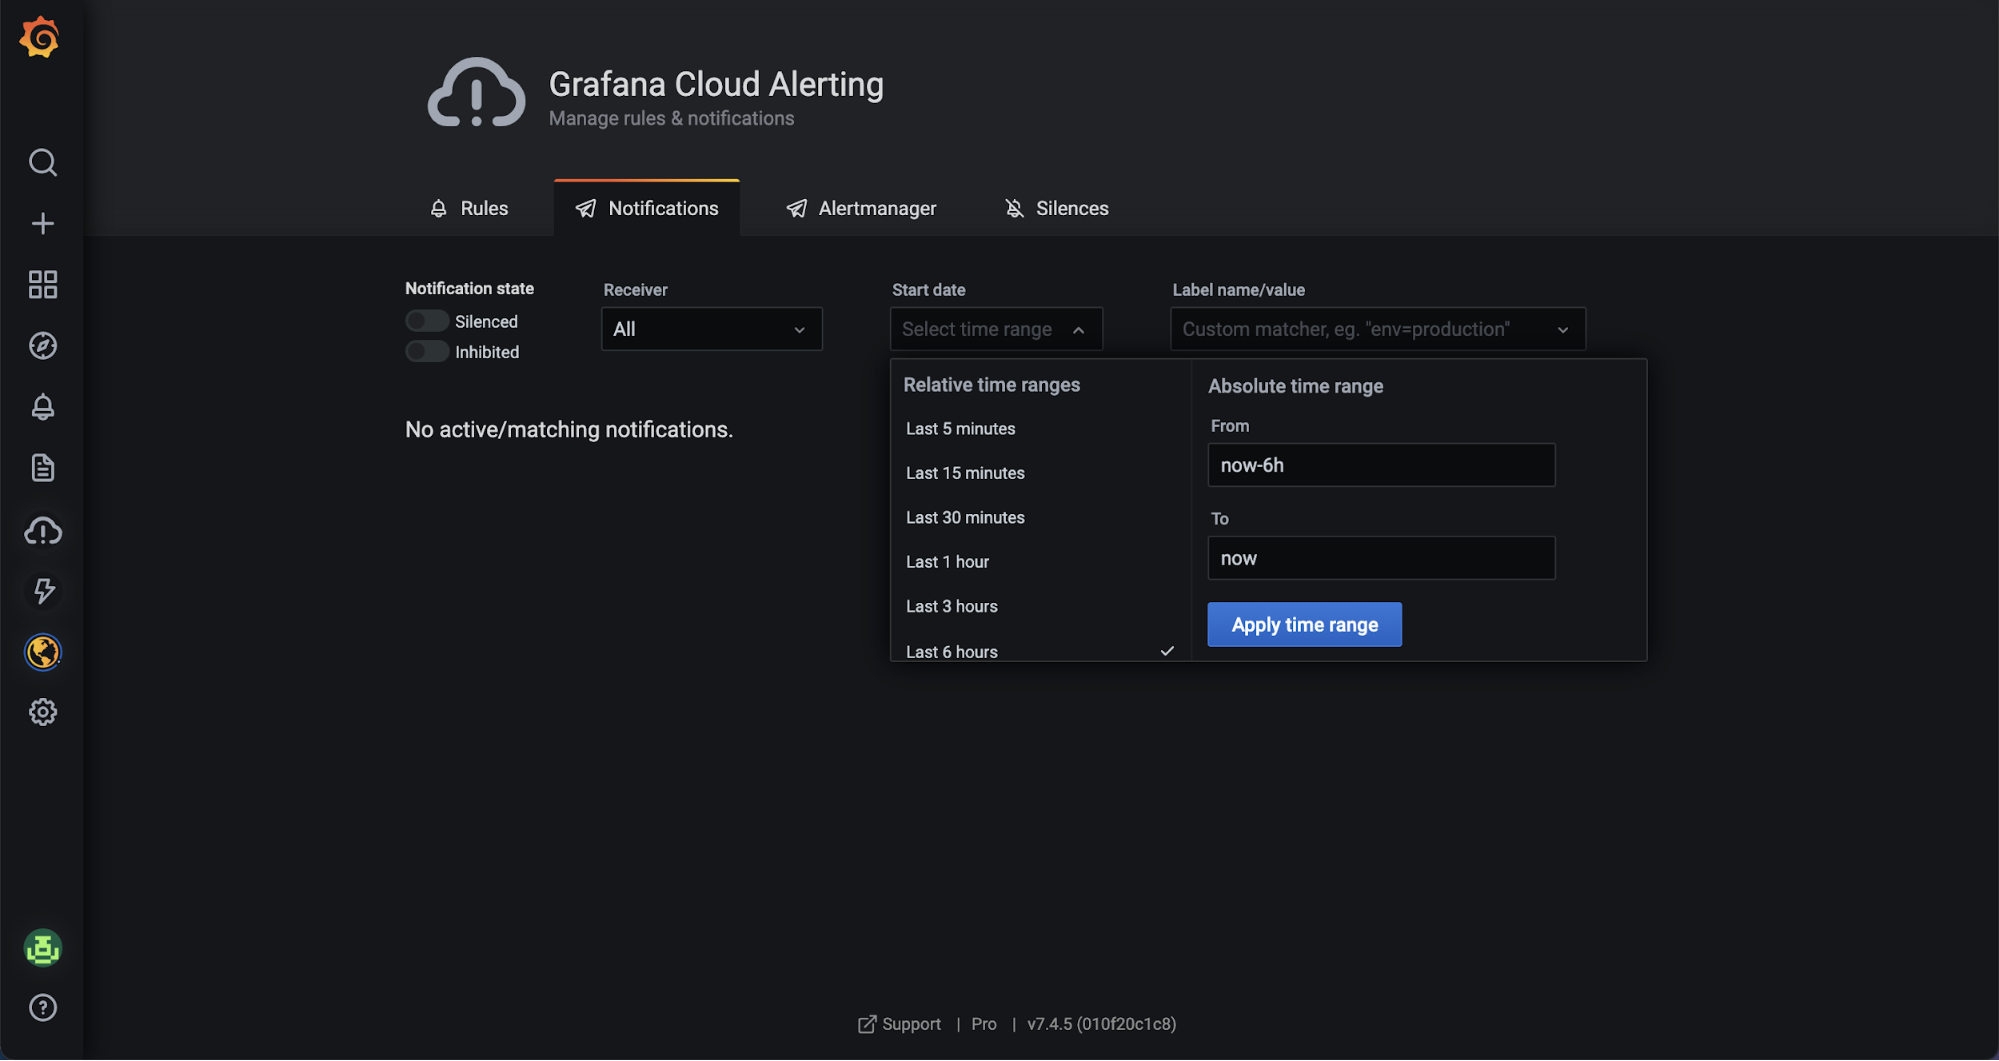
- Date and time filters have been added to the Notifications page, and they work in a similar way to how you apply date ranges across queries.
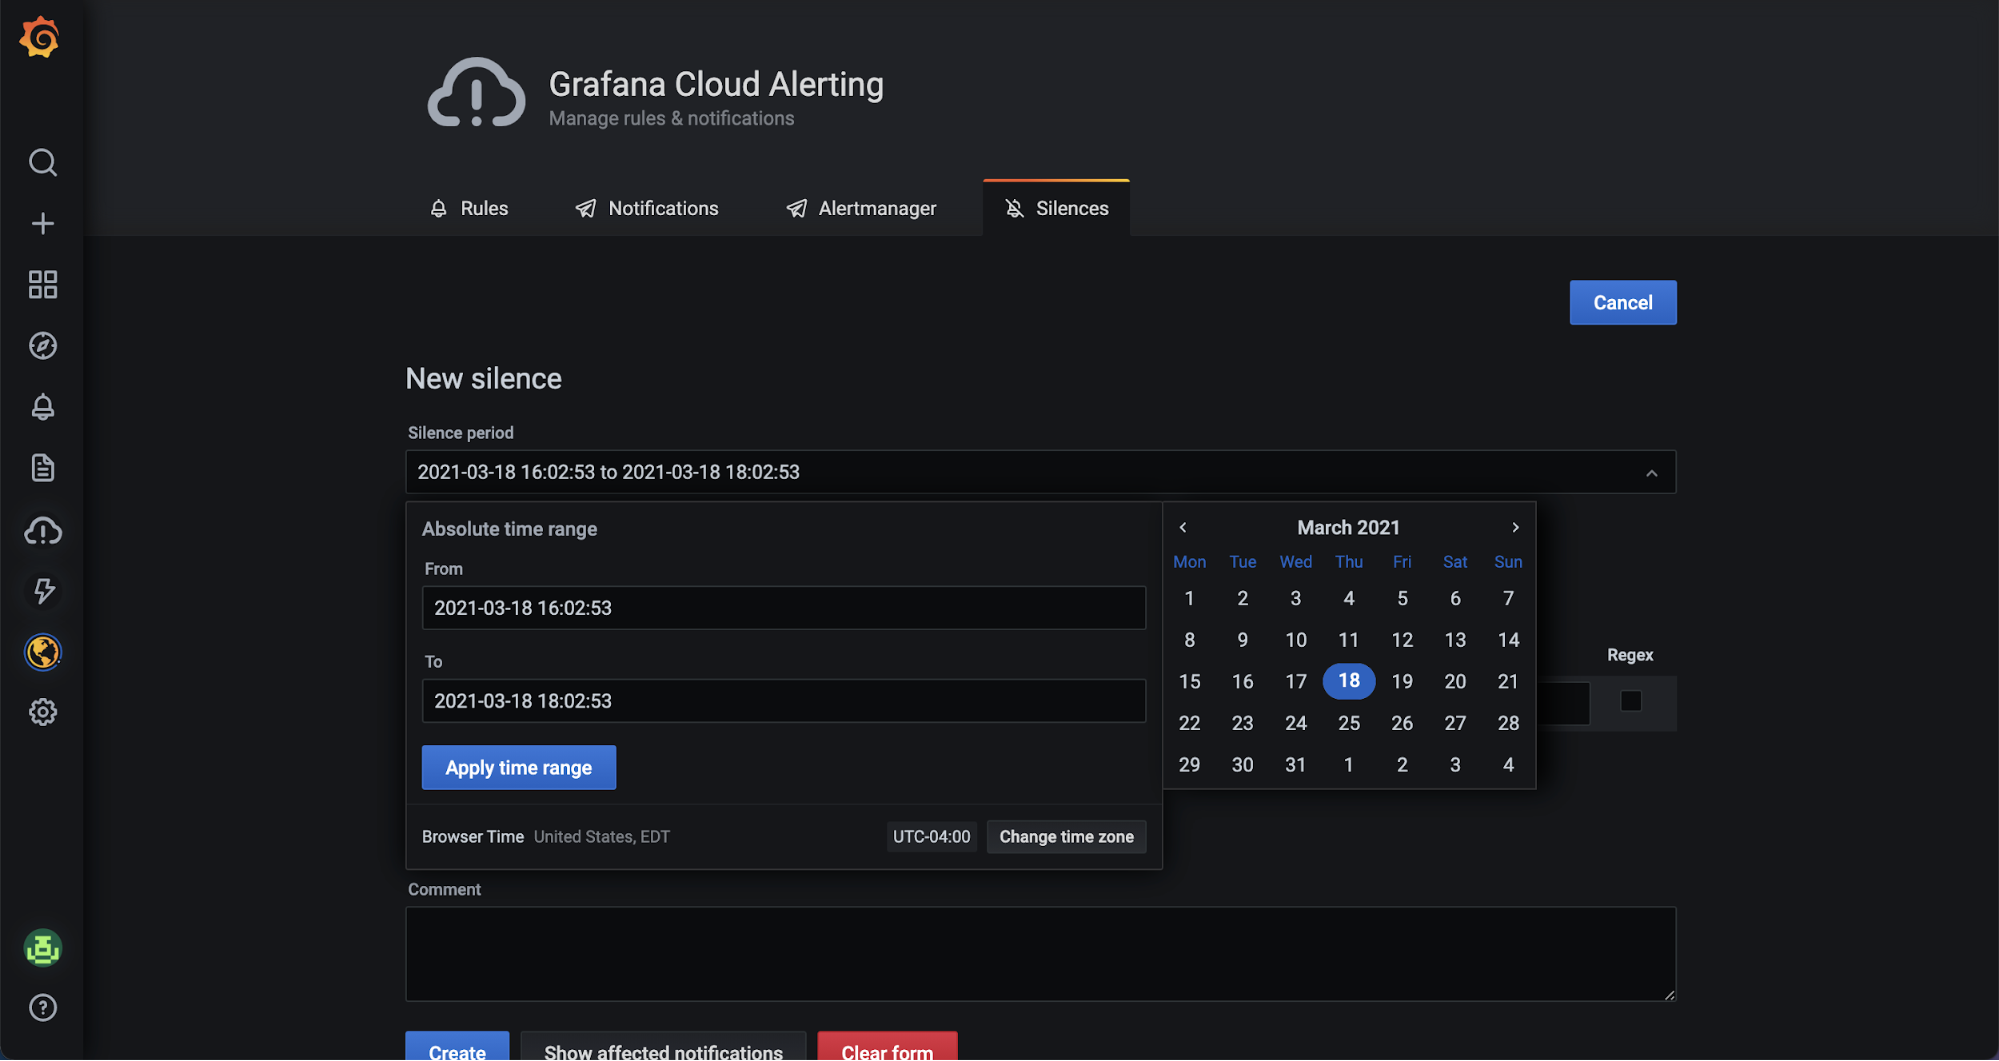
- Time range pickers have been added to the Silences page, so it’s easier to define your time period when scheduling a new silence.
Synthetic monitoring
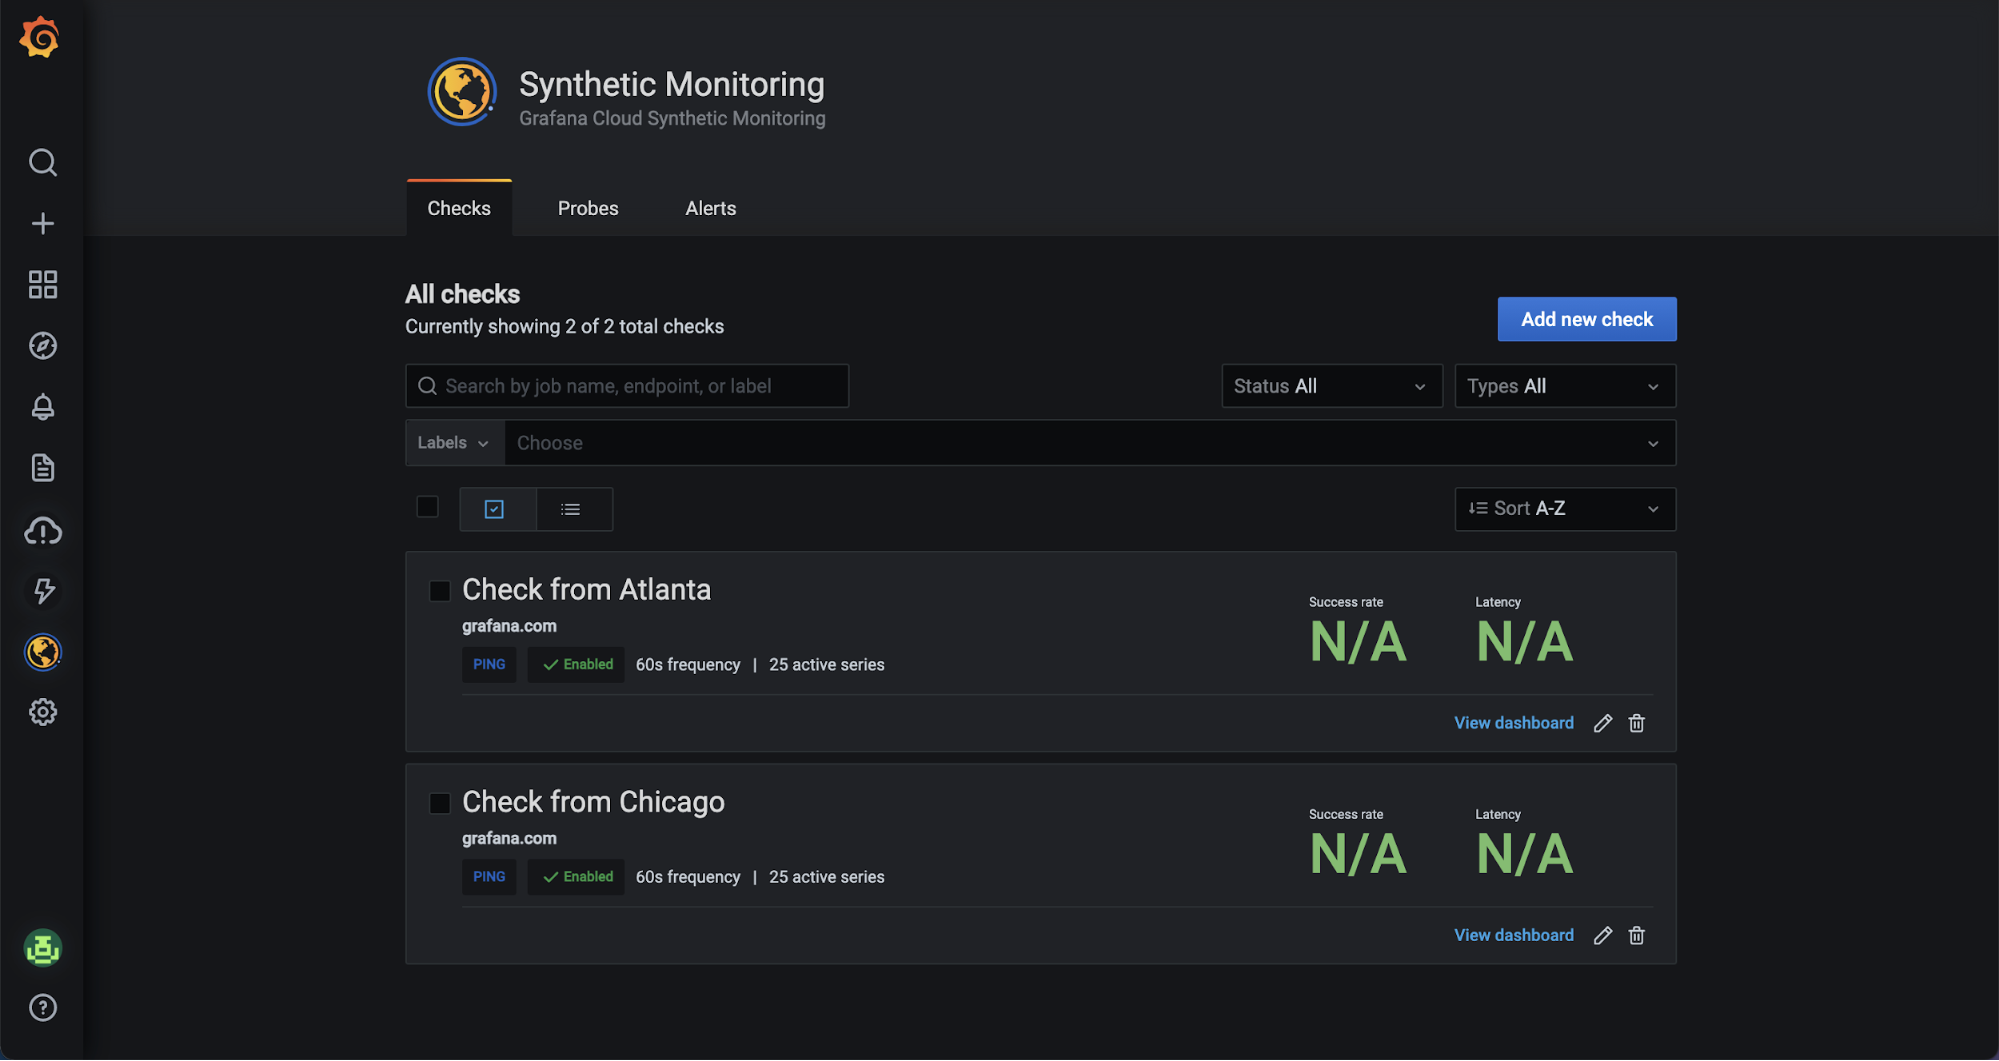
The checks page has gotten a moderate redesign to improve usability. It’s now easier to get a sense of what’s happening with your systems with a quick glance, as we’ve added clearer labeling and better color coding to indicate different check types and statuses.
Additionally:
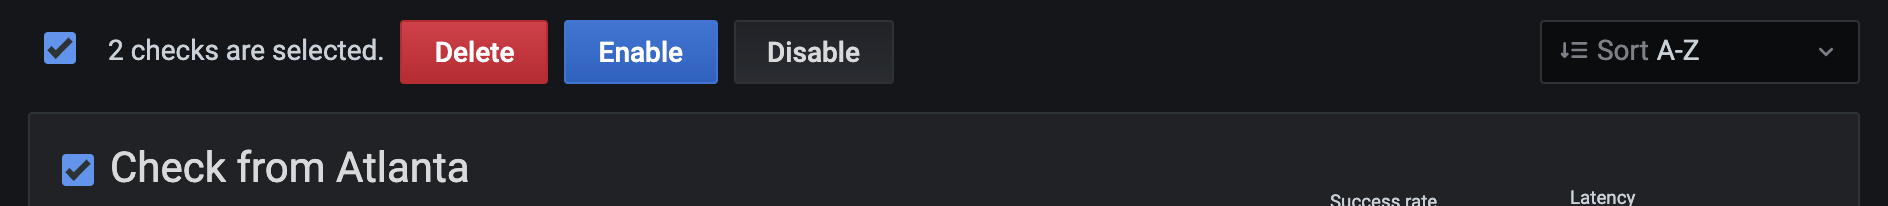
- You can now enable, disable, and delete a check directly from the main Checks page without having to open up each check individually. With this, you’ll also now be able to bulk perform these same actions across multiple checks at one time, all from the main page.
- There are now more powerful sorting and filtering options. Now you can filter by status and labels, or sort by ascending and descending job names.
- A compacted list view has also been added to make it easier to scan through a long list of checks.
New and updated guides
Finally, check out these guides that we published to help you get started with Grafana Cloud:
- QuickStart tutorial for sending your existing logs to Grafana Cloud via the Grafana Agent
- QuickStart tutorial for shipping your Kubernetes metrics to Grafana Cloud
I’ll be back next month with more updates. Until then, let us know what you think of the new features and improvements!


