

What’s new in Grafana Enterprise Metrics for scaling Prometheus: enhanced access control and a compactor that supports 650 million active series and beyond
I’m a fresh starter here at Grafana Labs, leading one of our teams working on the Grafana Enterprise Stack. As a longtime user of Grafana, I couldn’t wait to see what’s new in versions 1.1 and 1.2 of Grafana Enterprise Metrics (GEM), our scalable, self-hosted Prometheus service. I tried out the shiny features and wanted to share some of the cool things I found.
The power of labels strikes again: label-based access control within GEM
Over the past few years, I came to realize the power of labels, especially when I moved to the Kubernetes world and saw them in action.
I was pleasantly surprised when I saw that we’re now enabling users to create different access policies based on labels associated with their Prometheus metrics.
I decided to give it a try and start from a real-life problem that I encountered in the past while working with a team with both internal and external engineers. Due to contractual agreements, the external engineers didn’t have access to some specific metrics.
So I went ahead and created a new LBAC policy:
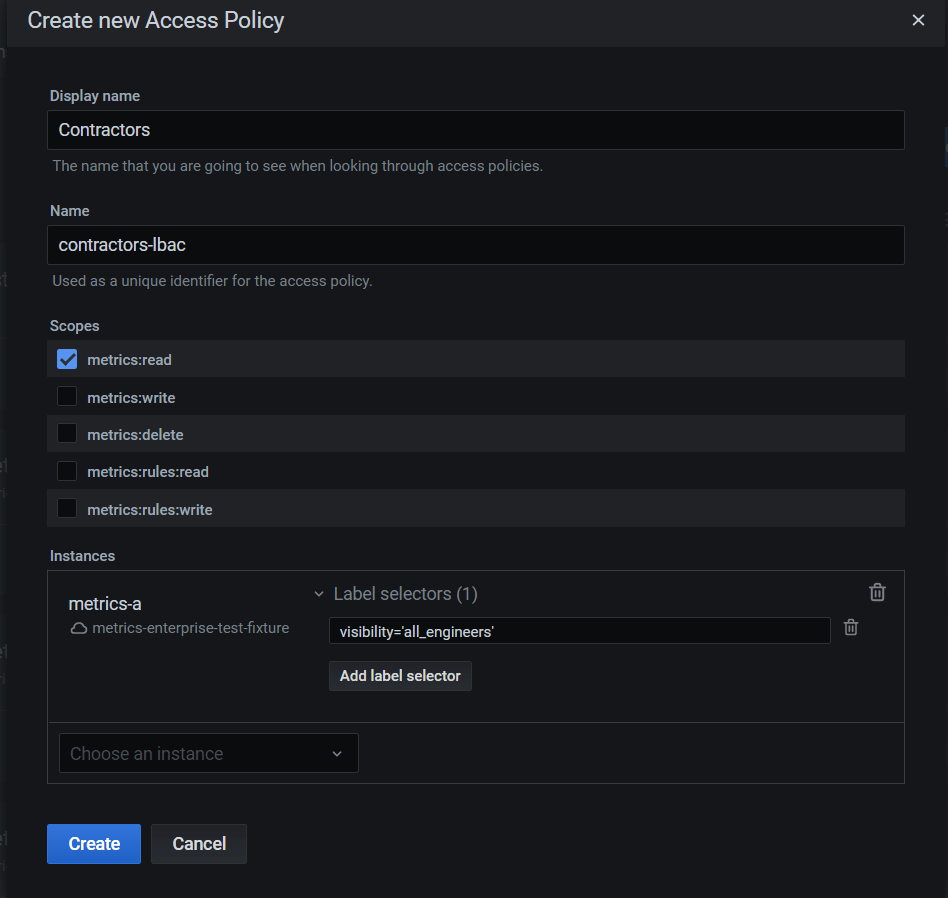
As you can see in the screenshot above, I created a new access policy for the contractors and used a label selector that basically says: Contractors can read metrics that are labeled to be visible to all engineers by using the visibility="all_engineers" selector.
Internal engineers would also have access to metrics labeled visibility="internal_engineers_only".
You can pretty much do any kind of operation with the label selector. You can find out more about label-based access control in the GEM docs.
Instance federation: perform cross-instance queries across your GEM cluster
This feature makes it super easy to view data from multiple instances. Imagine you have two teams: engineering-team and finance-team. Each of the teams needs to access their own metrics, but not the other team’s.
However, the leadership team would like to visualize metrics from both of these teams.
Cross-instance querying lets you do exactly this. You can set up separate data sources for Engineering and Finance, each of which point to their instance and only show the metrics they’ve written to the cluster. The leadership team gets a third data source that’s set up to query both instances simultaneously and return aggregated results across both. You can read more about instance federation in the GEM docs.
While we initially planned on building cross-instance querying for our paid Enterprise product, we decided it would be valuable to the entire open source community, so we shared it with the Cortex project (on which GEM is based).
On the Enterprise side, we made sure it integrated seamlessly with our access control features, so that only users with the right permissions can make cross-instance queries. This makes it possible to create wildcard access policies, enabling certain users to query across all Instances without having to name them.
We also integrated cross-instance querying with our label-based permissioning, so that Enterprise customers can create mixed access policies, like allowing Team A to simultaneously query all metrics in Instance1 plus all metrics in Instance2 where job="infra".
The art of concurrency: our new scalable compactor
You might know about the Cortex blocks storage compactor, a component of the Cortex architecture that de-duplicates and compacts small blocks of metric data into larger and more efficient blocks. (You can refresh your memory by reading the docs.)
However, in our experience at Grafana Labs, we’ve seen the Cortex compactor start lagging behind once you exceed about 20-30 million active series per instance. This can become a problem for teams trying to own more metrics, and it’s due to the fact that the default compactor cannot parallelize work when going through the data of a single instance. It’s all sequential!

GEM’s scalable compactor is able to compact data of a single large instance in parallel using multiple CPU cores on a single machine. I’ve asked the team how much it can handle now, and although we don’t have final results from our performance tests, I got an estimate: 650 million active series, an increase of 20x over what was previously possible!
I hope you’ll all enjoy the new features in Grafana Enterprise Metrics 1.1 and 1.2 as much as I did. Until next time!
Find out more
For a deeper dive into Grafana Enterprise Metrics, you can watch the “Running Prometheus-as-a-service with Grafana Enterprise Metrics” webinar on demand. You can also read more about GEM in the docs, and contact us if you’d like to try it out!


