A closer look at the admin API and plugin for centralized tenant administration and control in Grafana Enterprise Logs
To follow up on our introduction of Grafana Enterprise Logs, the latest addition to the Grafana Enterprise Stack, let’s dig into one of the key features: the admin API and admin plugin.
Grafana Loki, Grafana Labs’ log aggregation project, provides the underpinnings of Grafana Enterprise Logs (GEL). Loki supports multiple tenants by allowing clients to provide the tenant ID via a header, which routes the incoming data or incoming query to that tenant’s data and only that tenant’s data. Loki was built in this way to be flexible, which is the same as its sister project Cortex.
As with Loki, Grafana Enterprise Logs is multi-tenanted out of the box, and we have built centralized tenant administration and control directly into the software, allowing you to create tenants (which we call instances in GEL) as well as access policies and tokens that control data ingress and egress to the instances. This is done by accessing the admin API exposed by GEL, a key feature that saves you from needing to build and support these protections and functionality yourself. Many organizations need to restrict or control access to log data, and it’s considered a best practice to use APIs to set this up.
With GEL, an administrator has two options for configuring these resources: Use the admin API directly with whatever system you currently use to provision resources in your organization (e.g., Puppet, Chef, Ansible), or use the provided Grafana Enterprise Logs administration plugin, which offers a GUI-like experience while utilizing the API under the hood.
If you have used the admin API from Grafana Enterprise Metrics, this API will seem very familiar to you. Among other functionality, the Grafana plugin HTTP endpoints create instances (tenants), access policies, and tokens. Here’s a look at how you would create each.
Instances
To create an instance where, for example, you could keep all of Team A’s logs, you can issue a POST request:
POST /admin/api/v1/instances

{
    "name": "team-a",
    "display_name": "Team A",
    "cluster": “enterprise-logs-cluster"
}
Or use the UI to create it:

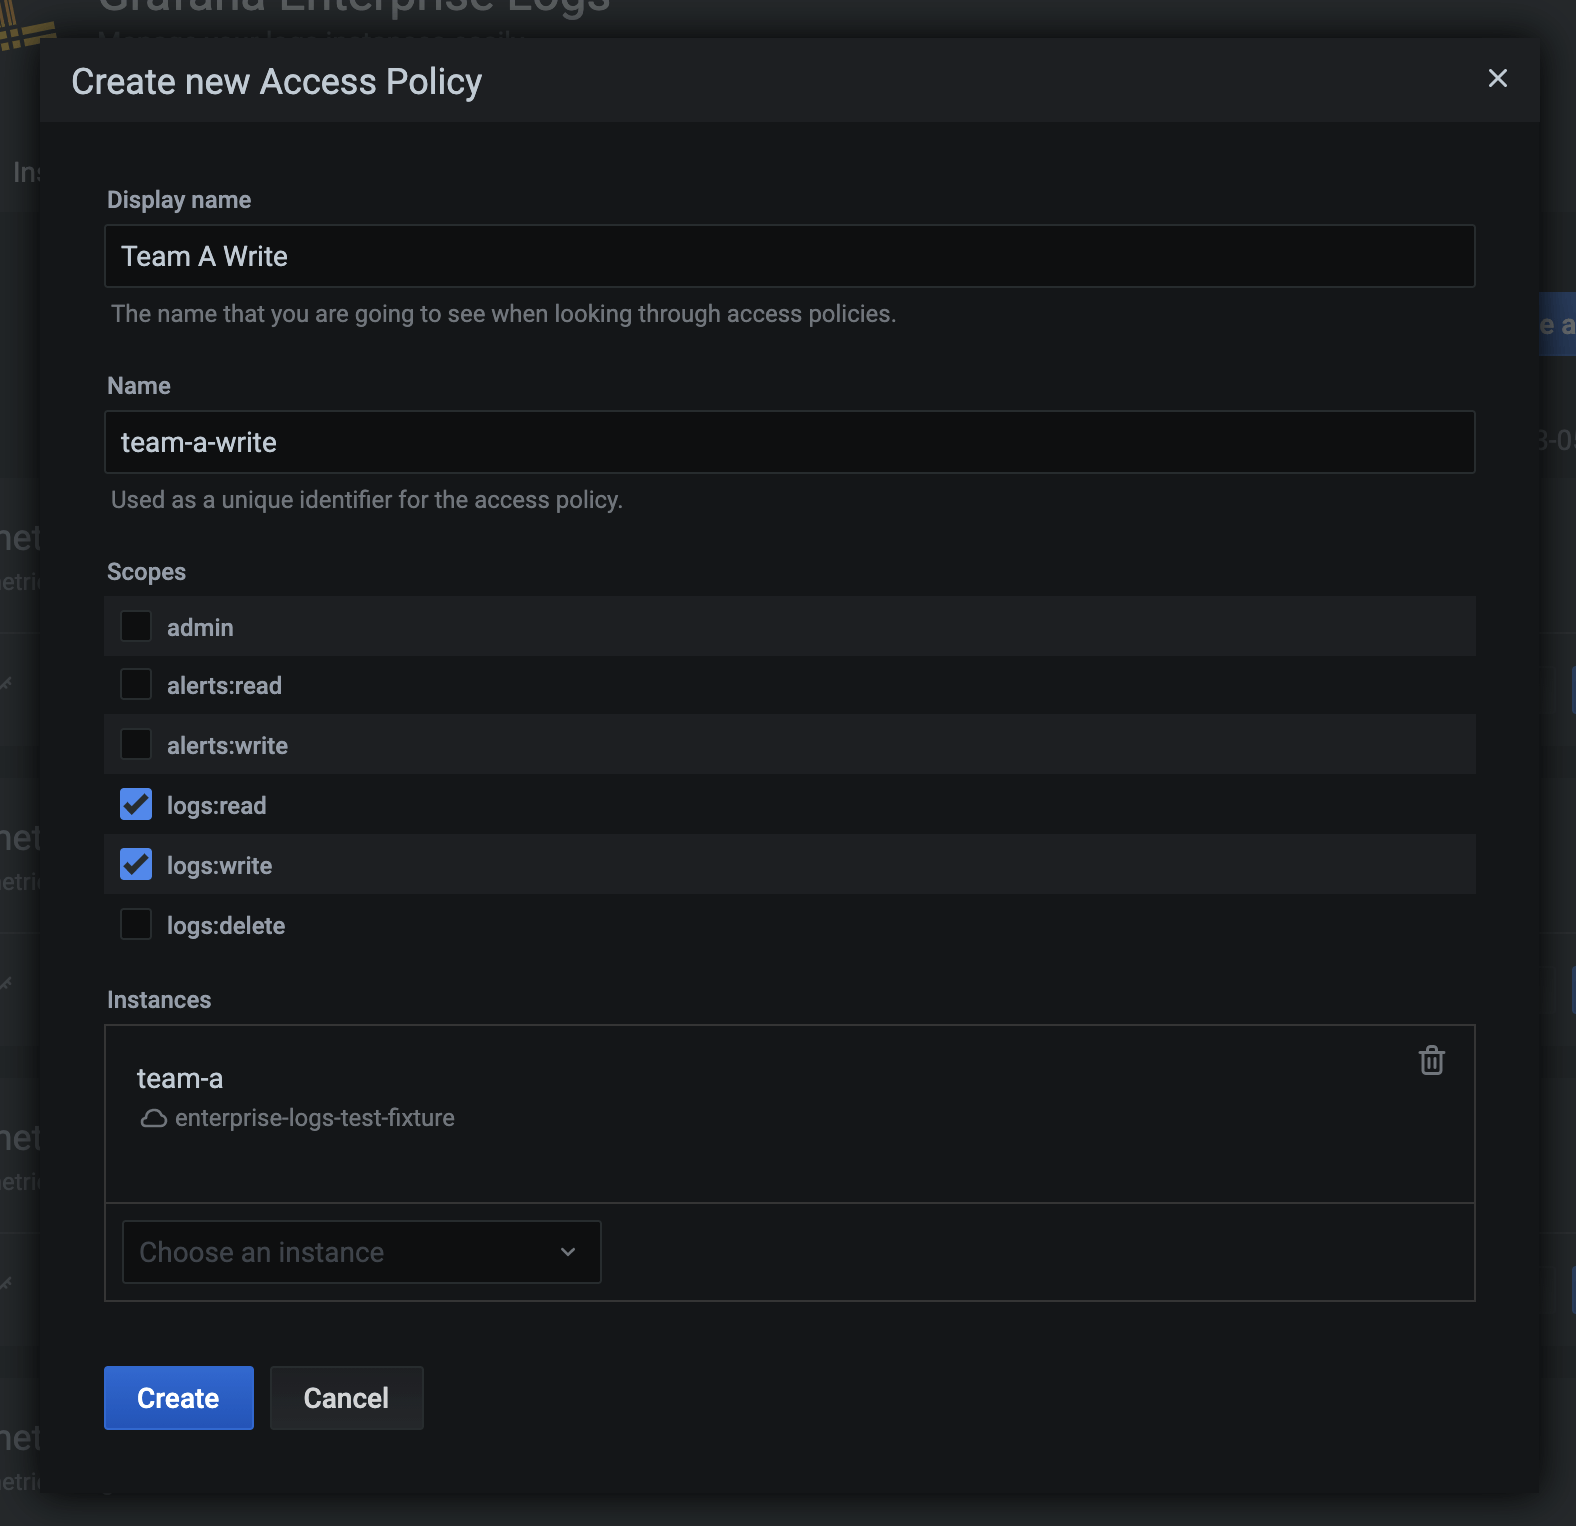
Access policies
Now that you have Team A’s instance, you can create an access policy to get data into and out of your new instance. This access policy will have an optional expiration date of a year in the future, and be able to read and write data because of the configured scopes.
You can use a POST request to create this access policy:
POST /admin/api/v1/accesspolicies

{
    "name": "team-a-read-and-write-ap",
    "display_name": "Team A Read and Write AP",
    "created_at": "2021-03-05T17:37:59.341728283Z",
    "expiration": "2022-03-05T17:37:59.341728283Z",
    "realms": [
        {
            "instance": "team-a",
            "cluster": "enterprise-logs-cluster"
        }
    ],
    "scopes": [
        "logs:read",
        "logs:write"
    ]
}
Or do this easily using the UI again:
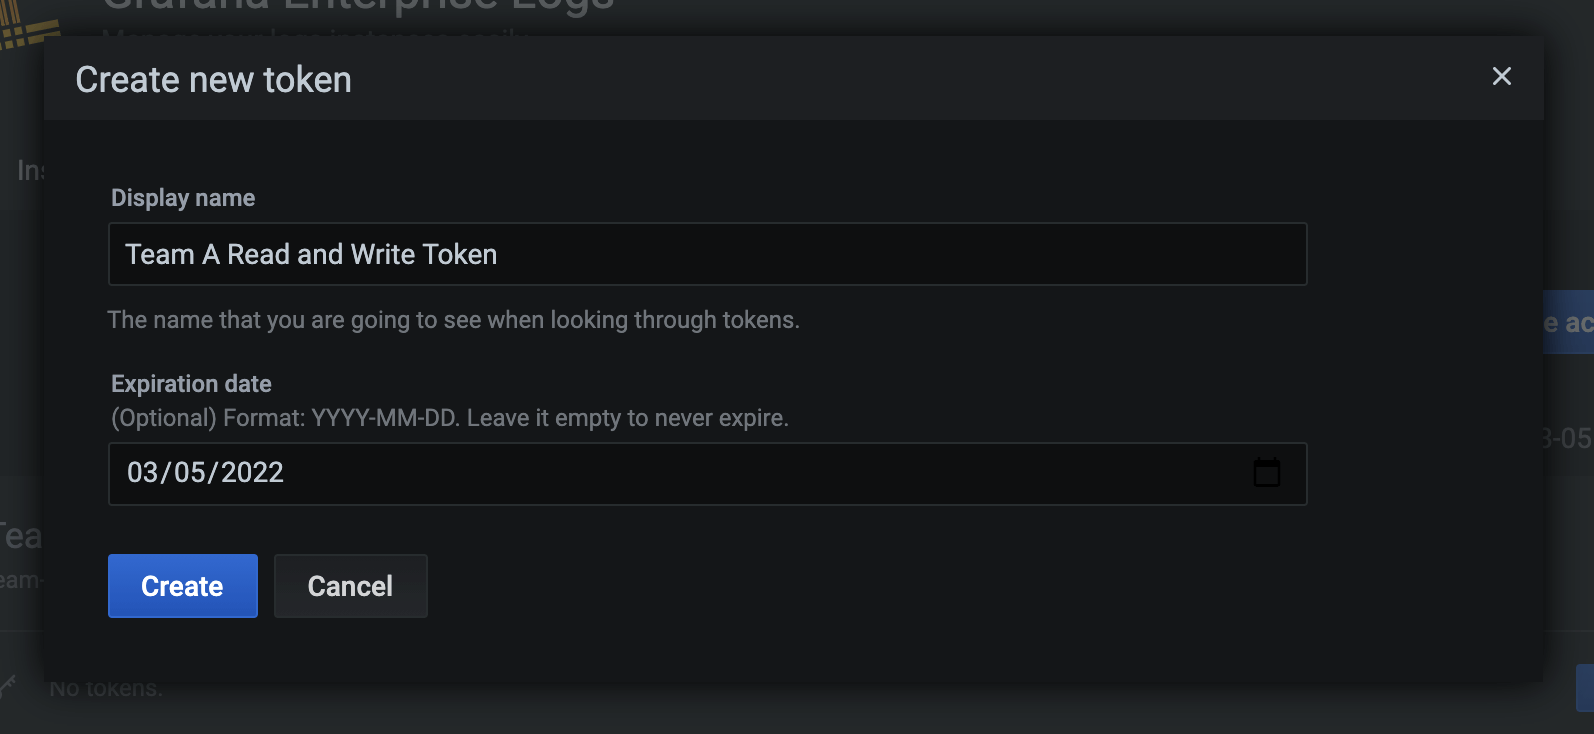
Tokens
Once you have your instance and access policy, you can finally create a token. Use tokens created with this team-a-read-and-write-ap access policy to read data from this instance with Grafana, since it has the logs:read scope. You can also use them to send data into the instance using the Grafana Agent, or promtail, the standalone Loki client, because the associated access policy also has the logs:write scope.
POST /admin/api/v1/tokens
{
"name": "team-a-read-and-write-token",
"display_name": "Team A Read and Write Token",
"created_at": "2021-03-05T17:37:59.341728283Z",
"expiration": "2022-03-05T17:37:59.341728283Z",
"access_policy": "team-a-read-and-write-ap"
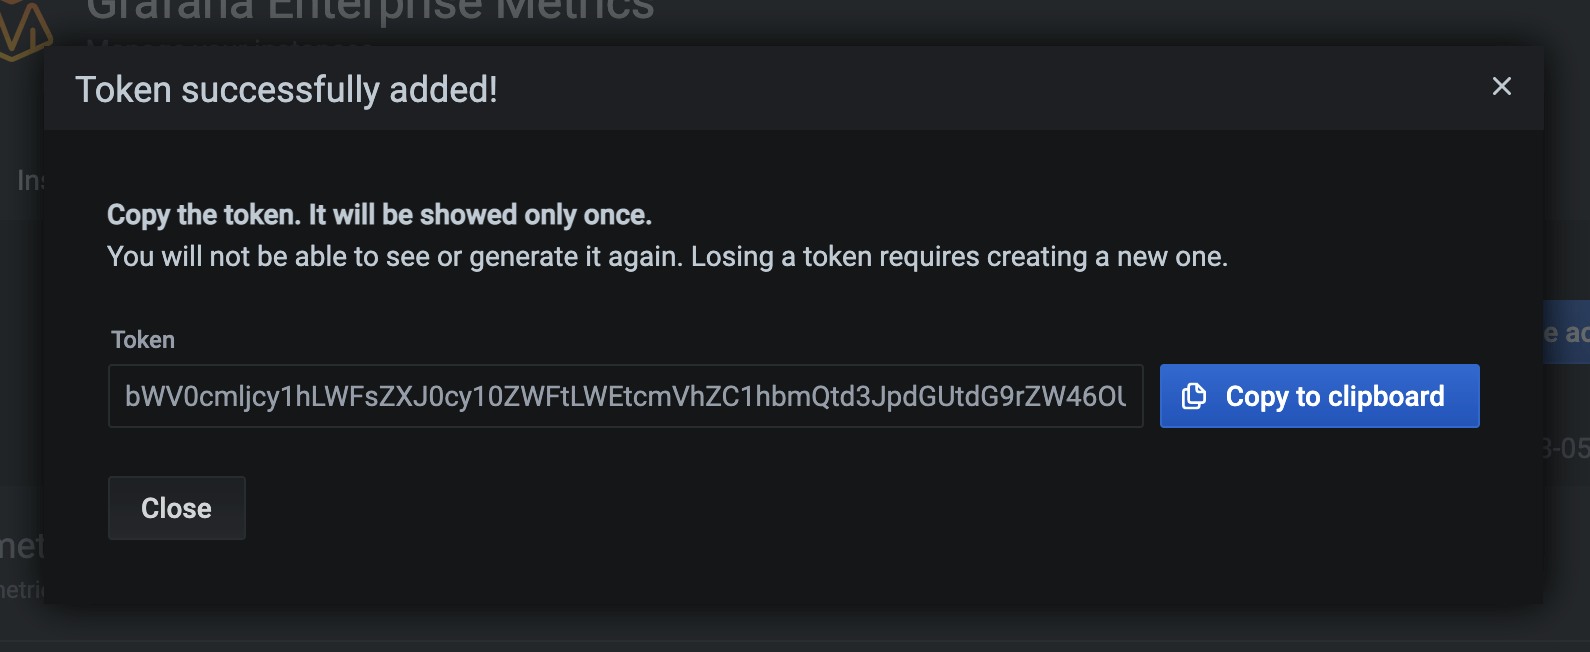
}In response, you’ll receive the same object but with a token appended:
{
    "name": "team-a-read-and-write-ap-another",
    "display_name": "Another",
    "created_at": "2021-03-05T21:25:27.679Z",
    "access_policy": "team-a-read-and-write-ap",
    "expiration": "0001-01-01T00:00:00Z",
    "access_policy": "team-a-read-and-write-ap",
    "token": "dGVhbS1hLXJlYWQtYW5kLXdyaXRlLWFwLWFub3RoZXI6fUoxcSkiNC02NXk1cGB8Ny4rNCwyMDgk"
}
Or do the work using the UI:
Agents
With that token in hand, sending logs to GEL is simple. Run the Grafana Agent with this sample config, swapping out the <token> for the token you created and <cluster-dns-name> for the hostname of the GEL cluster. Note that team-a is the username found within the URL. It’s possible to create an access policy that has access to more than one instance, so it’s necessary to specify which one you want to write to.
loki:
  positions_directory: /tmp/loki-positions
  configs:
    - name: pi
      clients:
        - url: 'http://team-a:<token>@<cluster-dns-name>/api/prom/push'
      scrape_configs:
        - job_name: system
          static_configs:
            - targets:
                - localhost
              labels:
                job: varlogs
                __path__: /var/log/*log
Grafana
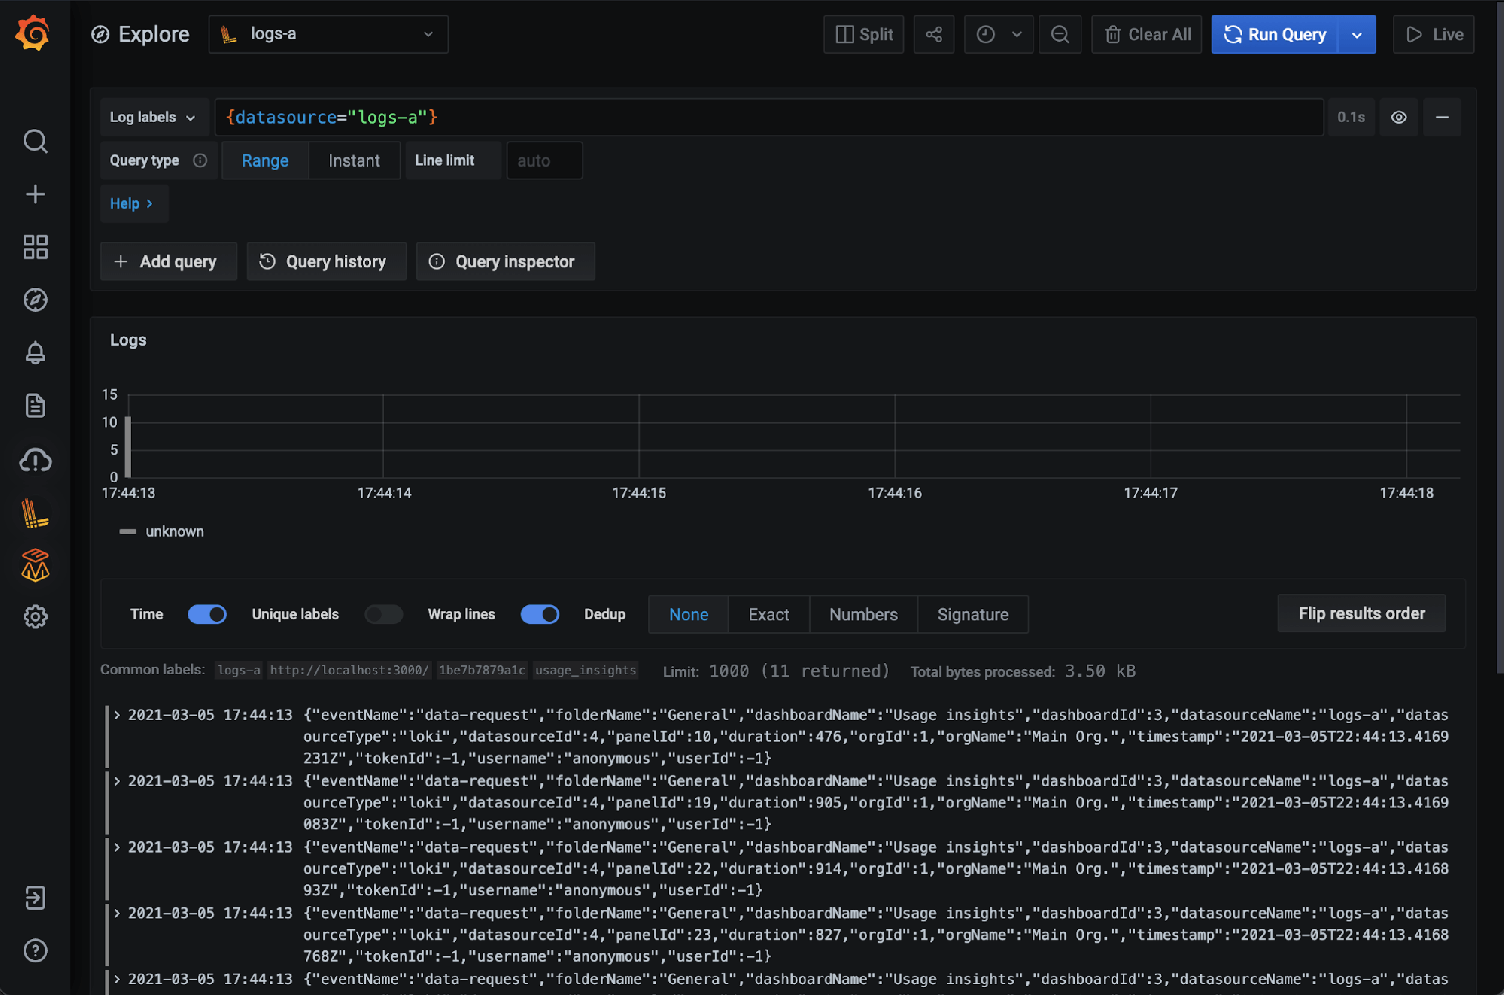
Now that you have logs flowing into your GEL instance, let’s configure Grafana to view them. Create a Loki data source with the URL set to your cluster name as shown below, as well as specifying Basic auth. Note that team-a is the username. Specify the token as the password and save the data source.
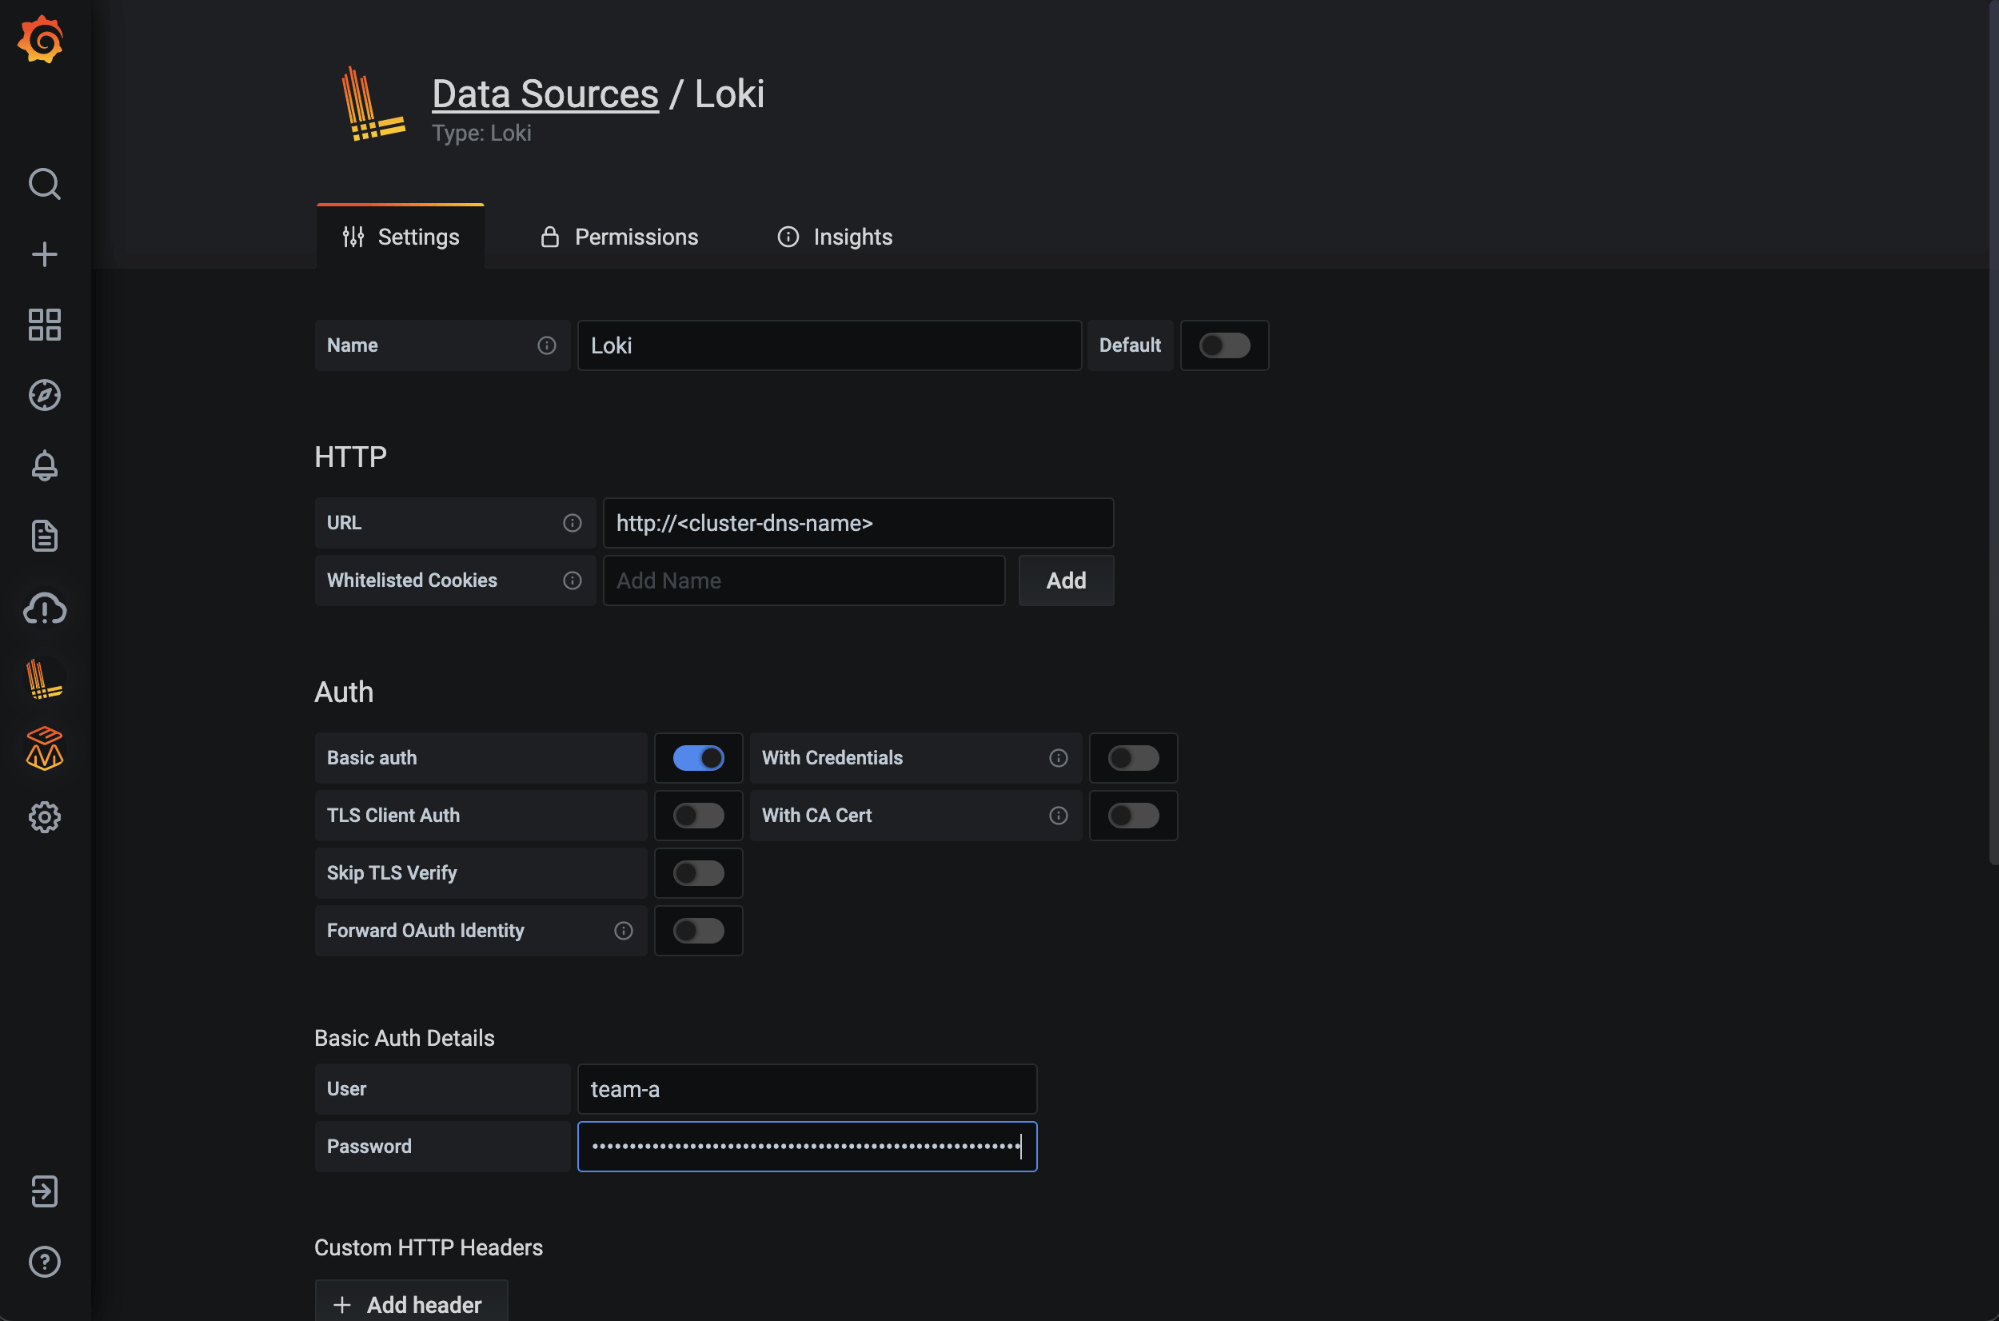
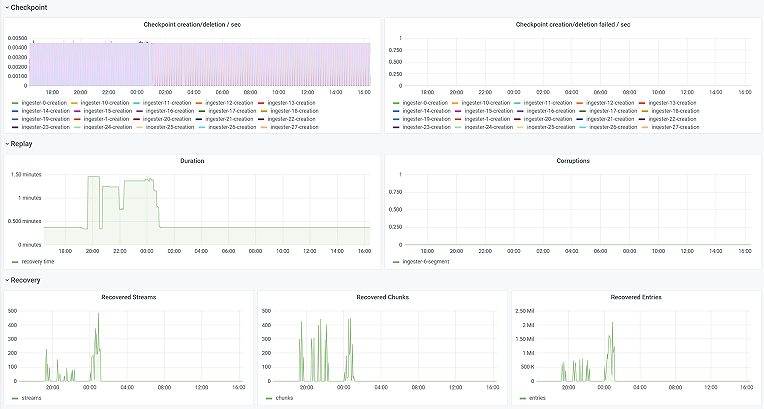
You are now able to query your instance to view and analyze logs:

Find out more
For a deeper dive into Grafana Enterprise Logs, be sure to register for the March 18 webinar, “Grafana Enterprise Logs: Logging with security and scale.” You can also read more about GEL in the docs, and contact us if you’d like to try it out!