Troubleshoot problems using GitLab activity data with the new plugin for Grafana
This post has been updated to reflect changes in the availability of the GitLab data source plugin for Grafana Cloud users.
GitLab is one of the most popular web-based DevOps life-cycle tools in the world, used by millions as a Git-repository manager and for issue tracking, continuous integration, and deployment purposes.
Today, we’re pleased to announce the first beta release of the GitLab data source plugin, which is intended to help users find interesting insights from their GitLab activity data. With this plugin, which is available for users with a Grafana Cloud account or with a Grafana Enterprise license, users can visualize data from GitLab’s API. Here are some examples:
- Track detailed GitLab stats, such as top contributors or commits per day.
- Create annotations based on releases and deployments to see how they relate to other metrics.
- Use template variables, such as projects, to set up filters and parameterize dashboards.
The plugin leverages the GitLab API and the raw data that it returns for each of the available resources, such as commits or issues. That means that we can fetch some data from each of those resources by applying some filters (think commits from last week or issues closed last month). Ultimately, we need to use the available data transformations in Grafana to turn the raw data that is returned by the GitLab API into meaningful insights.
From raw data to meaningful insights
When someone is sitting in front of a new Grafana dashboard thinking about what meaningful insights can be extracted from the GitLab activity, one of the most common ideas that easily comes to mind is: What does my trend of commits per day look like? Even though we could discuss whether or not it is a good metric from the development standpoint, it is definitely a good example to see how we can get that metric by using our new plugin.
Fetching commits
The first step towards our “commits per day” metric is to fetch the raw commits data from the GitLab API. To do it, we need to select our GitLab data source and then select the Commits query on the query editor. Finally, we need to select the project identifier we want to query commits for. In this example, we’re using the GitLab project itself.

Once we have set up our query in the plugin’s query editor, then we can select the Table visualization to see what the commits data looks like:

NOTE: This screenshot is just an example, so it only shows a subset of all the available fields for each commit.
Grouping commits by date
Now that we have the raw commits, it is time to use the Group by transformation:

Transformations were introduced in Grafana 7.0 as a way to manipulate data directly from within Grafana. They are especially useful for the tabular data we get back from data sources like GitLab, GitHub, and ServiceNow.
Once we have selected the Group by transformation, it is time to group by the committed_at_date field and use the Calculate operator to “count” how many commits we have for each group (per day):

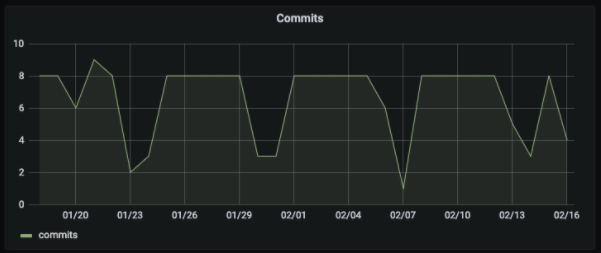
Finally, we can switch back to the Graph visualization to see what is the trend of our “commits per day” metric:

Correlating events and metrics with annotations
Annotations are one of the key Grafana features supported by the GitLab data source plugin. They help us correlate some events (like releases or deployments) to other metrics (like traffic, uptime, or latency) so we can either correlate those events with other metrics from the GitLab data source or with metrics from other data sources like Prometheus. Annotations can help us answer questions like: Did the latest deployment cause that spike in memory usage?
Let’s look at an example of how to create annotations based on releases:

- Under the Annotations section, create a new annotation named
Releasesusing your GitLab plugin as the Data source. - Select the Releases Query Type and introduce the Project Id.
- Select name as Display Field and created_at as Time Field (which defines what fields are used to display the annotations in our panels).
- Finally, click on Update to save the configuration.
From now on, all of our Graph visualizations will display an annotation (the vertical blue line in the screenshot below) for each release:

Template variables
As you can guess from the previous example, having to manually specify the project identifier on our dashboards can be annoying. Besides, using static configurations in a dashboard makes them less reusable. That is precisely the reason why we have added support for template variables. Thanks to that feature, we can parameterize our dashboards. Let’s see an example of how to create a “project” variable:

- Under the Variables section, create a new variable using your GitLab plugin as the Data source.
- Select the Projects query type and mark the Owned field Yes.
- Select name as Display Field and id as Value Field. (This defines what fields are used for the variable’s labels and values.)
- Click on Update to save the new configuration.
From now on, our dashboard will display a new project field at the top; we can either select one of our projects or introduce one manually:

The last step is to use this new variable we have created in our queries. To do so, we only need to update our queries to replace our static Project Id with the new variable ($project).

Current caveats and future plans
API rate limits
The GitLab API rate limits default to 2,000 requests per minute per user. Even though that may seem high enough, queries for vast amounts of data (e.g., “give me all the commits from the last two years”) will likely be problematic.
The GitLab API only supports up to 100 results per page, so a query with a large number of results will end up getting broken up into many queries, making it easier to hit the rate limits. Additionally, the large amount of information that has to be fetched and returned will make the query slow to load.
Alerting
Alerting is another key feature of Grafana, but since the GitLab API provides little meaningful time series data, it’s not currently possible to set up alerts for GitLab data source queries.
Aggregations
As stated above, we rely on Grafana transformations to perform data aggregations. To enable a common use case with the GitLab plugin, we added the created_at_date field used in the example above with the Group by transformation. However, it would be useful to be able to aggregate data at a greater or lower time unit (per hour, per week, per month, etc.), too, so we are currently developing new transformations to make that (and other aggregations) possible!
More query types and filters
This beta release of the GitLab data source plugin supports only a subset of the available GitLab API resources as well as a subset of the resources’ available filters. We plan to introduce more query types and filters.
Cache
Some data source plugins have a cache mechanism to reduce the likelihood of reaching the API rate limits and to solve some performance issues. The GitLab plugin does not currently have a cache mechanism, but it’s one of our main short-term goals to add one.
Conclusion
With the GitLab data source plugin, we’ve shown that it’s possible to quickly get some raw data from the GitLab API and easily transform it to extract some meaningful insights. That way we can either troubleshoot problems directly from our GitLab activity (e.g., blocked issues) or diagnose related problems by correlating the GitLab events with metrics from other data sources.
To learn more, go to the GitLab solutions page. The GitLab data source plugin is available for users with a Grafana Cloud account or with a Grafana Enterprise license. Contact us if you’d like to try it out!
Thanks to my colleagues Tania Batieva and Andrew Hackman for their work on the plugin, and to Mitch Seaman, Julie Dam, and Ursula Kallio for their help with this blog post.
If you’re not already using Grafana Cloud — the easiest way to get started with observability — sign up now for a free 14-day trial of Grafana Cloud Pro, with unlimited metrics, logs, traces, and users, long-term retention, and access to Enterprise plugins.