Introducing Grafana Enterprise Logs, a core part of the Grafana Enterprise Stack integrated observability solution
Today, we are launching a new Grafana Labs product, Grafana Enterprise Logs. Powered by the Grafana Loki open source project for cloud native log aggregation, and built by the maintainers of the project, this offering is an exciting addition to our growing self-managed observability stack tailored for enterprises.
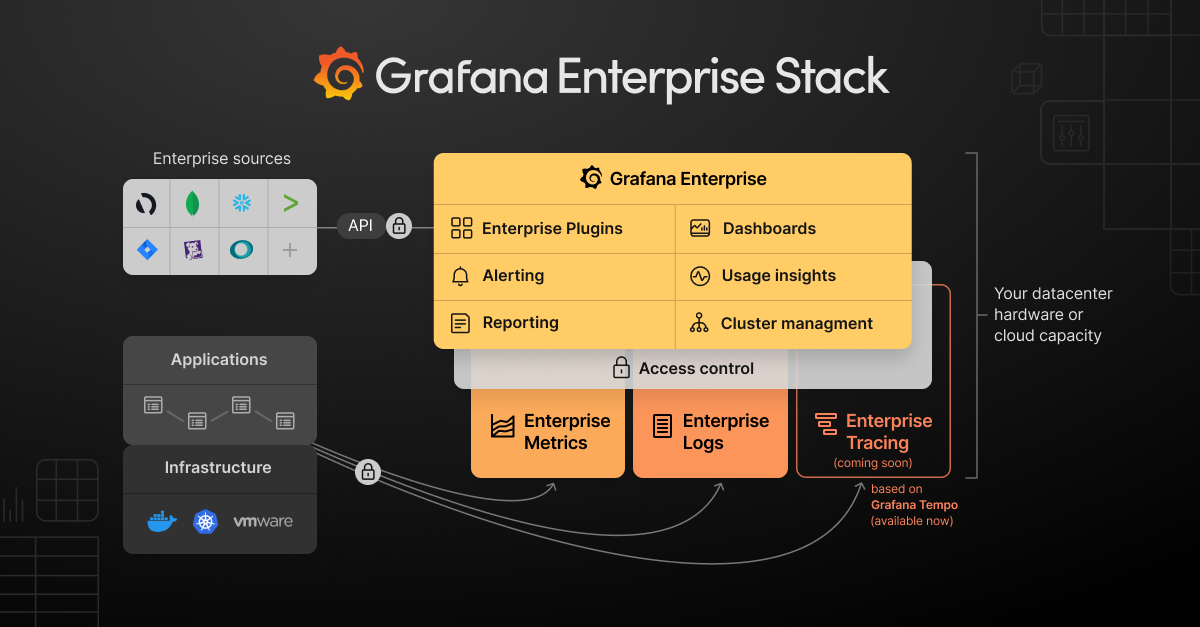
Our integrated Grafana Enterprise Stack now comprises:
- Grafana Enterprise, an enhanced version of Grafana that includes enterprise features, support, and plugins for data sources for other commercial tools such as Splunk, New Relic, MongoDB, ServiceNow, Oracle, and Snowflake.
- Grafana Enterprise Metrics, an infinitely scalable Prometheus-compatible metrics system designed for large organizations that is simple to use and maintain.
- Grafana Enterprise Logs.
Note: We also provide a fully hosted and managed stack in Grafana Cloud, which has a free tier including 10K series for Prometheus metrics and 50GB of logs.
Logs are one of the key pillars of the modern observability stack. The move to cloud native and microservice-based architectures has led to an explosion in the volume of logs. And as valuable as logs are, we often hear from enterprise customers that other logging solutions become prohibitively expensive as businesses scale, and don’t natively integrate with metrics.
The open source Loki project, which has skyrocketed in popularity since we launched it in 2018, solves these problems. Loki only indexes the metadata surrounding the logs, not the lines themselves, making it a fast, cost-effective, and highly scalable solution. By using the same service discovery as Prometheus, Loki can guarantee your logs have consistent labels with your metrics — which allows you to seamlessly switch between metrics and logs, preserving context and saving time. Loki stores everything in commodity object storage, keeping dependencies minimal and simplifying operations.
But enterprises often need additional features, including access controls, indemnification, and support guarantees, in order to push broader adoption. Many companies can’t store logs in the cloud and need an on-prem solution.
And that’s where Grafana Enterprise Logs comes in.
Introducing Grafana Enterprise Logs
Grafana Enterprise Logs is built on a unique approach to log indexing, storage, and administration control that allows companies to run it securely at scale. Everyone in an organization can access all of their relevant log data, and companies that have specific security policies or are in regulated industries can leverage the built-in Grafana interface to easily manage permissions and settings and grant individuals access to the resources they need without compromising cost.
Logs available to everyone who needs them
To control costs, companies often need to impose strict quotas on logs. Grafana Enterprise Logs makes it cost-effective to keep lots of log data around for future reference, and at the same time is able to absorb large spikes in ingestion.
Enterprises that are required to limit access to confidential information have to enforce policies prohibiting developers from getting access to certain logs. Grafana Enterprise Logs is secure by default and has both a scriptable REST API and a built-in Grafana interface to make it easy for admins to manage instances, access policies, and token generation. These features, combined with Grafana Enterprise data source permissions, ensure that users and groups are set to view only the logs they should have access to. In addition, GEL can integrate directly with an existing OIDC authentication provider to keep your authentication in one place.
Composable logging
Grafana Enterprise Logs works alongside your technologies, which means that if you already have existing logging tools, it’s not necessary to rip them out or replace them.
Likewise, it’s simple to use, so there’s no need to feel bound to hiring only from other large organizations or fear incoming engineers won’t have experience with your chosen tooling. Loki’s LogQL is also syntactically similar to Prometheus’s PromQL, which means that teams familiar with Prometheus don’t have to learn a whole new query language.
Correlation between metrics and logs
Traditional solutions were created before the rise of Prometheus as the de facto open source metrics monitoring solution for cloud native and Kubernetes. As the Prometheus query language and data model are very different from, for example, the Elasticsearch or Splunk query languages, this makes correlating metrics and logs harder.
Understanding all relevant data — and the relationships between them — is important. Grafana Enterprise Logs provides integrations to the Prometheus label model, which allows for effortless switching between metrics and logs and makes it a great fit with Kubernetes, Prometheus, and visualization within Grafana.
Support
With Grafana Enterprise Logs, teams get support, training, and consulting provided by the Grafana Labs team, including the creators and maintainers of Loki. We’ll help with anything organizations need to implement Loki and Grafana Enterprise Logs.
Commitment to open source
Grafana Enterprise Logs is 100% compatible with the feature set that open source Loki already provides. It builds on what is available in Loki, adding features tailored specifically for enterprises that complement, and in no way detract from, the open source project. The Grafana Labs team is committed to improving and adding new features to upstream Loki, and will continue to lead development of the open source project.
Learn more about Grafana Enterprise Logs
We will take a deeper dive into Grafana Enterprise Logs during a one-hour webinar on March 18. Register now for “Grafana Enterprise Logs: Logging with security and scale.”
You can also read more about Grafana Enterprise Logs in the docs, and contact us if you’d like to try it out!