Instrumenting a .NET web API using OpenTelemetry, Tempo, and Grafana Cloud
OpenTelemetry is a CNCF project that standardizes observability (logs, metrics, and traces) across many languages and tools.
Today we will look at how we can use the OpenTelemetry .NET library to instrument a .NET 5.0 web API, to offload traces to Tempo and logs to Loki in Grafana Cloud. Grafana Cloud now has a free plan. Set up your account and follow along!
Getting started
First let’s create a web API project using the built-in templates with the dotnet command. If you have an existing project, that is no problem. The code examples and libraries used here are compatible with both .NET 3.1 and 5.0.
mkdir app
cd app
dotnet new webapi
This creates a subfolder app with the .NET project inside. Run the application and verify that the Swagger UI is available at http://localhost:5000/swagger. The template includes one API, which is GET /WeatherForecast. This is the API that we will be working with.
Tracing
Now that we have the web API, let’s start tracing HTTP requests with the OpenTelemetry nuget packages. These versions are the latest at the time of this writing.
    <PackageReference Include="OpenTelemetry.Extensions.Hosting" Version="1.0.0-rc1.1" />
    <PackageReference Include="OpenTelemetry.Instrumentation.AspNetCore" Version="1.0.0-rc1.1" />
    <PackageReference Include="OpenTelemetry.Exporter.Console" Version="1.0.0-rc1.1" />
Next, configure OpenTelemetry in Startup.cs:
using OpenTelemetry;
using OpenTelemetry.Resources;
using OpenTelemetry.Trace;

…

public void ConfigureServices(IServiceCollection services)
{
    services.AddOpenTelemetryTracing(
        (builder) => builder
                   .SetResourceBuilder(
              ResourceBuilder.CreateDefault().AddService("example-app"))
                    .AddAspNetCoreInstrumentation()
                    .AddConsoleExporter());
    ...
}
This snippet is doing three tasks:
- Enables tracing for basic AspNet activity, including all incoming http requests.
- Sets the service name to “example-app,” which is how this service will be identified in the traces.
- Adds a console exporter, which will log traces to stdout.
Now call the /WeatherForecast API and look for the following in the console. The instrumentation library will create a trace for each HTTP request and print it:
Activity.Id:          00-024a2e1780a54e4baeae297523e1da85-4c65904b34efe14e-01
Activity.DisplayName: WeatherForecast
Activity.Kind:        Server
Activity.StartTime:   2021-01-22T14:08:20.3891870Z
Activity.Duration:    00:00:00.0609742
Activity.TagObjects:
    http.host: localhost:5000
    http.method: GET
    http.path: /WeatherForecast
    http.url: http://localhost:5000/WeatherForecast
    http.user_agent: Mozilla/5.0 (Macintosh; Intel Mac OS X 10_15_7) AppleWebKit/605.1.15 (KHTML, like Gecko) Version/14.0 Safari/605.1.15
    http.route: WeatherForecast
    http.status_code: 200
    otel.status_code: 0
Resource associated with Activity:
    telemetry.sdk.name: opentelemetry
    telemetry.sdk.language: dotnet
    telemetry.sdk.version: 1.0.0.1
    service.name: example-app
    service.instance.id: 1efffa65-727f-4bd7-825c-03bb55c0e90b
Sending traces to Grafana Cloud
Printing trace data to stdout was good exercise, but now let’s upload the traces to Grafana Cloud and view them in Tempo!
This is done by running the Grafana Agent locally and reconfiguring the application to send the traces to it. To keep things reliable for everyone, this walkthrough will run everything with docker-compose, including the .NET project created above.
Create a docker-compose.yaml in the parent folder of /app with the following content. This will build and run the .NET project out of the /app folder and host it on the same http://localhost:5000.
version: "3"
services:

 app:
   image: mcr.microsoft.com/dotnet/sdk:5.0
   command: bash -c "dotnet restore && dotnet build && dotnet run  --urls http://+:5000"
   working_dir: /app
   volumes:
     - ./app:/app
   ports:
     - "5000:5000"

 grafana-agent:
   image: grafana/agent:latest
   command: "-config.file=/etc/agent-config.yaml"
   volumes:
     - ./agent-config.yaml:/etc/agent-config.yaml
Next, create the agent-config.yaml, which is the configuration file for the Grafana Agent (which is volume mounted above). This enables the OpenTelemetryProtocol (OTLP) gRPC listener. Credentials will be filled in next.
tempo:
  configs:
  - name: default
    push_config:
      endpoint: tempo-us-central1.grafana.net:443
      basic_auth:
        username: <Your Grafana.com Tempo username>
        password: <Your Grafana.com API key>

    receivers:
      otlp:
        protocols:
          grpc:
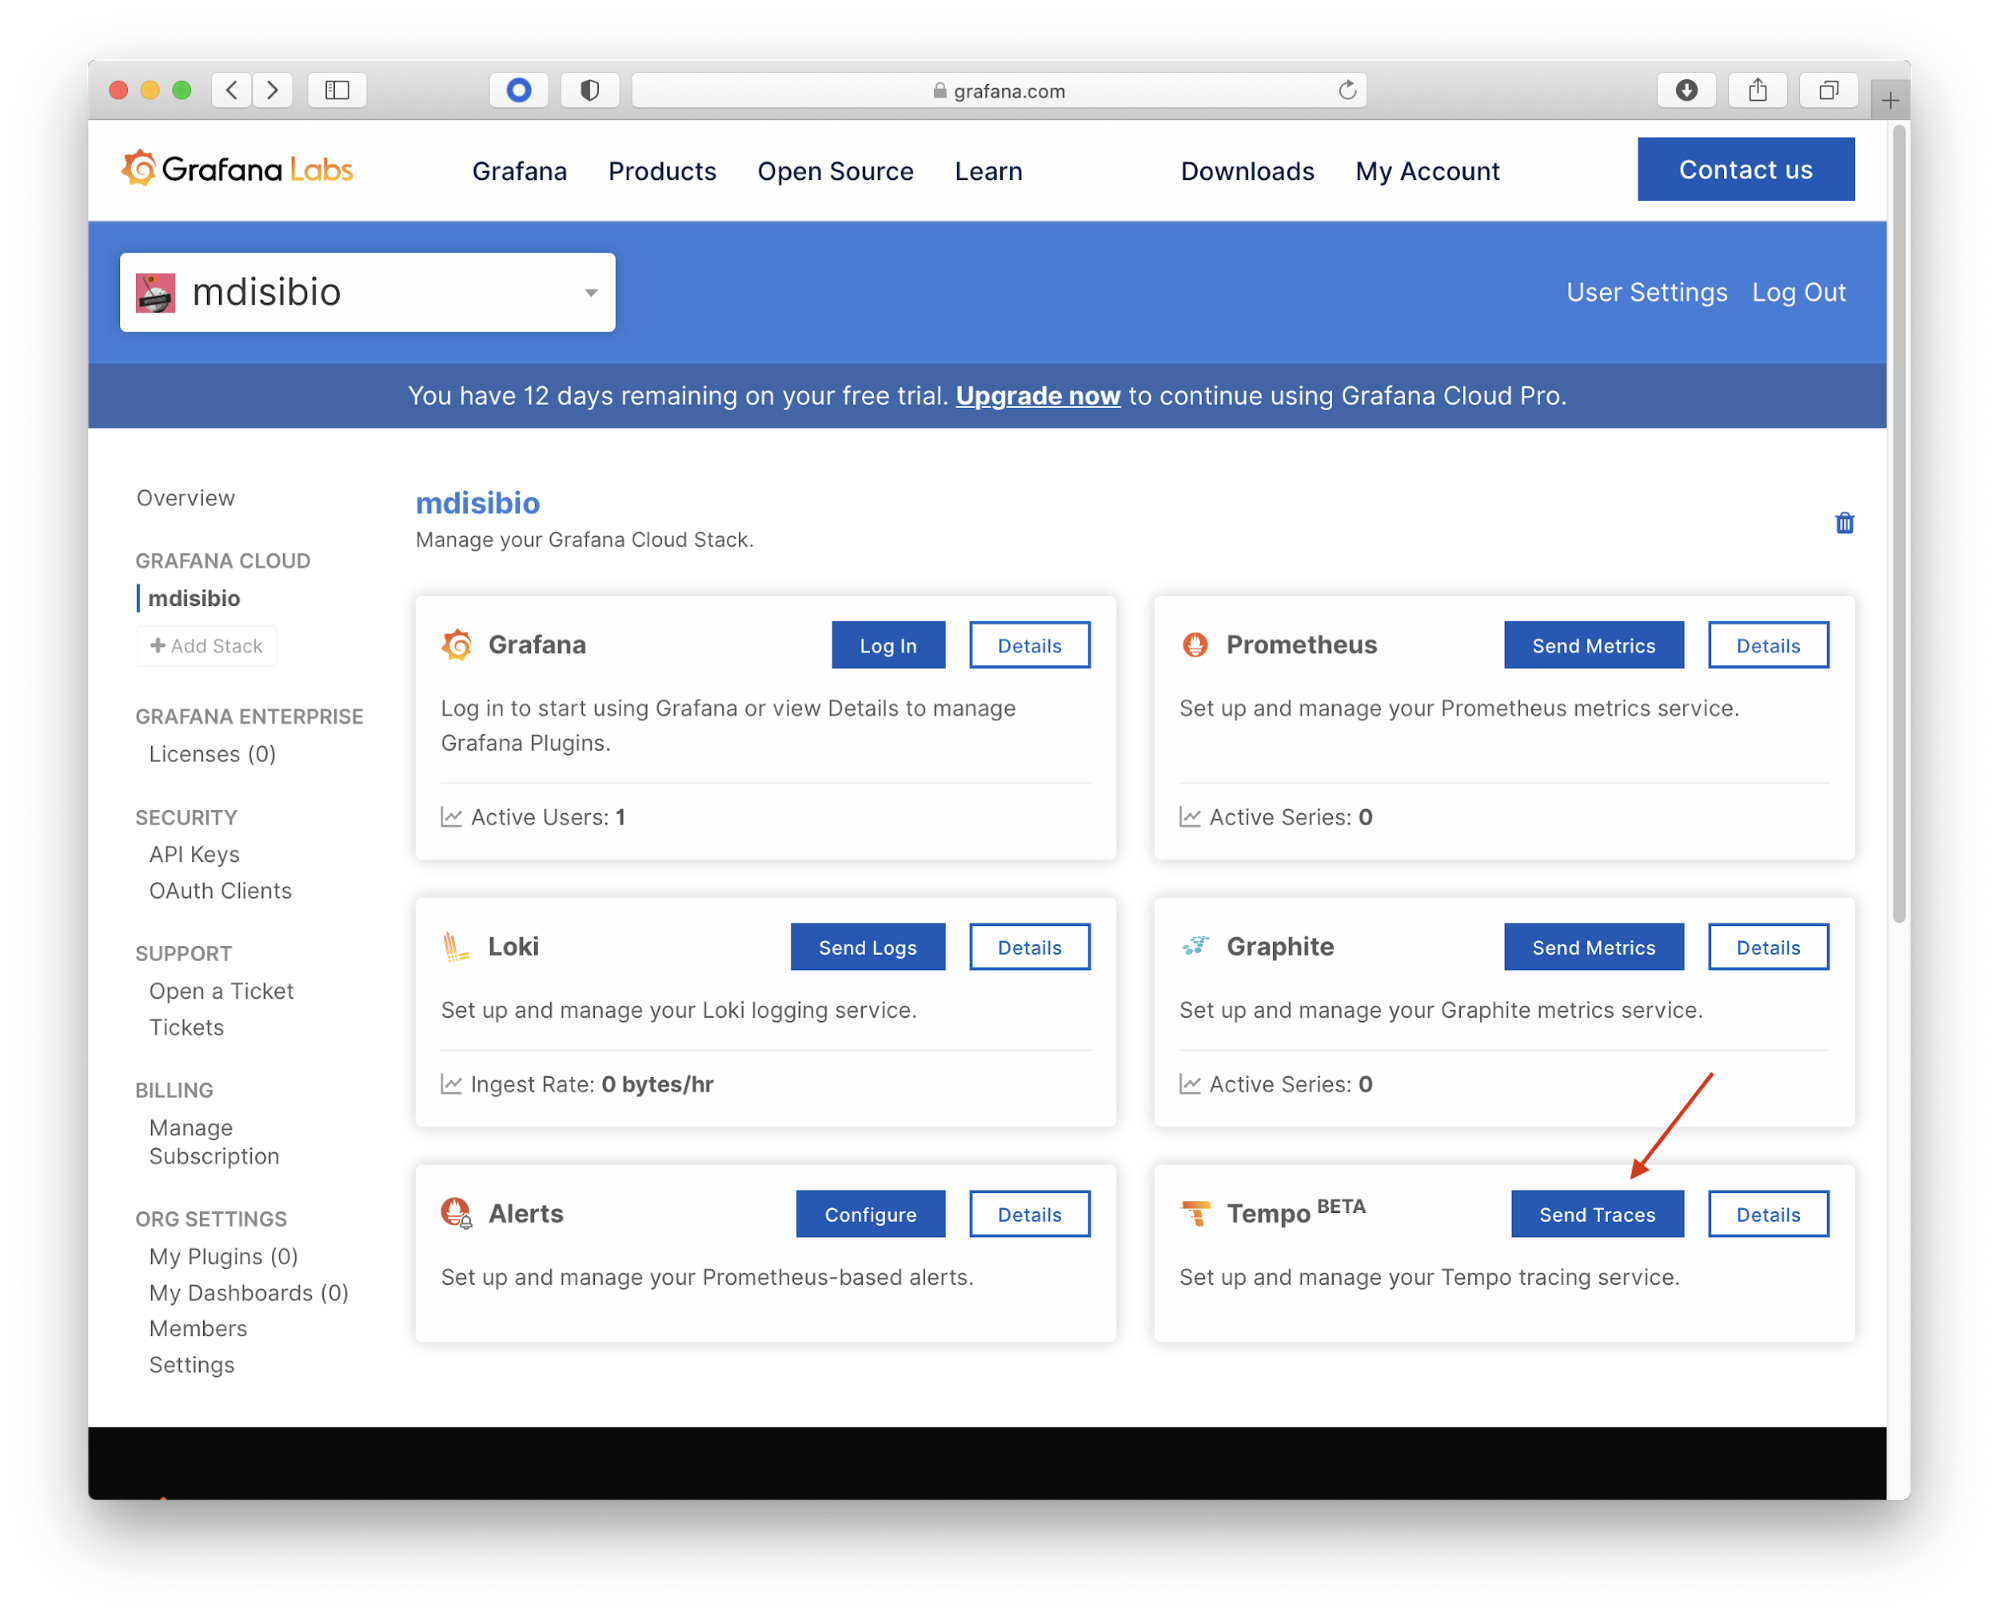
Your Grafana Cloud credentials for Tempo can be found under the My Account page. Choose the stack, then Send Traces to view your username. API Keys are managed under the Security -> API Keys section. Add these values to the agent-config.yaml.
Finally, let’s update the application to export traces to the Grafana Agent in OTLP.
- Add the following two packages to the project. The Grpc.Core reference is manually set here in order to make sure we include a recent fix for .NET 5.0:
    <PackageReference Include="OpenTelemetry.Exporter.OpenTelemetryProtocol" Version="1.0.0-rc1.1" />
<PackageReference Include="Grpc.Core" Version="2.34.0" />- In Startup.cs, add the new exporter and direct it to the Grafana Agent:
            services.AddOpenTelemetryTracing(
                (builder) => builder
                    .SetResourceBuilder(
                          ResourceBuilder.CreateDefault().AddService("example-app"))
                    .AddAspNetCoreInstrumentation()
                    .AddConsoleExporter()
                    .AddOtlpExporter(opt =>
                    {
                        opt.Endpoint = "grafana-agent:55680";
                    }));
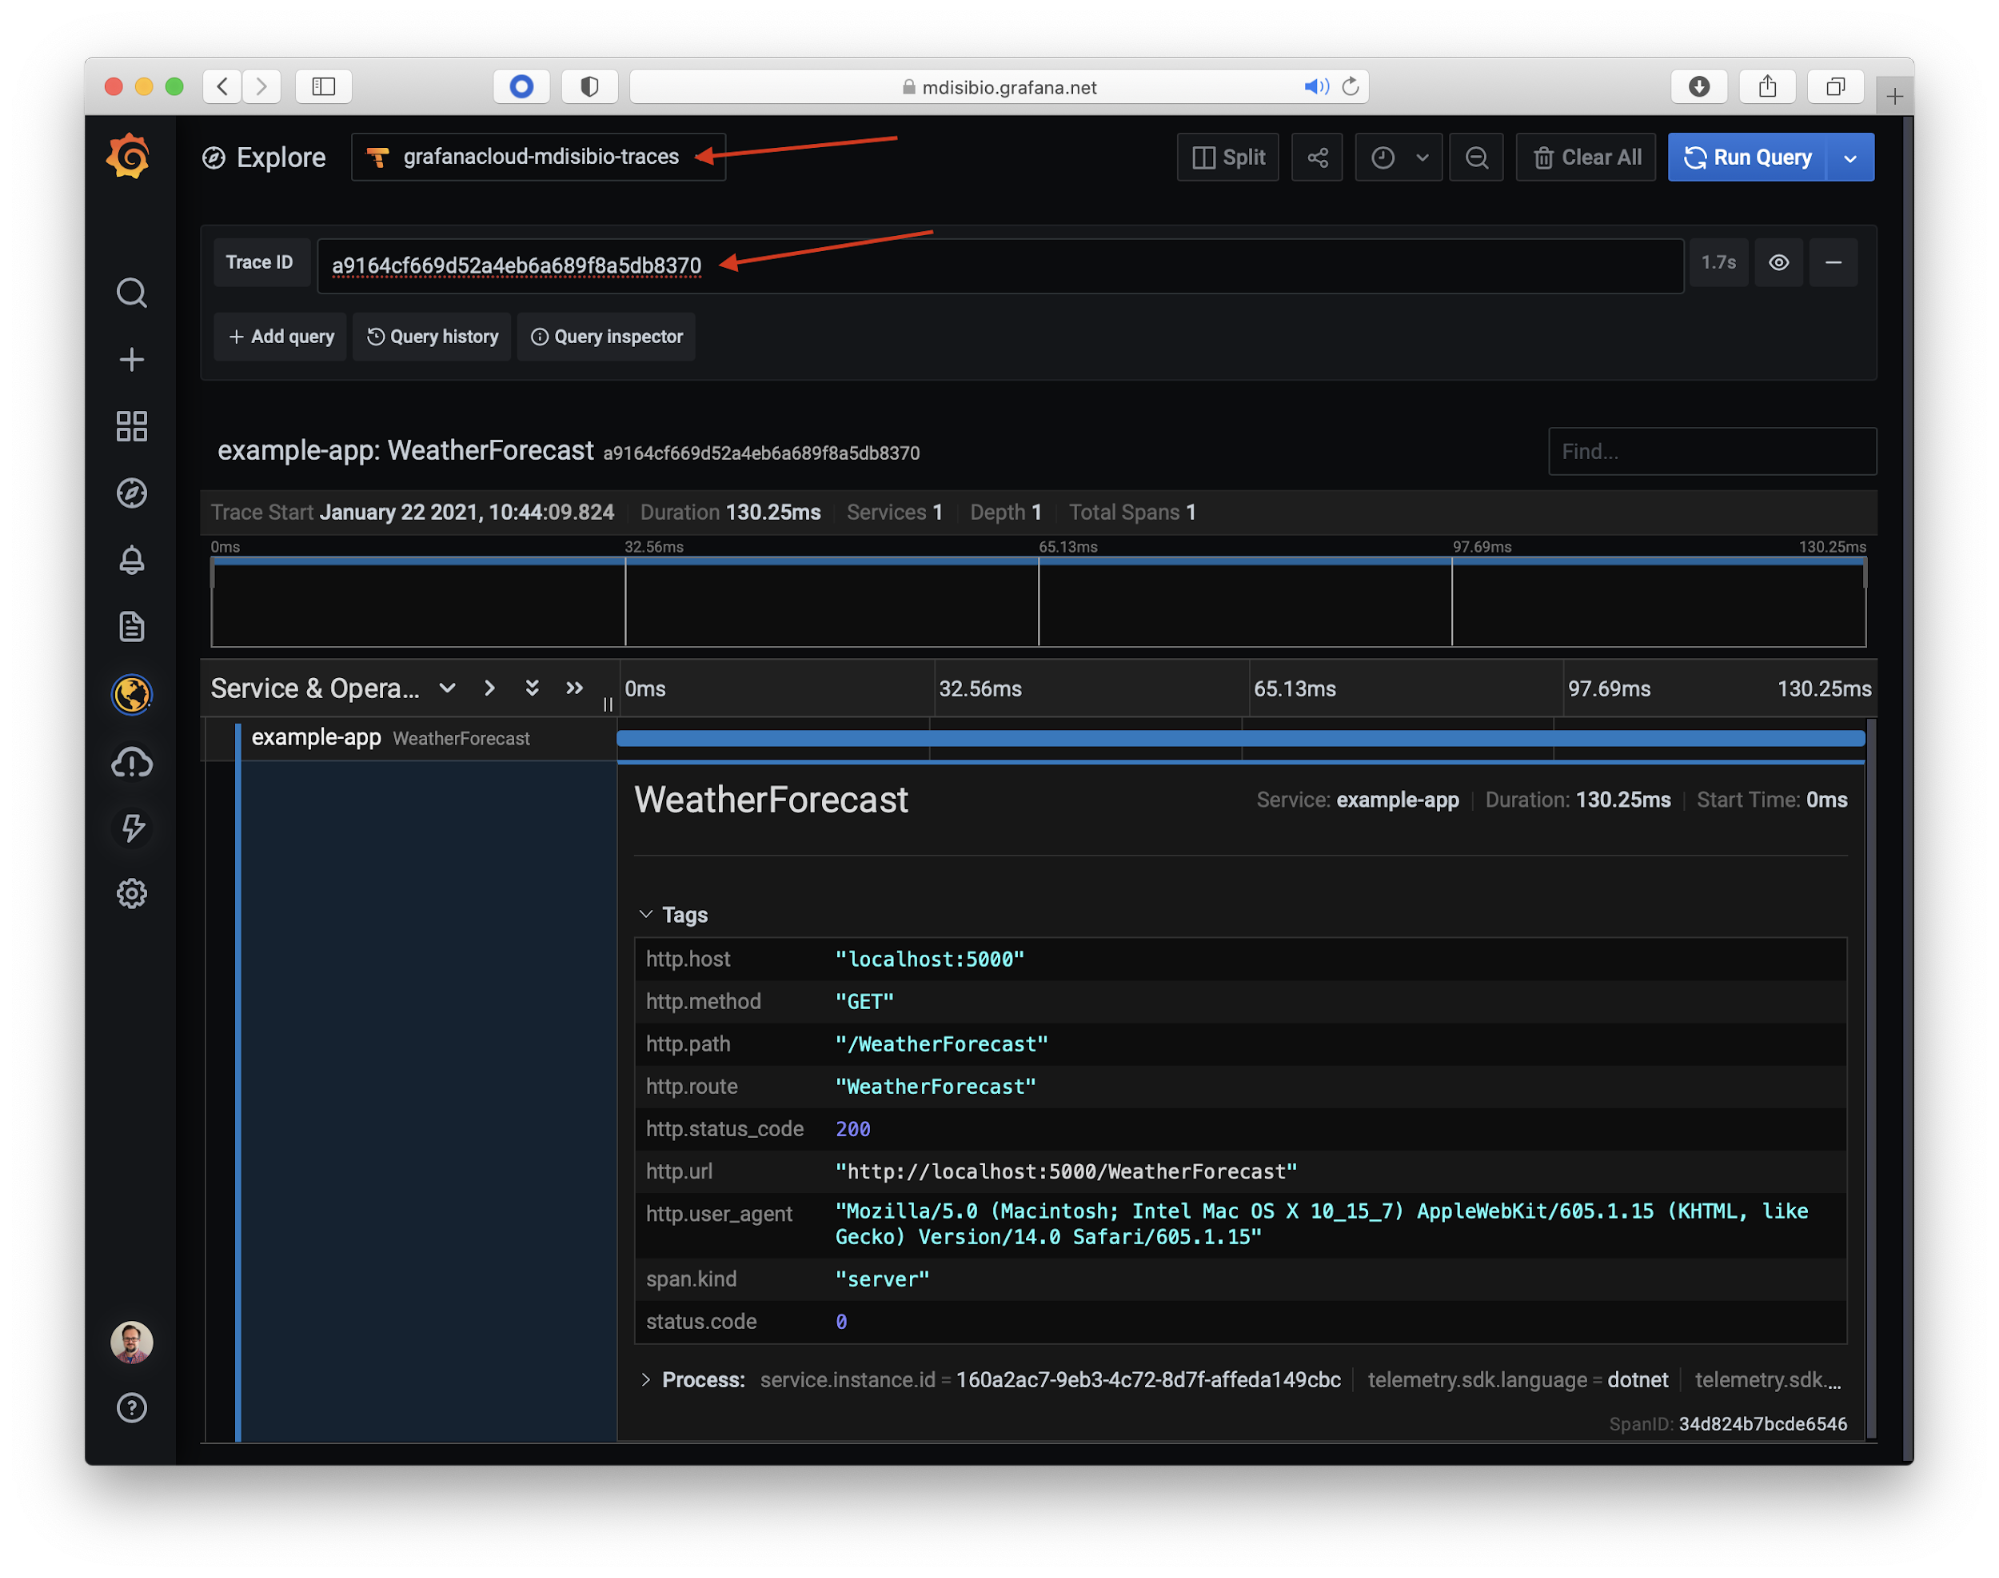
Run everything with docker-compose up and call the /WeatherForecast API again. Since we still have the console exporter, we can use the output to get the trace ID and view it in Grafana Cloud.
Look for the Activity.Id. The second segment is the trace ID.
app_1            | Activity.Id:          00-a9164cf669d52a4eb6a689f8a5db8370-34d824b7bcde6546-01
app_1            | Activity.DisplayName: WeatherForecast
app_1            | Activity.Kind:        Server
app_1            | Activity.StartTime:   2021-01-22T15:44:09.8240910Z
app_1            | Activity.Duration:    00:00:00.1302539
Log into your Grafana Cloud Stack (
Sending logs to Grafana Cloud
Next let’s send our application logs to Grafana Cloud using the Loki log driver and update our application’s log output to let us quickly hop from logs to traces.
Note: The Loki driver is very useful for local Docker workloads and certain architectures. However, for a production workload in Kubernetes, it is recommended to use Promtail.
Install the log driver by running:
docker plugin install grafana/loki-docker-driver:latest --alias loki --grant-all-permissionsUpdate the docker-compose.yaml file to use the Loki driver, and add your Loki username, API key, and URL from Grafana Cloud. Your Loki username and URL are viewed similarly to Tempo by going to My Account, choosing the stack, and then clicking Send Logs (see screenshot above).
app:
   image: mcr.microsoft.com/dotnet/sdk:5.0
   command: bash -c "dotnet restore && dotnet build && dotnet run  --urls http://+:5000"
   working_dir: /app
   volumes:
     - ./app:/app
   ports:
     - "5000:5000"
   logging:
         driver: loki
         options:
           loki-url: https://<username>:<api-key>@logs-prod-us-central1.grafana.net/api/prom/push
Now we can view logs for our application in Grafana Cloud at
{compose_service="app"}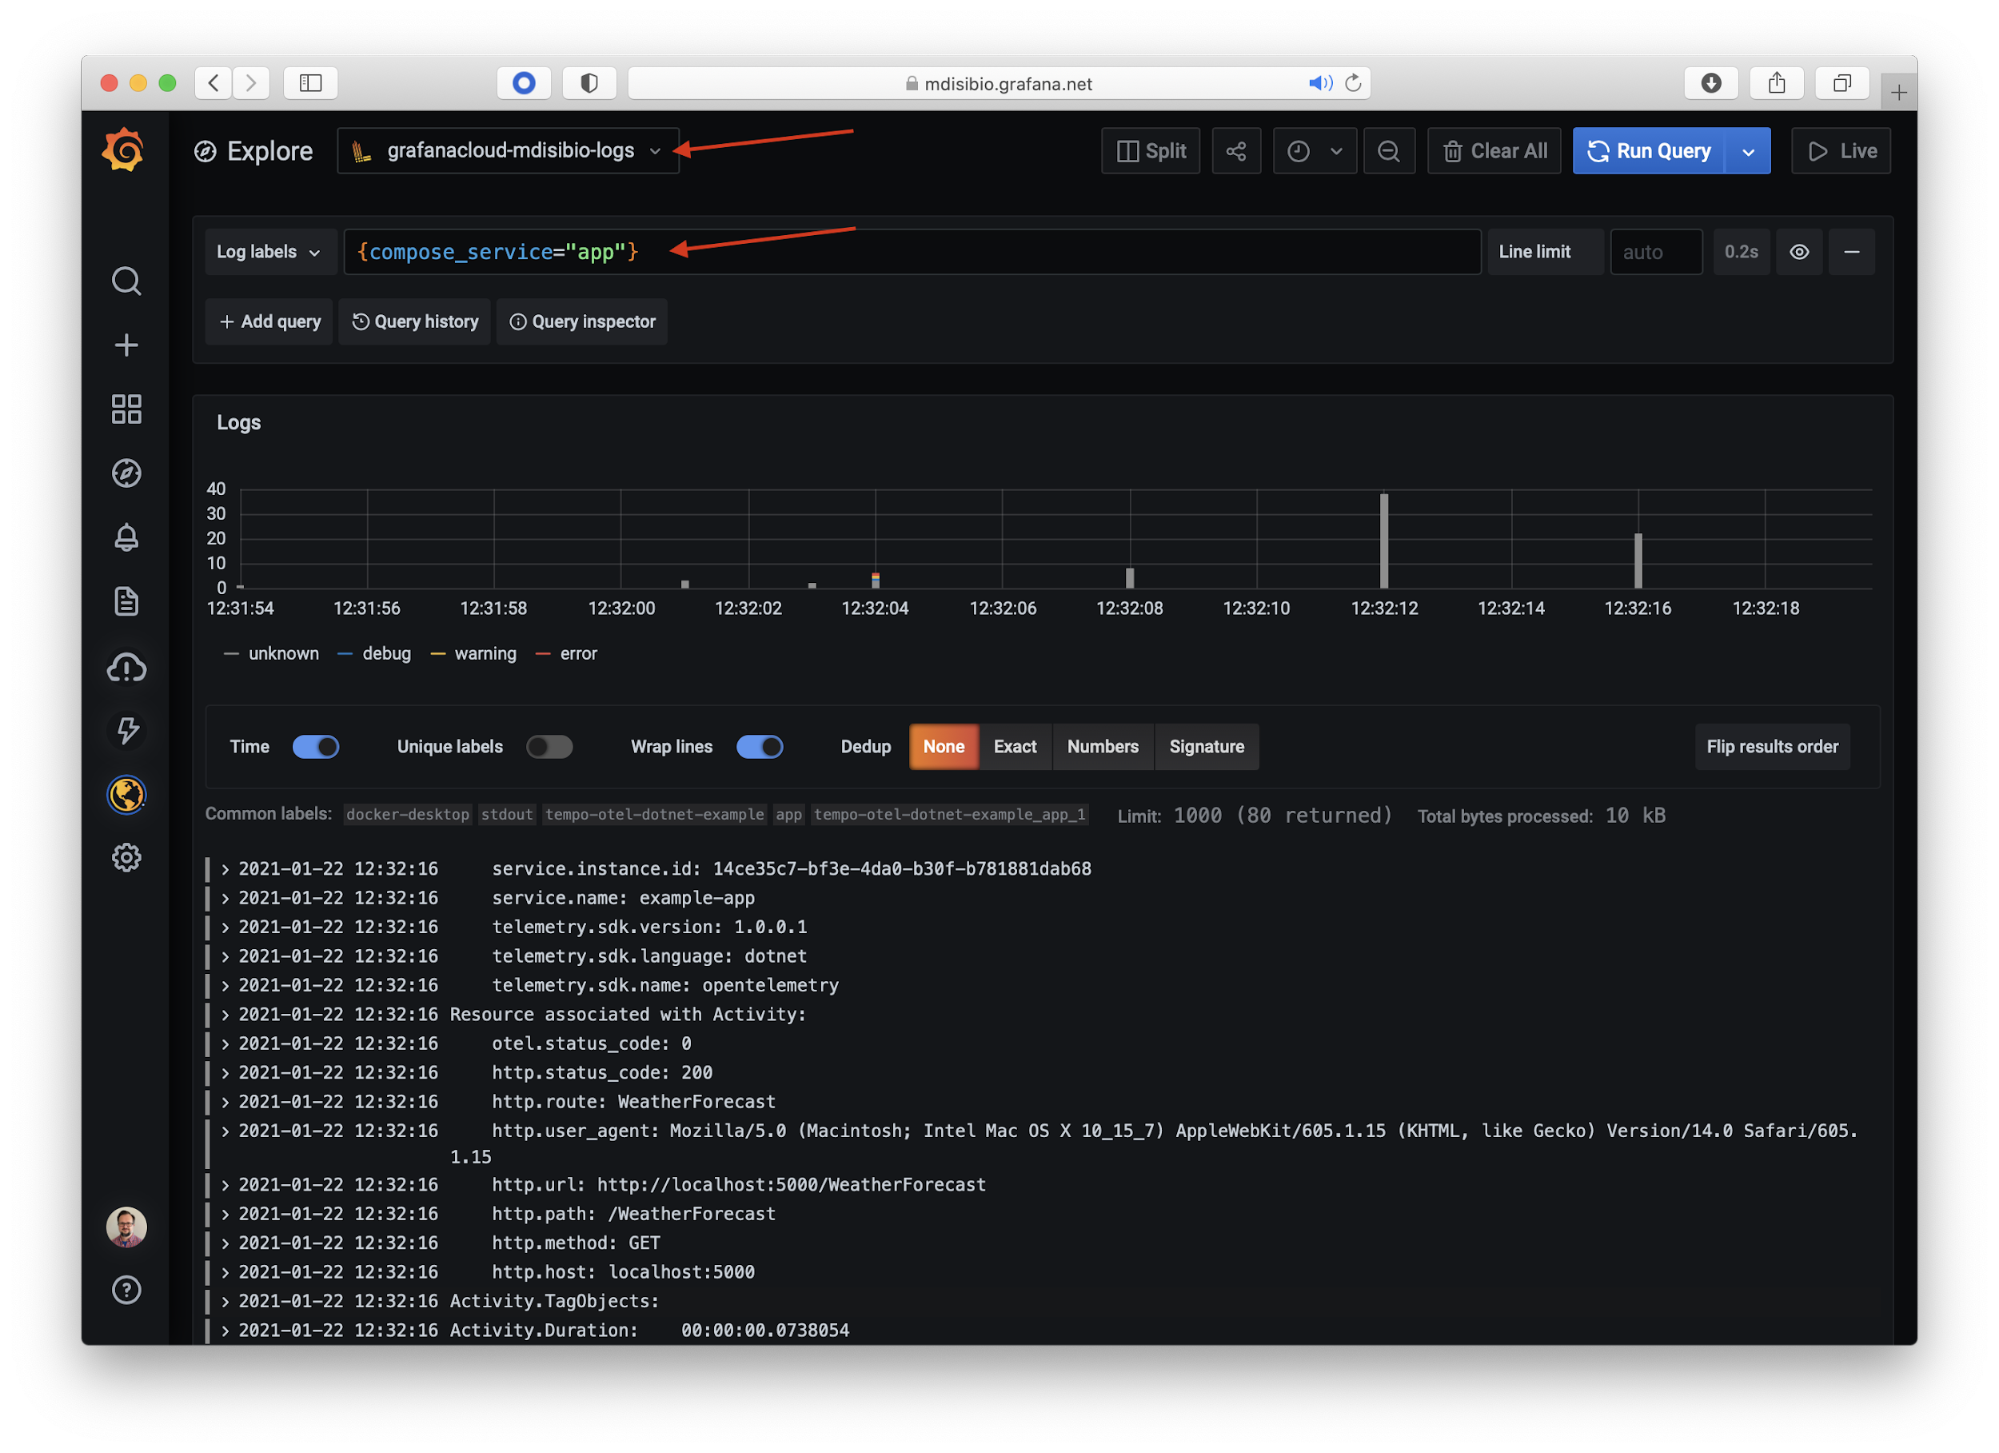
Connecting logs and traces
O.K., now that we have both traces and logs being sent to Grafana Cloud, let’s connect them using Loki’s derived field functionality.
First, let’s update our application’s logging output to log the trace ID in the format “traceID=…”
- In Startup.cs, remove the console exporter as we no longer need it.
- In WeatherForecastController.cs, update API handler to print the trace ID. Tracer.CurentSpan is a static property that will always point to the span in progress.
    using OpenTelemetry.Trace;

    ...

    [HttpGet]
            public IEnumerable<WeatherForecast> Get()
            {
                Console.WriteLine($"Getting weather forecast traceID={Tracer.CurrentSpan.Context.TraceId.ToHexString()}");

    ...
The log output will look like the following:
Getting weather forecast traceID=b0ed5093e99b514b912dbd213436b518
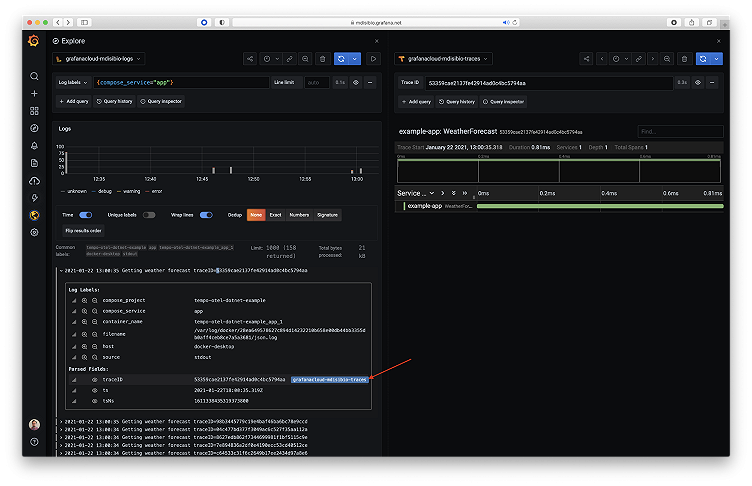
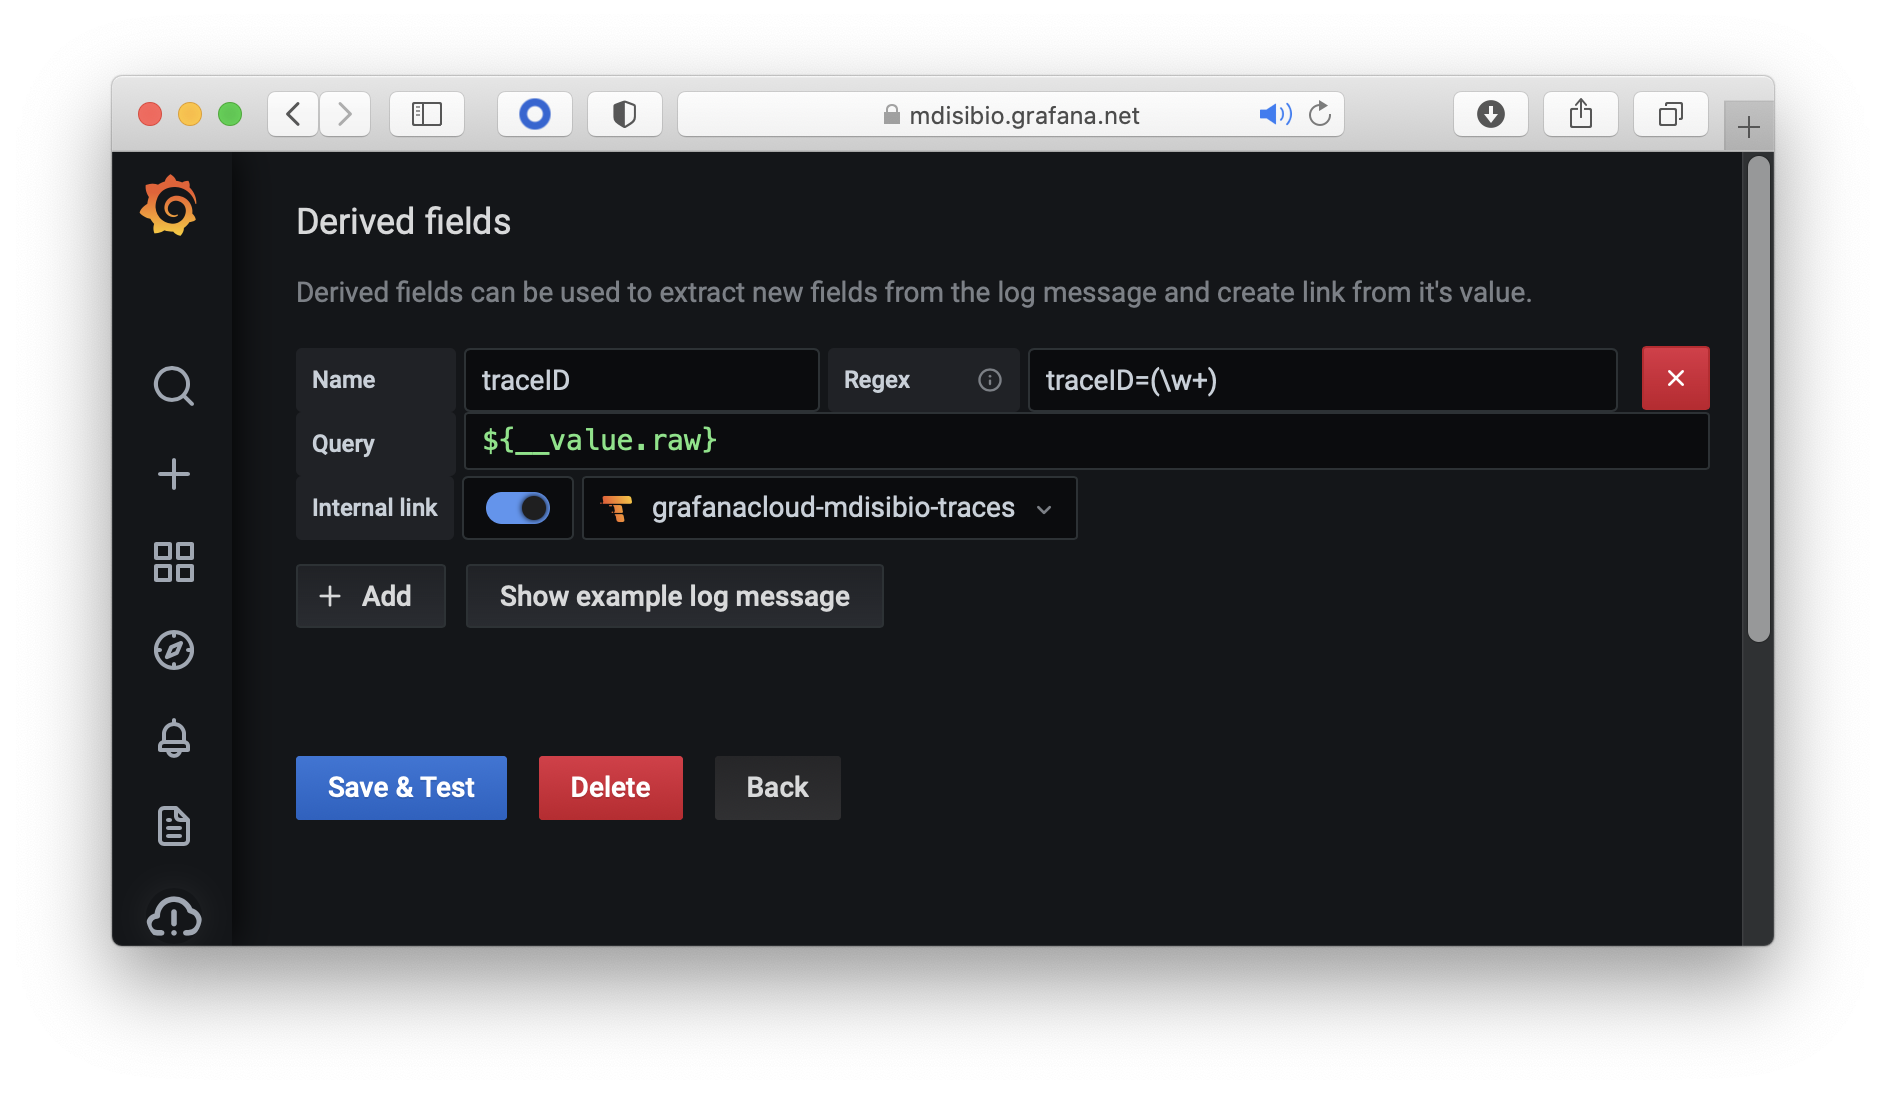
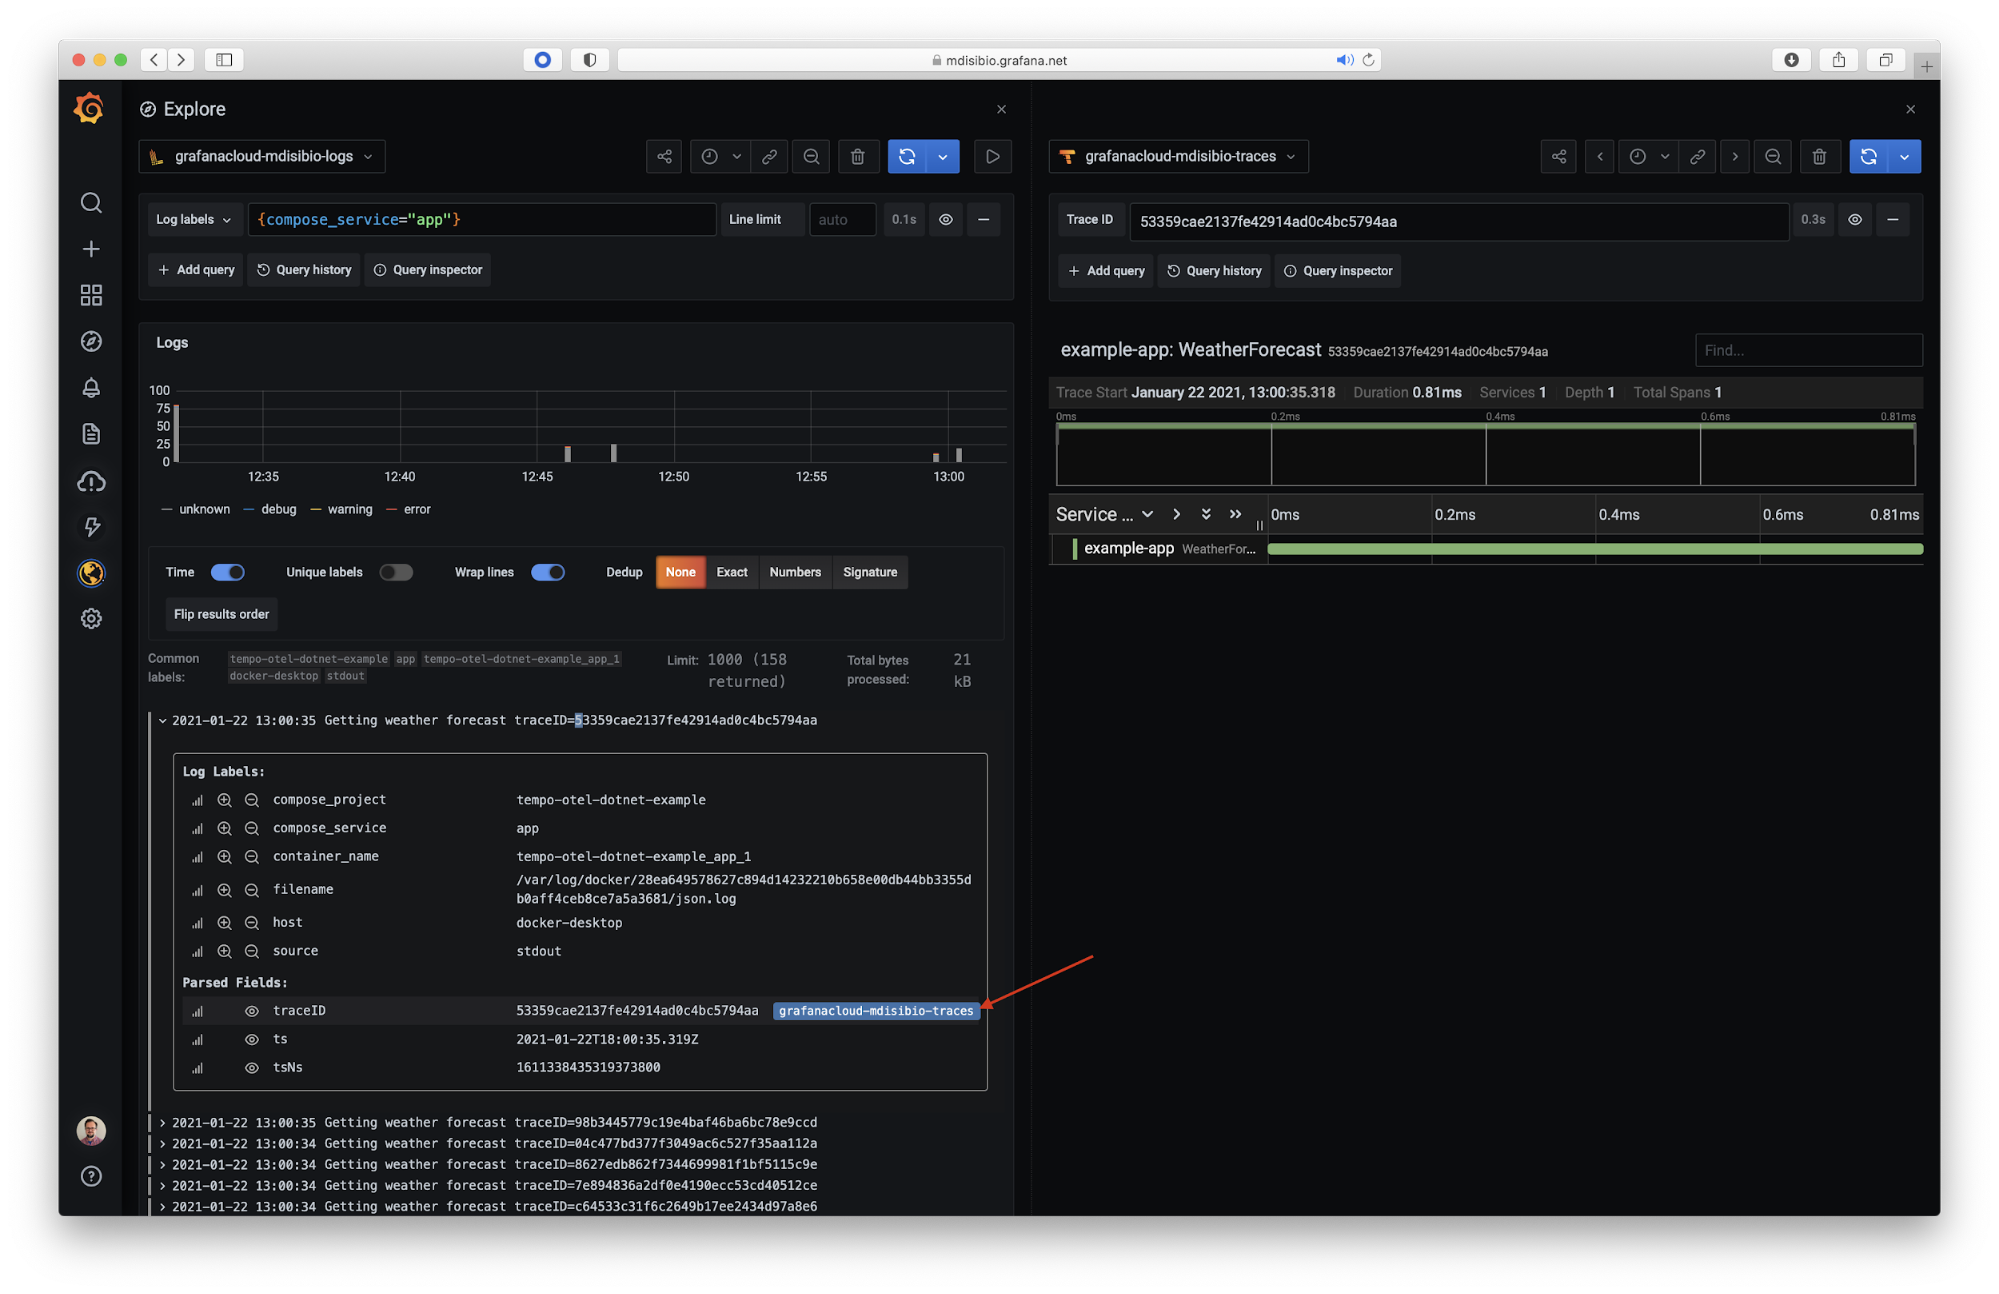
Next, create the Loki derived field in Grafana Cloud. This derived field is how we can turn the “traceID=…” log portion into a clickable link to view logs and traces side by side. See the blog post link above, but the steps are also repeated here for clarity:
Configure your Loki data source by browsing to
.grafana.net, Settings -> Data Sources. Towards the bottom of the configuration page, add a new derived field with the following properties:
a. Name: traceID
b. Regex: traceID=(\w+)
c. Query: ${__value.raw}
d. Internal Link: Yes, and point to your Tempo data source. This is the same data source from above when viewing traces.
Finally, let’s look at our logs again. Expand one of the log lines and now we have a clickable link to quickly jump from logs to traces and view them side by side!
Wrapping up
Here we have seen a quick walkthrough of how to send logs and traces from a .NET web API to Grafana Cloud using the new OpenTelementry .NET libraries and Grafana Agent. All sample code and files can be found in the repository here. This walkthrough uses .NET 5.0 but can be easily adapted for .NET 3.1.
To learn more about Tempo, watch the “Getting started with tracing and Grafana Tempo” webinar on demand.
Grafana Cloud is the easiest way to get started observing metrics, logs, traces, and dashboards, and we’ve just announced new free and paid Grafana Cloud plans to suit every use case — sign up for free now!

