
How I monitor my OpenWrt router with Grafana Cloud and Prometheus
I’ve been an open source fan and user for many, many years, going back to before we defined the term “open source” and we called it “free software.” Whenever and wherever possible I prefer to have control over the software I run on my devices.
Case in point: My internet router runs OpenWrt, which is a free/open source Linux operating system designed to replace the software provided by the router’s manufacturer. You can install OpenWrt on a wide range of supported devices. When you do, you frequently end up with enhanced stability along with additional configuration options not available in the stock software.
In this post, I will describe how to monitor the functionality of my Linksys WRT1900AC router running OpenWrt using Grafana Cloud.
Prerequisites
To send my metrics to Grafana Cloud, I first had to sign up for a Grafana Cloud account and get it set up. There is a free plan available that is perfect for a project like this. I did that some time back, so today all I really had to do was prepare to create a Prometheus configuration YAML file by making note of my Grafana Cloud username and in the place of a password, an API key.
You must also have an internet router that is set up properly and running OpenWrt and a system within your local area network capable of running Prometheus to scrape the metrics from your router and forward them to Grafana Cloud.
Interacting with OpenWrt
Along with the base operating system, the OpenWrt Project provides a large set of software packages you can install to customize how you use your hardware and what the software does. Most of those packages allow significant configuration options. This is how we will accomplish today’s goal.
There are two ways to interact with OpenWrt to install packages. You can log in to the router directly using ssh or, if you have it installed, you can use a web UI called Luci. An ssh connection gives you a Busybox shell that includes a useful subset of standard UNIX utilities.

If you prefer to use a GUI, Luci provides an interface that is similar to stock firmware and easy to navigate.

Exposing metrics from an OpenWrt router
The first thing to figure out is how to export useful metrics from the router. I want them in a Prometheus format to make visualization in Grafana Cloud simple. Fortunately, there are Prometheus node exporter packages available in the OpenWrt package manager.
We will use the command line interface. There are several packages we want to install, including a Prometheus node exporter and a set of specific metric exporters. The packages are:
- prometheus-node-exporter-lua
- prometheus-node-exporter-lua-nat_traffic
- prometheus-node-exporter-lua-netstat
- prometheus-node-exporter-lua-openwrt
- prometheus-node-exporter-lua-wifi
- prometheus-node-exporter-lua-wifi_stations
To install the packages, we use the Opkg package manager that comes with OpenWrt. First, update the list of packages:
opkg update
Then install the packages we want:
opkg install prometheus-node-exporter-lua \
prometheus-node-exporter-lua-nat_traffic \
prometheus-node-exporter-lua-netstat \
prometheus-node-exporter-lua-openwrt \
prometheus-node-exporter-lua-wifi \
prometheus-node-exporter-lua-wifi_stations
There are other Prometheus exporter packages available, even a package of Prometheus itself if you have a router with storage and memory large enough to run the full version (in which case you could actually remote_write to Grafana Cloud directly from your router!). I chose these because I found this contributed dashboard that is preconfigured to use the metrics from this set of exporters.
By default, the node exporter we installed will export data to localhost at port 9100 to /metrics. Let’s test whether the node exporter is exporting data as it should. You may need to install the curl utility before this command works. If it does, you will see several screens of structured metrics scroll past.
curl localhost:9100/metrics
That’s nice, but we can’t scrape that externally, and for most of us there isn’t enough space on a router to run a Prometheus instance. So we need to make these metrics available via a LAN-accessible IP address.
To do so, we will edit /etc/config/prometheus-node-exporter-lua. Side note: the editor that is installed with OpenWrt is the BusyBox version of vi, so brush up if you don’t remember how to use it (although all good SREs should at least know the basics, right?).
Edit the file so that these are its contents:
config prometheus-node-exporter-lua 'main'
        option listen_ipv6 '0'
        option listen_port '9100'
        option listen_interface 'lan'
It’s tempting to try to put an IP address in listen_interface, but that won’t work. The interface needs to be an OpenWrt interface name. You can find the list of available named interfaces in the /etc/config/network file.
After editing /etc/config/prometheus-node-exporter-lua, you must restart the service to load the new configuration, like this:
/etc/init.d/prometheus-node-exporter-lua restart
My router’s IP address on my LAN is 192.168.1.1. Metrics are now available to anyone on my LAN at 192.168.1.1:9100/metrics. Here’s an excerpt of what that looks like in my browser:

Scraping OpenWrt metrics with Prometheus
Ultimately, we need to send the metrics to Grafana Cloud. To do this, we have to first scrape the metrics from the internal LAN-available URL. As I’ve mentioned on my personal blog, I am already running Prometheus on a Linux workstation in my LAN and am using it to send other metrics to my Grafana Cloud instance.
Prometheus can be configured to push metrics to a remote location using a feature called remote write. To configure remote write to send my metrics to Grafana Cloud, I first had to sign up for a Grafana Cloud account and get it set up. I did that some time back, so today all I really had to do was edit the Prometheus configuration YAML file, by inserting this code snippet. Of course, I edited it to include my Grafana Cloud username and in the place of a password, an API key.
This is the code that needed to be added to the end of the prometheus.yaml configuration file to push metrics via the remote_write feature to my Grafana Cloud account:
  remote_write:
        - url: https://prometheus-us-central1.grafana.net/api/prom/push
          basic_auth:
            username: [Your Grafana Cloud UserID]
            password: [Your Grafana Cloud API Key]
At the same time, I added a new job_name section as well:
  - job_name: OpenWrt
    static_configs:
      - targets: [192.168.1.1:9100']
Viewing metrics in Grafana Cloud
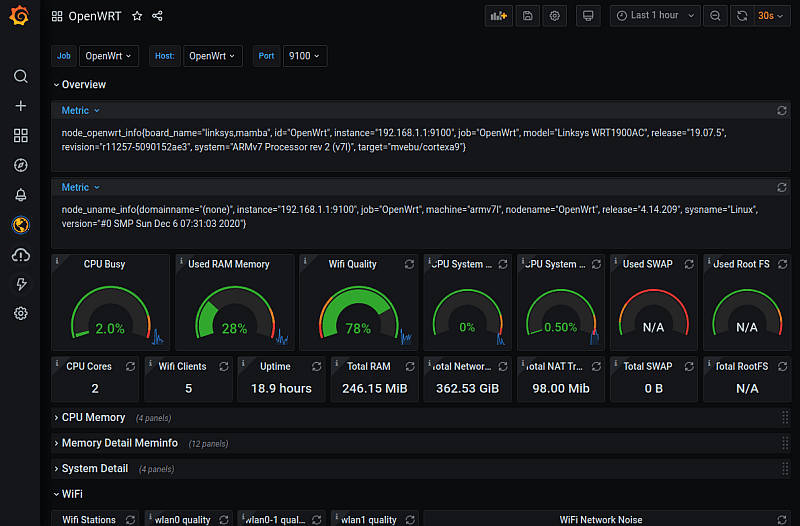
After a few moments, metrics begin to be available in Grafana Cloud. I logged in and went to Dashboards->Manage. From there, I clicked Import and entered this URL for the contributed OpenWrt dashboard I mentioned earlier: https://grafana.com/grafana/dashboards/11147.
This is an excerpt of that dashboard in action.
Postscript
The entire process took me a couple hours. It would have been faster, but I had to figure out some of the details myself, which I am documenting and sharing in this blog post.
Since writing this I have learned that Grafana Labs’ own Tom Wilkie has created an init.d script for OpenWrt to make it easy to run the full Prometheus node_exporter on your router instead of the Lua versions used above. In addition, he created a similar script for the dnsmasq_exporter, since OpenWrt already has Dnsmasq installed and running.
The one catch with Wilkie’s method is that most commodity/consumer-level devices, like my six-year-old v1 Linksys WRT-1900ac, do not have adequate storage space or memory to run the full versions of the Prometheus exporters. However, for those running OpenWrt on devices with larger amounts of storage and memory available, this is certainly more powerful and worth exploring.

