

How using Grafana (and plugins) gave a jolt to Smart State Technology, a company advancing technology for energy infrastructures
Smart State Technology (SST) is a company based in the Netherlands that develops advanced technological and future-proof solutions for smart grids. Their mission is to reinforce critical energy infrastructures by providing innovative energy solutions that connect industry and research, while ensuring society can fully benefit a sustainable energy future.
SST’s unique platform-based solution helps utilities to transform the electricity distribution grid into a sustainable digital energy system with a secure IT infrastructure that maintains a high quality of service.
The company has created a large set of tools for analyzing measurements, visualizing results, and phasor plotting.
What’s powering the way they look at their measurements? Grafana, of course.
The relationship began when SST, which was founded in 2016 by Dennis Bijwaard and Omar Mansour, needed to create web-based visualizations with real-time data updates for their own R&D engineers (software and electrical) and R&D engineers (software, electrical, and power) from other research project partners.
“We considered customized SVG editors for building the dataflow, a customized website with Flask, or Django backend,” recalls Bijwaard, whose responsibilities include working on the kernel driver, distributed communication, DSP flows, real-time database, and Grafana. “We choose Grafana since it offers a lot of functionality (data sources, panels, etc.) out of the box, and is an active and growing community.”
Bijwaard (who notes he’s “not a hero in JavaScript and eye candy”) also appreciated that much of Grafana’s functionality can easily be re-used via plugins, and that the dashboards have “a professional look and feel.” And because Grafana is so easy to set up, he said no time was wasted as they got their functional system up and running. They experienced speedy responses to support requests, and have had productive interactions with Grafana Labs team members.
“The access to the [plugin] developers/maintainers make it easier to discuss issues and new features, and to test updates when they become available,” Bijwaard says.
Full potential
SST uses Grafana on a variety of different machines: lab workstations, laptops, and embedded machines running in low-voltage substations.
Because they have data coming in from various substations, they’re consuming a large volume of metrics. One voltage/current sensor produces a number of (calculated) measurements, from 4000Hz raw samples to 50Hz phasors and 1Hz harmonic distortions. A substation can have multiple fields (1 incoming + multiple outgoing) to measure—and there are several thousand substations in the Netherlands alone.
“We’re using Grafana intensively for Smart Grid dashboards showing our Low Voltage Sensors in action, and using plugins like flowcharting, SVG, and the JSON data source,” Bijwaard says.
More specifically, their Grafana dashboards visualize:
- the geographical location of measurements (alexandra-trackmap)
- substation power/voltage/current overview (flowcharting plugin)
- substation feeder with overview (flowcharting) and historical measurements (graph)
They’ve also created real-time dashboards using their own JSON data source, which show:
- detailed last 3 second snapshots of voltage/current/power values (graph panel)
- phasors for voltage/current/power as rotating arrows (SVG plugin)
- last 2 cycles (50Hz) of (4kHz) raw samples (graph panel without x-axis)
- harmonics (plotly panel)
- DSP flow dashboard that shows complete flow and its intermediate outputs
Bijwaard finds the FlowCharting plugin especially useful. “The nice thing about it is that we can combine design and visualization—including parameterization—in similar diagrams that we can all create with draw.io.”
SST utilizes several different technologies alongside Grafana: Python/Flask for Web Server and JSON datasource that listens to real-time measurements; C++ and Python for software DSPs; InfluxDB for realtime database; ZeroMQ for real-time communication between software DSPs; and CBOR for binary messages over ZMQ.
“We use SSH port-forwarding to tunnel the Grafana TCP/IP port to our lab, and use the Apache web-proxy to make the combination of Grafana instances available as one website, using separated paths in the URL for the different Grafana instances,” Bijwaard adds. They use FlowCharting and panel hyperlinks to switch to other dashboards and Grafana instances. SST also wrote a parser to extract links and parameters from a DSP flow diagram in order to execute those (C++/Python) DSPs with the given parameter, and subscribe to linked DSP outputs on sensors, workstations, and more.
Charged charts
During a November 2020 United Grid webinar, Bijwaard and Mansour spoke about their work, and Bijwaard gave a live demo that showed how SST is using Grafana as part of an advanced measurement solution installed in a lab-house and Low Voltage substations in Eindhoven, the Netherlands.
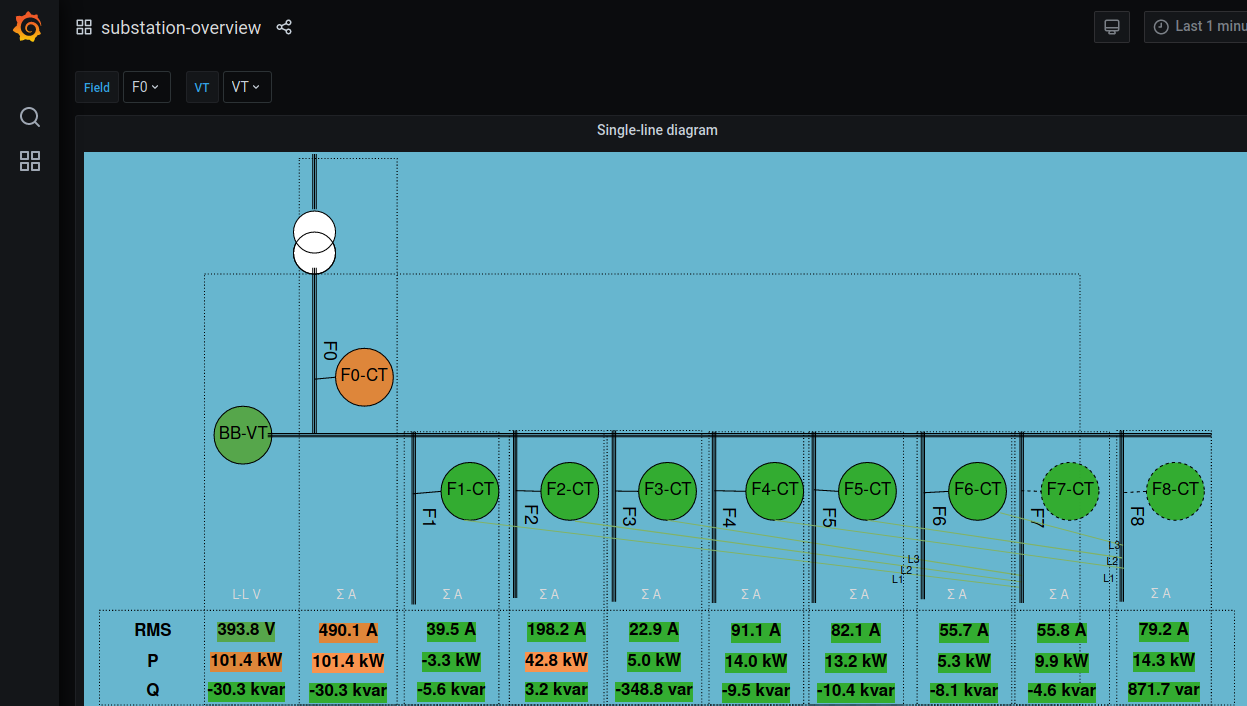
Below is an overview of one substation. It consists of an input transformer (F0), a busbar (a power distributor) that is measured, and a number of outgoing feeders that are also measured. The bottom of the diagram features the RMS values of the sensors, the power, and the reactive power.
In this detailed view of a feeder, users are able to see all the different line powers and amperages, along with the history of the current, the history of the voltage, and the history of the power.
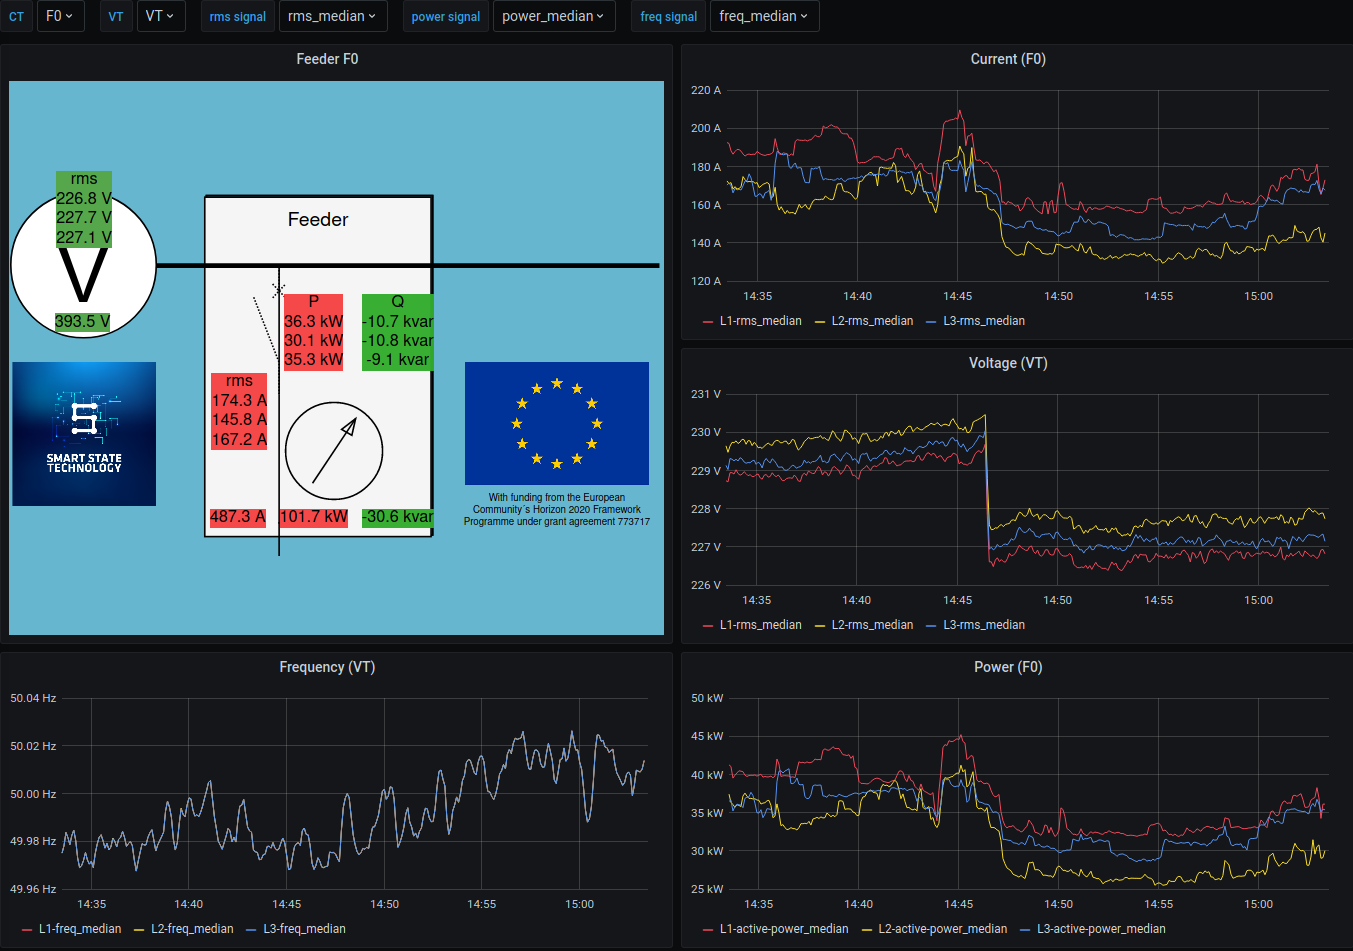
By looking at the frequency deviations as they occur over time, for example, they can observe patterns and learn when energy consumption is higher and lower.
The real-time view, below, shows the voltage on the busbar, the last three seconds of the RMS values (or voltages) of each line of the power, the frequency, and the phasor representation. On the right are the last few cycles of the raw signals and below that are the harmonics.
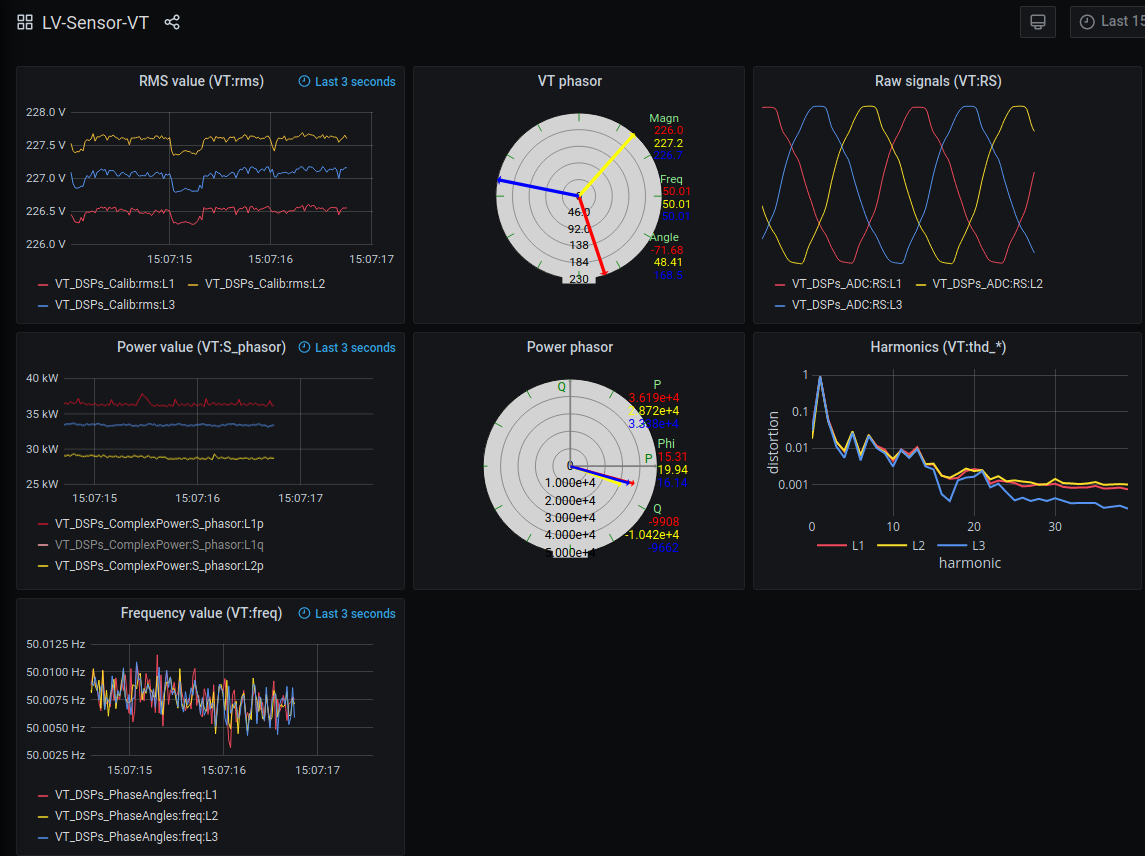
“This real-time information is useful to identify short temporal changes in the signals, and the harmonics give a quick overview of the multiples of the 50Hz AC frequency,” Bijwaard says. “Temporal changes and harmonics can be used to analyze power quality problems like unbalance, over/under voltage, etc. The voltage/current phasors give a quick view of both the phase and the amplitude of the signal, and the power phasors show active, re-active power and the power factor in one diagram.”
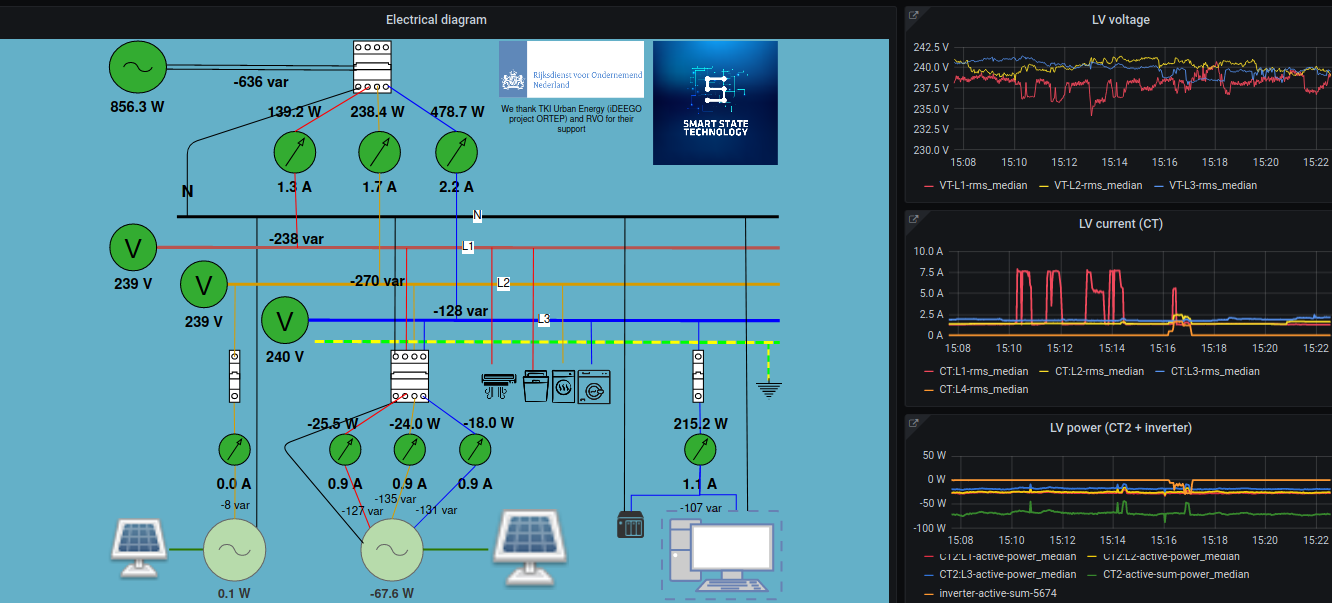
And here is an overview of SST’s lab-house measurements:
Amping up the future
SST is constantly improving their visualizations and adding new dashboards. “We want to go one level up to show the overview of connected sub-stations, and interaction between them,” says Bijwaard.
In order to accomplish that, he’s hoping that future Grafana releases will increase the limit of how much code they can embed in Grafana plugins. (At the moment, the SVG plugin is the only panel where they have full JavaScript control to manipulate metrics.)
“In some cases the predefined calculations and transforms are not enough,” Bijwaard explains. “It would be great if we can calculate our own metrics from existing ones (e.g., via JavaScript) and, for example, use the two values of a phasor (which is a complex number) to calculate its polar form as new angle and magnitude metrics.”
The company is currently in talks with the developers of key plugins to discuss new features that have mutual benefits.
While Grafana serves SST well when it comes to monitoring—which is mostly a one-way process, from sensor towards the user—they also hope that one day they’ll be able to use dashboards to send configuration/control commands towards the sub-stations.
“Of course, this needs proper authentication and authorization roles in place in the whole chain,” Bijwaard says. “It would be great if the notion of data-sinks can be added besides the data sources.”
In the meantime, SST is integrating Grafana into their new project, FairPlay, which deals with distributed control of renewable energy generation and usage in agricultural areas. They hope to give an overview of the measurement area, the measurements at each farm, the outcomes and gains of the distributed control algorithms, and more.
“Grafana has helped us to develop the web view of our measurement platform in a low-code, scalable and future-proof way with limited effort,” Bijwaard says. “The dashboards give us both historic and real-time insight in the electrical signals and derived measurements, and are extendable for multiple usage types. In the future, we hope to benefit from the developments in Grafana as well as the numerous plugins to keep extending and improving the dashboards.”