

ICYMI: The 10 most-read blog posts of 2020
As 2020 comes to a close, we’re looking back at the 10 most-read blog posts of the year. Here’s another chance to check them out in case you missed them the first time around.
1. Grafana v7.0 released: New plugin architecture, visualizations, transformations, native trace support, and more
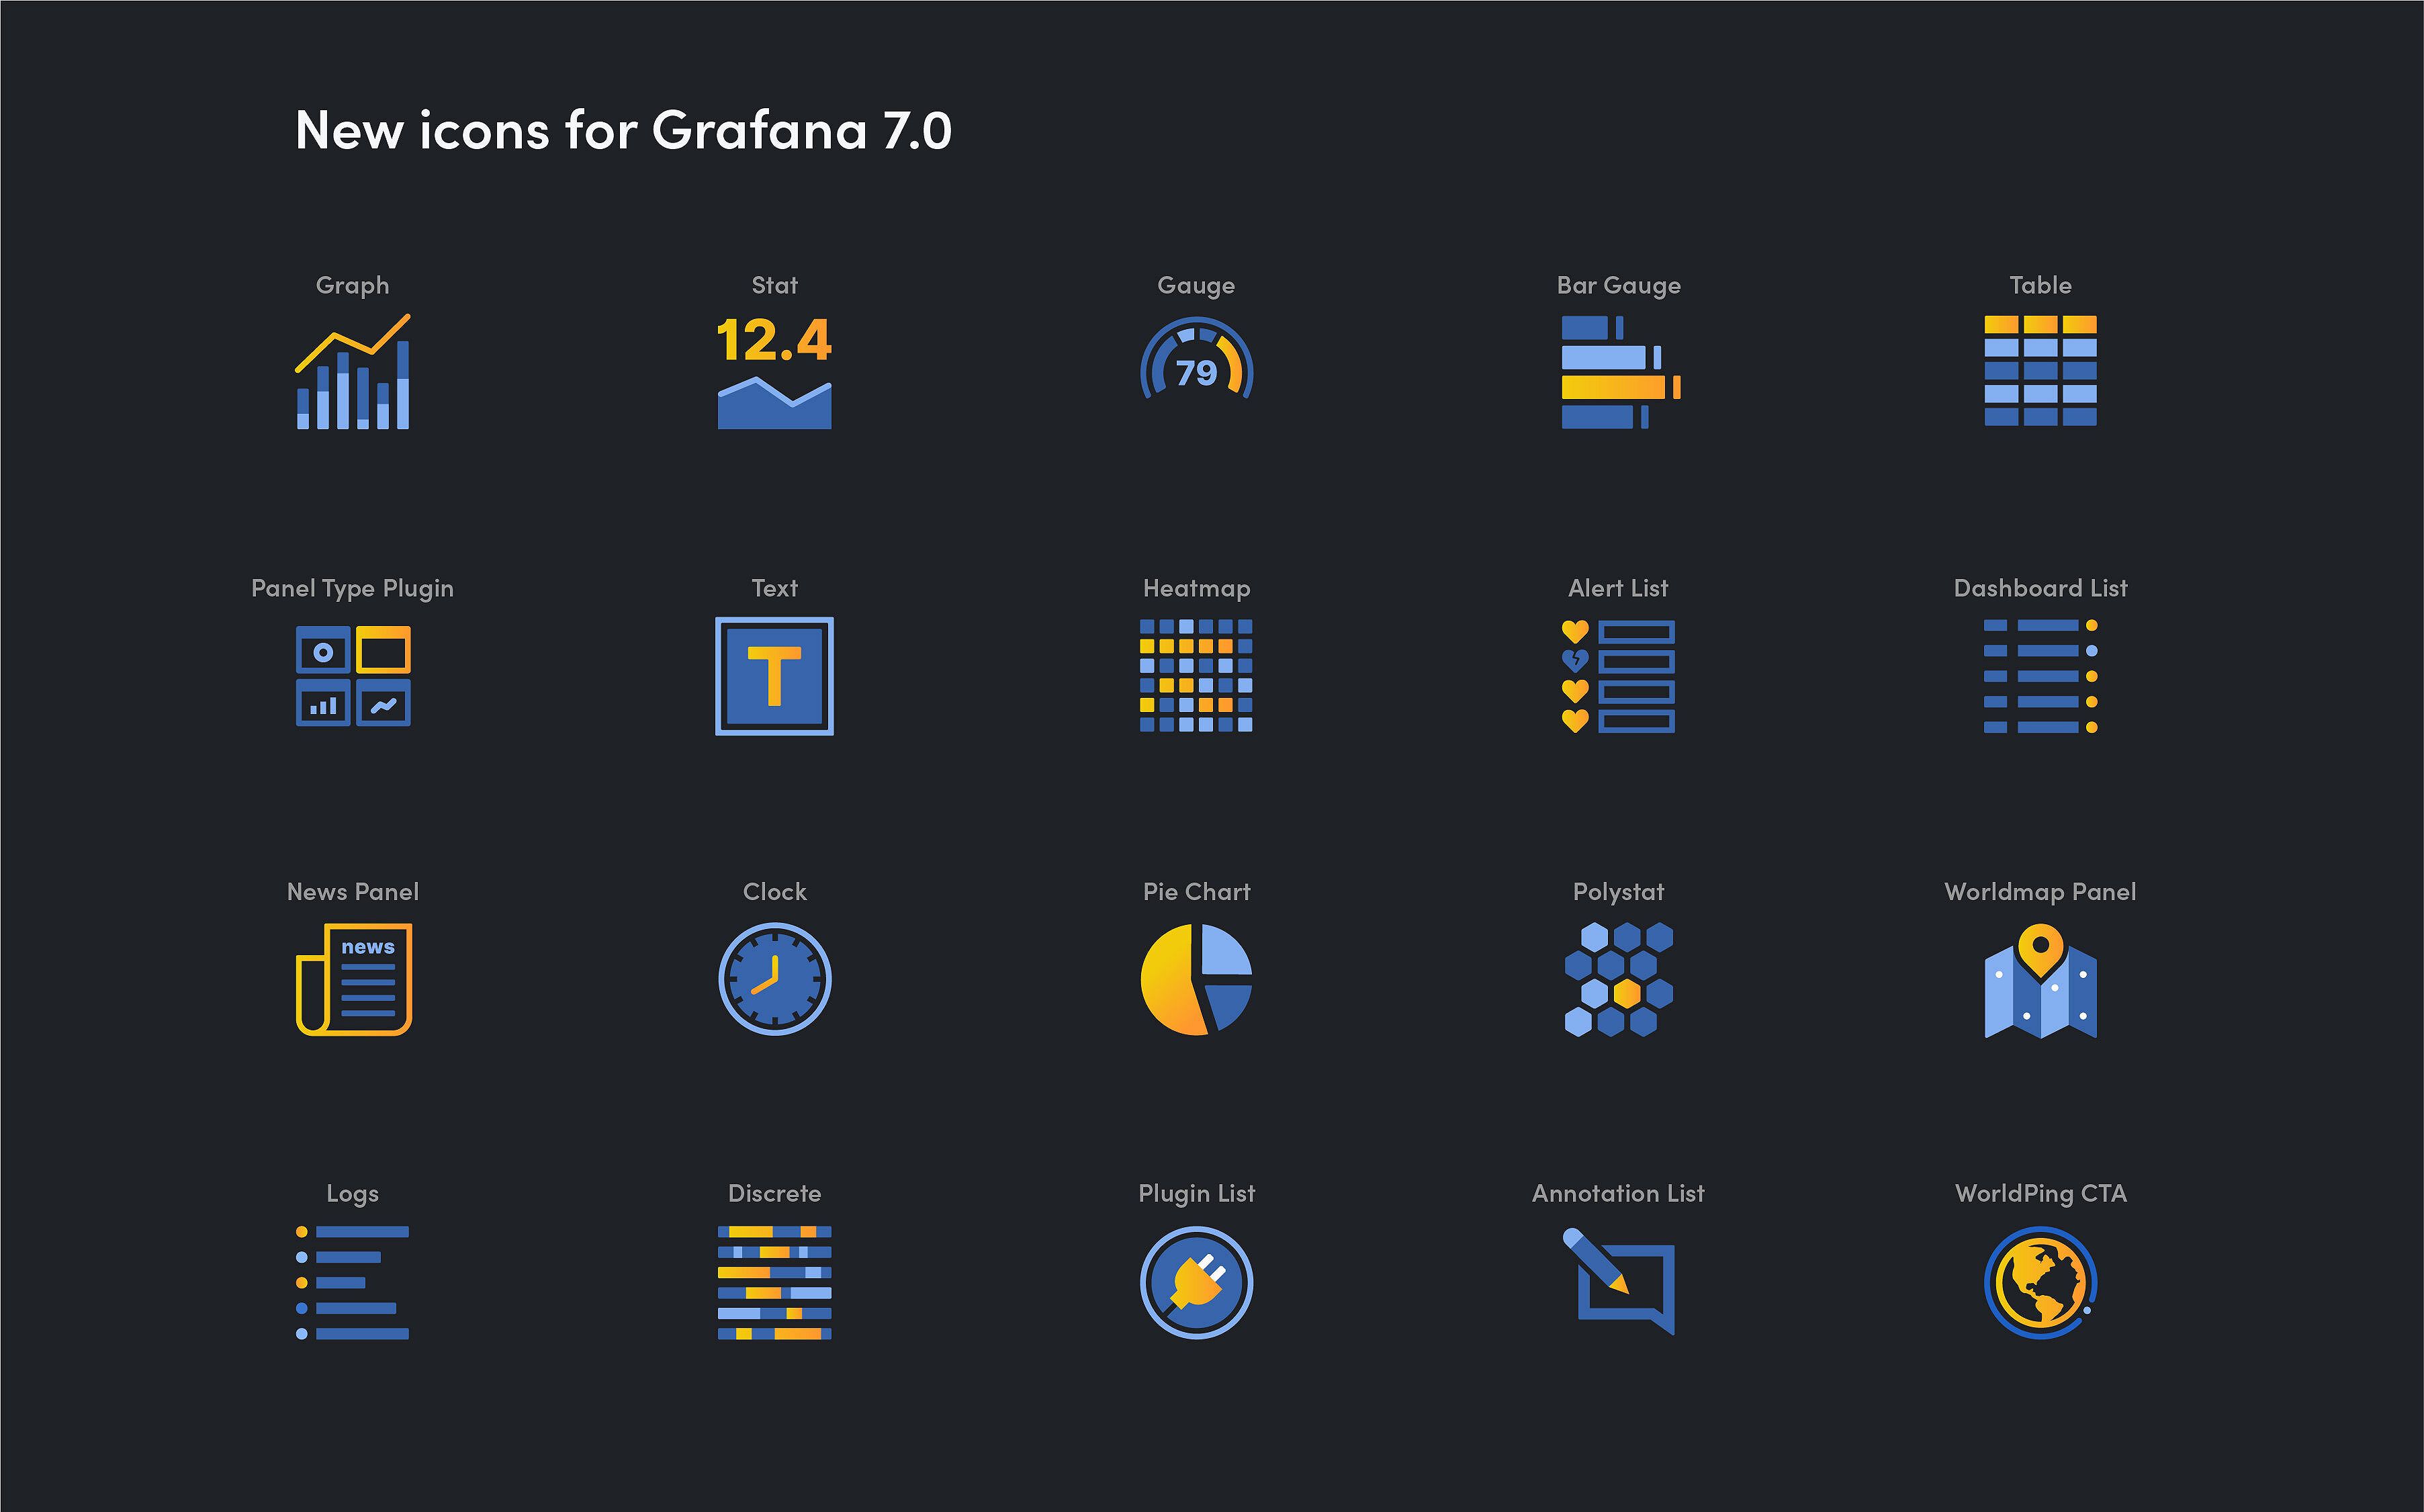
The goal of this major release, announced during GrafanaCONline in May, was to extend on the Grafana platform by making it easier and more consistent for existing users, and intuitive and simple for those not familiar with Grafana.
2. Step-by-step guide to setting up Prometheus Alertmanager with Slack, PagerDuty, and Gmail
Follow Ivana Huckova’s blog post on Prometheus Alertmanager for a beginner’s guide to setting up alert notifications for Slack, PagerDuty, and Gmail.
3. Introduction to PromQL, the Prometheus query language
Another 101-level Prometheus post, Emil Tullstedt’s blog focuses on the features of the PromQL query language.
4. How to configure Grafana as code
At FOSDEM 2020, Malcolm Holmes and Julien Pivotto discussed creating fully reproducible Grafana dashboards using Grafonnet – and why it leads to better workflows.
5. Announcing Grafana Tempo, a massively scalable distributed tracing system
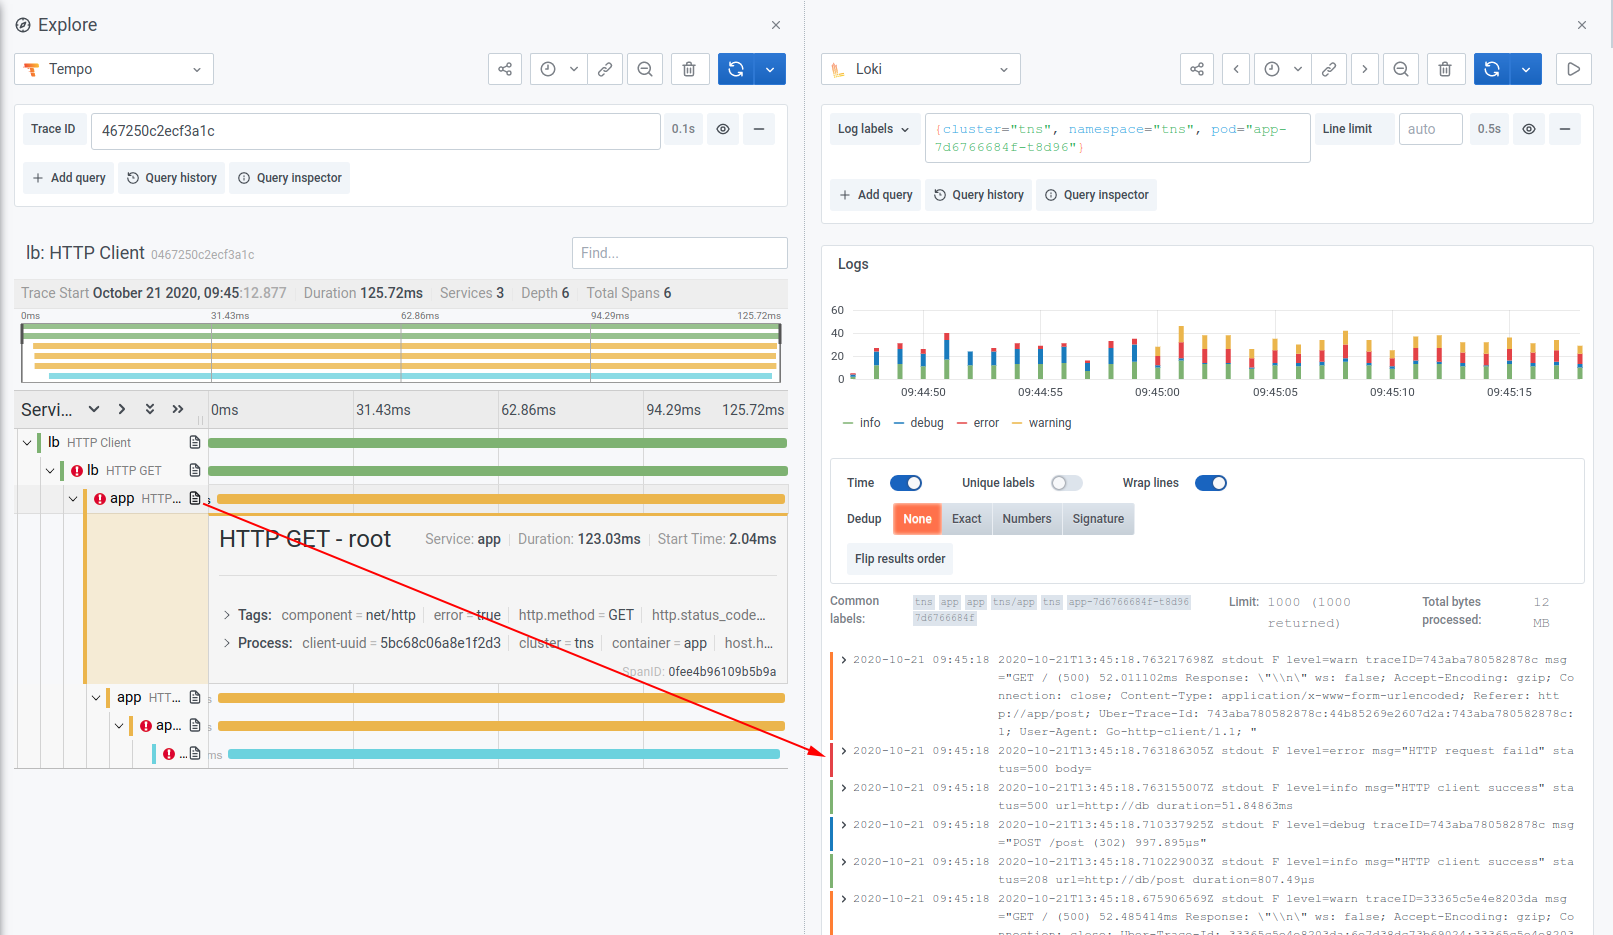
Tempo creator Joe Elliott provides the details about the open source project, which is designed to be a robust trace id lookup store whose only dependency is object storage (GCS/S3).
6. An (only slightly technical) introduction to Loki, the Prometheus-inspired open source logging system
Does your organization need to invest in log management? Grafana Labs Solutions Engineer Ward Bekker breaks down everything you need to know about Loki.
7. How to visualize Prometheus histograms in Grafana

Learn how to turn a Prometheus histogram into a stat panel, bar gauge, or heat map in Grafana in this tutorial.
8. Learn Grafana: How to use dual axis graphs
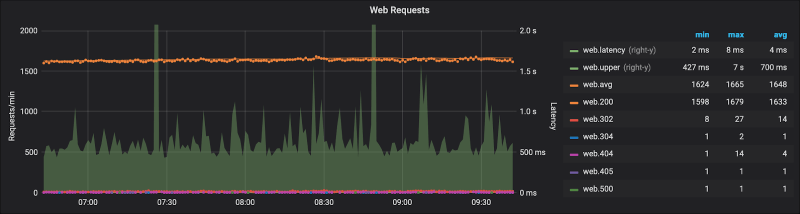
Why on earth would you need another Y axis? In this post, Marcus Olsson explains dual axis graphs in Grafana, and when you should use them.
9. Introducing Tanka, our way of deploying to Kubernetes
YAML sucks! Tom Braack struck a chord with this blog post explaining why existing tools hardly ease this pain, and what we at Grafana Labs did about it with our new project, Tanka.
10. Pro tip: How to monitor client certificate expirations with Prometheus
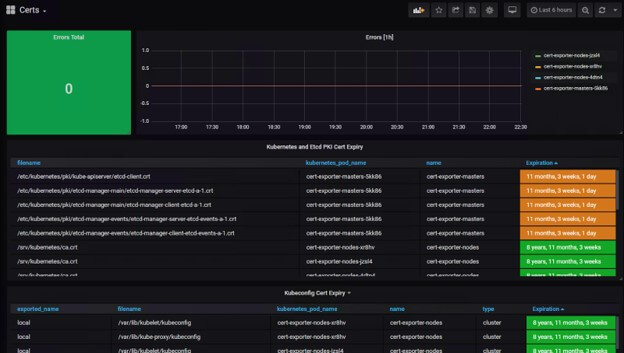
This post shows how to easily track certificate expirations using Prometheus and Grafana.

