

Loki 2020 year in review
What a year 2020 has been for Grafana Loki! Just a little more than a year ago, we announced Loki’s 1.0.0 GA release. We’re excited to report that 2020 brought a big uptick in its adoption (users have quickly realized the advantages of a small index—plus, Loki has non-technical advantages, too); significant performance enhancements; and the recent release of Loki 2.0. Loki now contains a set of query language features that enable extraction of labels at query time, removing previous limitations on what was possible in queries.
Let’s look back at how we got here (and make sure to read all the way to the end for a special holiday gift!):
Next-level queries
Back in January, Grafana Labs released Loki 1.3.0, which was especially great news for anyone running Loki in microservices mode. It introduced the Loki Query Frontend, which sits in front of the queriers and allows sharding queries based on time. That lets your queriers execute large queries in parallel by breaking them up into smaller pieces. The query frontend also provides protection from denial of service attacks using per-tenant query scheduling, implements automatic retries and step alignment for metric queries, and uses a pull (instead of push) model with downstream queriers.
Several more improvements were introduced at the same time: a configurable compression algorithm; the chunk_target_size configuration; better sync of flushed chunks to reduce duplicates; and a change to Promtail, which allows it to listen for syslog messages and send them to Loki.
Radical regex
As the months passed, it became obvious how invested members of the Loki community are in our log aggregation system. Loki v1.4.0 was released in April, and that was thanks, in part, to more than 130 PRs from over 40 contributors. New features included query statistics, binary operators and numeric literals in LogQL, and regex optimizations. The regex simplification increased performance by up to 300x!
Index intro
A new index option named boltdb-shipper was introduced in the May release of Loki v1.5.0. As a result, Loki can be run with only an object store (S3, GCS, Filesystem, etc.) — there’s no longer a need for a separate dedicated index store (DynamoDB, Bigtable, Cassandra, etc.). The benefits are huge, drastically simplifying the deployment of Loki and further reducing the cost to operate.
Self improvements
August’s release of Loki v.1.6.0 saw changes that made Loki itself even better. Some of those included improvements to the way memory is allocated and reused for queries, and changes to how Loki internally processes log queries vs. metric queries. Creating separate code paths to further optimize metric queries led to metric query performance being 2 to 10 times faster than before.
There were many query frontend changes as well, but the big highlight was that it became possible for a much larger range of queries to be sharded and performed in parallel.
Promtail wasn’t left behind: One of the most exciting new features allows Promtail to expose the Loki Push API. With this, you can push from any client to Promtail as if it were Loki, and Promtail can then forward those logs to another Promtail or to Loki.
Another great highlight was an addition to the command line query tool LogCLI that allows you to color code your log lines based on their stream labels, for a nice visual indicator of streams.
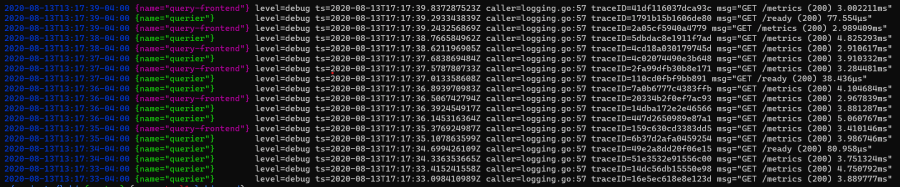
Color-coded log lines
Next-gen news
The October release of Loki 2.0 said goodbye to the external index and hello to single store Loki. Other highlights—and there are many—include more powerful filtering capabilities (now it’s possible to extract labels from log lines at query time), a log-viewing format that reduces eye strain, and new ways to visualize logs as metrics.
Another Loki improvement in 2.0: the ability to directly generate alerts from your Logs in Loki and send them to a Prometheus Alertmanager.
Ward Bekker from the Solutions Engineering team explored and explained his favorite 2.0 features in this video:
What’s ahead
We’re currently testing out a write-ahead log to add increased durability to log messages; designs are being hatched for removing the ordering constraint on incoming logs; and thought is being placed into how Loki can start handling custom retention and deletion of logs. We’re always working hard to increase performance, and 2021 will be no exception. As we look for ways to squeak the most speed out of object stores, also keep an eye out for some improvements to the query API, perhaps something which could stream logs :)
If you can’t wait for these features, here’s a holiday gift to hold you over: Loki 2.1 was released today! With well over 100 PR’s merged since 2.0, 2.1 comes with some important fixes and performance improvements on the new code added in 2.0. Check out the release page!
As a reminder, Loki OSS support is slowly moving away from #loki on Slack and over to community.grafana.com. There are a lot of good reasons for this, including the fact that the popular topics will guide the Grafana Labs team toward what documentation needs improvement.
Loki had such a great year thanks to the help and support provided by the community. Thank you for everything—and here’s to a productive 2021!
LOKI RESOURCES
TALKS & WEBINARS
Logging with Loki: Essential configuration settings
ObservabilityCON: Observability with logs & Grafana
BLOG POSTS
How to create fast queries with Loki’s LogQL to filter terabytes of logs in seconds
Loki OSS support moving from Slack to grafana.com community forums
Video: Top three features of the new Loki 2.0
Loki 2.0 released: Transform logs as you’re querying them, and set up alerts within Loki
All the non-technical advantages of Loki: reduce costs, streamline operations, build better teams
The concise guide to labels in Loki
Loki tutorial: How to send logs from Amazon’s ECS to Loki
Loki tutorial: How to send logs from EKS with Promtail to get full visibility in Grafana
Gardener, SAP’s Kubernetes-as-a-service open source project, is moving its logging stack to Loki
Loki tutorial: How to set up Promtail on AWS EC2 to find and analyze your logs
How a regex simplification in Loki increased performance by up to 300x
Loki v1.5.0 released, with no more dependency on a separate index store
How labels in Loki can make log queries faster and easier
Loki quick tip: How to use a Loki datasource in your Grafana dashboard
Loki quick tip: How to create a Grafana dashboard for searching logs using Loki and Prometheus
Loki v1.4.0 released, with query statistics and up to 300x regex optimization