
How to find traces in Tempo with Elasticsearch and Grafana
Grafana Tempo, the recently announced distributed tracing backend, relies on integrations with other data sources for trace discovery. Tempo’s job is to store massive amounts of traces, place them in object storage, and retrieve them by ID. Logs and other data sources allow users to quickly and more powerfully jump directly to traces than ever before.
Previously we investigated discovering traces with Loki and exemplars. In this post we explore using another logging alternative, Elasticsearch, along with Grafana to build links directly from your logs to your traces.
Let’s get started
Let’s use a demo repo that will walk us through setting up Elasticsearch and Tempo to store our logs and traces. Additionally, we will use Grafana to visualize our datasources as well as provide an easy mechanism to discover traces from logs. Step-by-step instructions are included in the main readme if you want to experiment as well!
It should be also noted that I am far from an Elasticsearch expert, as we use Loki here at Grafana Labs. If you see any obvious issues, please feel free to make PR updates to the example!
Elasticsearch data links
The trick to setting up a link from Elasticsearch to Tempo is to use a data link. In the Elasticsearch data source configuration, it will look something like this:

With this configuration, Grafana will look for an Elasticsearch field called “traceID.” If one is found, Grafana will build a link using this ID to the Tempo data source.
After we get this link set up correctly, then in Explore, we can jump directly from logs to traces:

Now all the power of your Elasticsearch logging backend is available to you for finding traces as well!
A note on logfmt
The Elasticsearch ecosystem seems primarily geared toward JSON logging, but at Grafana Labs, logfmt is the preferred formatting for logs. In order to get links to work from Elasticsearch fields, we needed to extract the logfmt key/value pairs and insert them as Elasticsearch fields.
We used Filebeat along with a custom pipeline processor to accomplish this, but it seems that perhaps logstash along with a third party processor may have been a better path.
With the above configuration, the following log line…
level=info msg="HTTP client success" status=200 url=http://tns-db duration=2.213011ms traceID=2bd4c457541a72fa
…was parsed into the following fields in Elasticsearch:
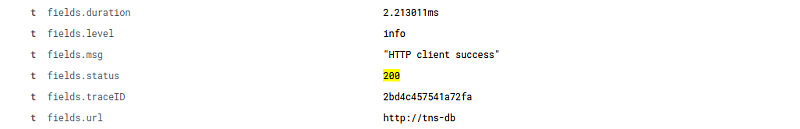
Obviously if you are using Elasticsearch as a logging backend, you have probably already figured out how to extract values from your logs and expose them as fields. So go with whatever is already working for you!
Final thoughts
Tempo is a fantastic new tool for mass trace ingestion, but it relies on external sources for trace discovery. In past posts, we looked at using Loki and exemplars, but we also know that Elasticsearch is an extremely common logging backend.
Hopefully those who prefer Elastic for logs can use the example and information here to set up their own logs-to-traces flows and begin discovering traces!
You can get free open-beta access to Tempo on Grafana Cloud. We have new free and paid Grafana Cloud plans to suit every use case — sign up for free now.
Share your feedback in the Grafana Slack #tempo channel or the tempo-users Google group, and let us know if there are other Tempo how-tos or tutorials you’d like to see. Be sure to watch our ObservabilityCon session, “Tracing made simple with Grafana,” on demand for a deep dive into Tempo.

