Grafana 7.3 released: Support for the Grafana Tempo tracing system, new color palettes, live updates for dashboard viewers, and more
Grafana v7.3 has been released!
With Grafana 7.0, we rounded out our observability story by making tracing a first-class citizen in Grafana alongside metrics and logs. That release included integrations with Jaeger and Zipkin, and earlier this month, we announced our integration with AWS X-Ray. At ObservabilityCON on Monday, we announced Grafana Tempo, our new open source distributed tracing system. Tempo is massively scalable, cost-effective, and easy to operate.
We’ve built Grafana into an open, composable observability platform that allows you to pick the data sources that work for your needs. But we also have our curated, preferred observability stack — Grafana, Prometheus, Loki, and now Tempo — that powers our Grafana Cloud and Grafana Enterprise products, and can happily coexist with your other choices for metrics, logs, and tracing.
The big news in the 7.3 release is around support for Tempo. For a sneak peek of how Tempo uses exemplars and the workflow from traces to logs, check out this ObservabilityCON session “Tracing made simple with Grafana” on demand. For demos of 7.3, watch “Grafana: The open and composable observability platform” on demand.

There are some other great features in this release, too. Here are some highlights:
New color palettes for visualization
Grafana 7.3 offers new standardized color options to give you more control over how your visualizations are colored. In addition to the options of coloring by palettes or from thresholds, you can now choose continuous (gradient) color palettes. Grafana interprets the colors based on the min/max values, so for instance, you can turn a simple table panel into a heat map. These palettes are also theme-aware; they will adapt to light and dark themes according to what your viewer is using. It’s a feature we’ve wanted to offer for a long time. It’s nice to be able to keep your dashboards visually consistent.

For more information, refer to Color scheme in the Grafana documentation.
Short links
This community contribution (thank you, MisterSquishy!) enables you to generate shortened links when you want to share your dashboards, panels, or Explore queries. It is especially useful in Explore, where links can get very long.
Table improvements and new image cell mode
Previously, if content in a table panel was too big, it would be truncated. Now, the content of the entire cell is visible on hover. It’s a small but nice improvement to the user experience and accessibility.
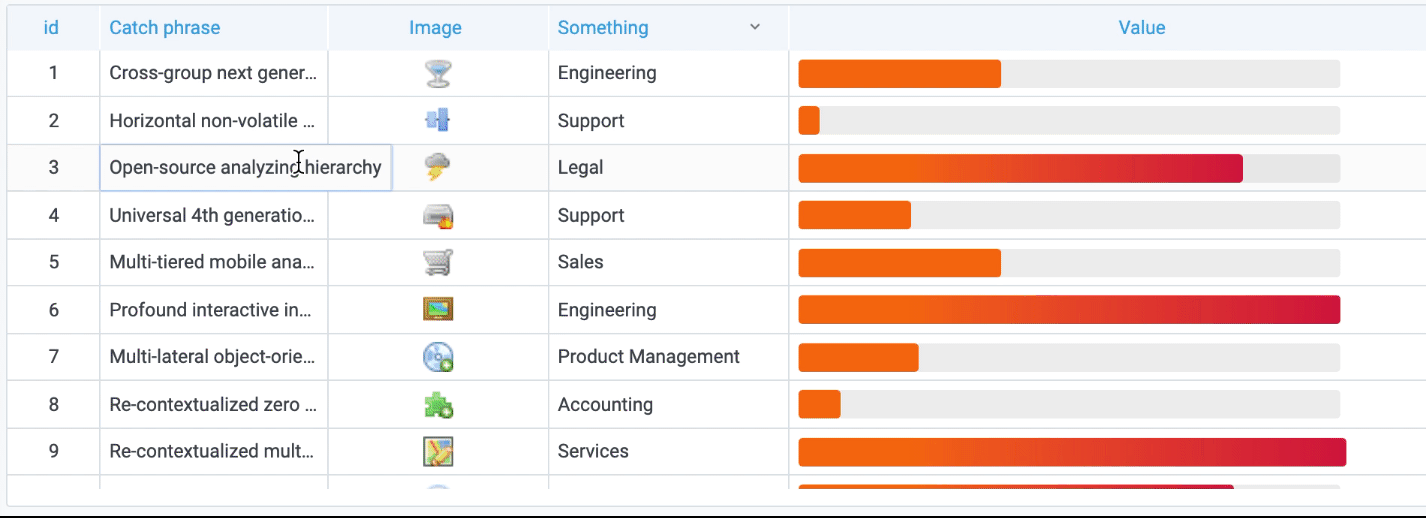
There’s also a new image cell display mode, as seen above. If a field value is an image URL or a base64 encoded image, you can configure the table to display it as an image.
New transformation: Concatenate fields
In combination with the reduce transformer improvements, Grafana will now support more robust display options. For example, assume your query returns two frames each with two fields:

You can now collapse each field into a single row using the new Reduce fields option:
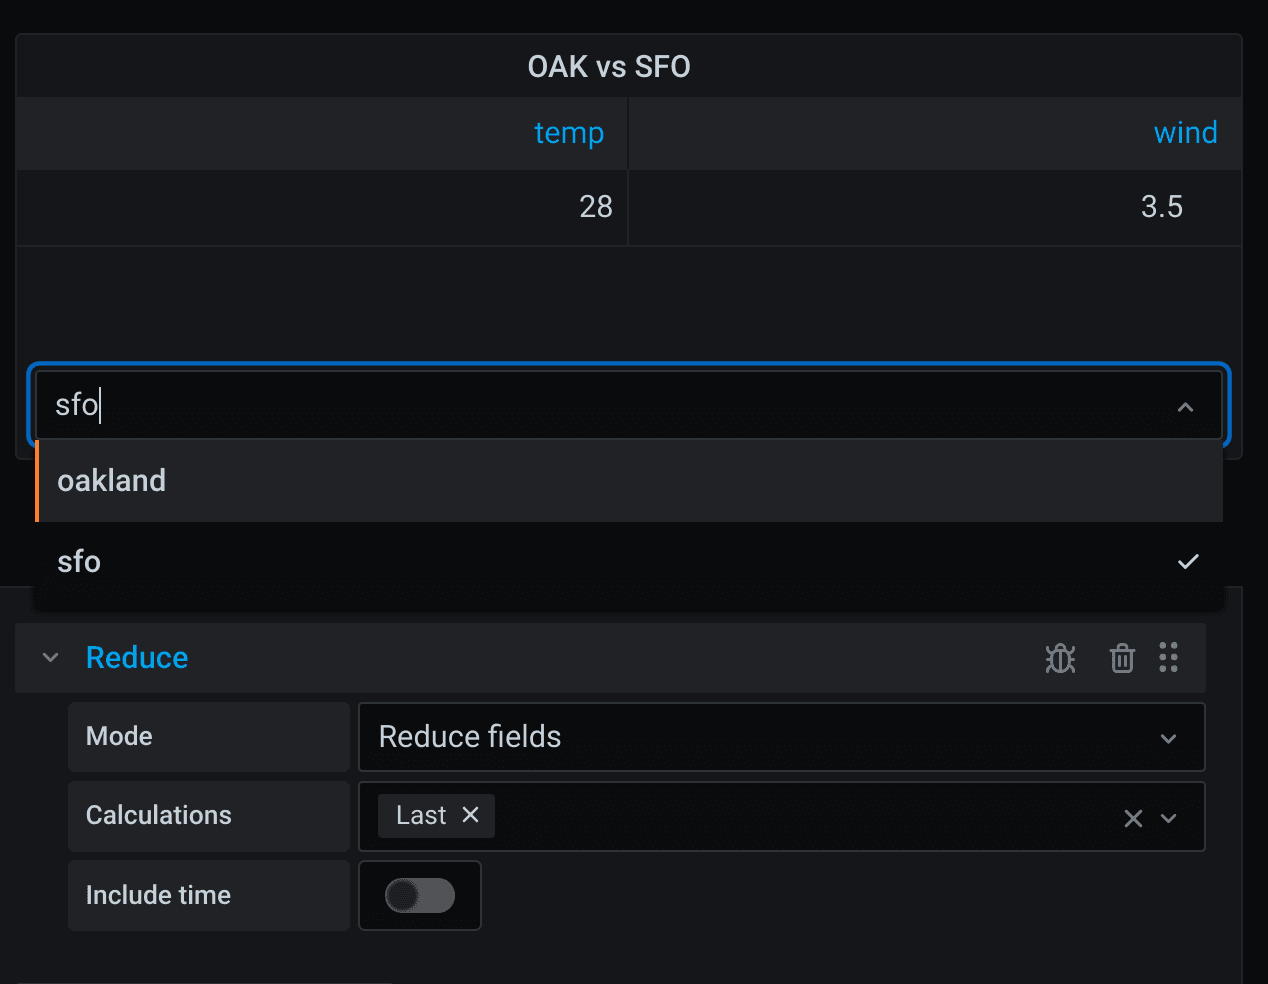
To access all values in a single frame, you can use the new Concatenate fields transformer to align the fields in a single frame:

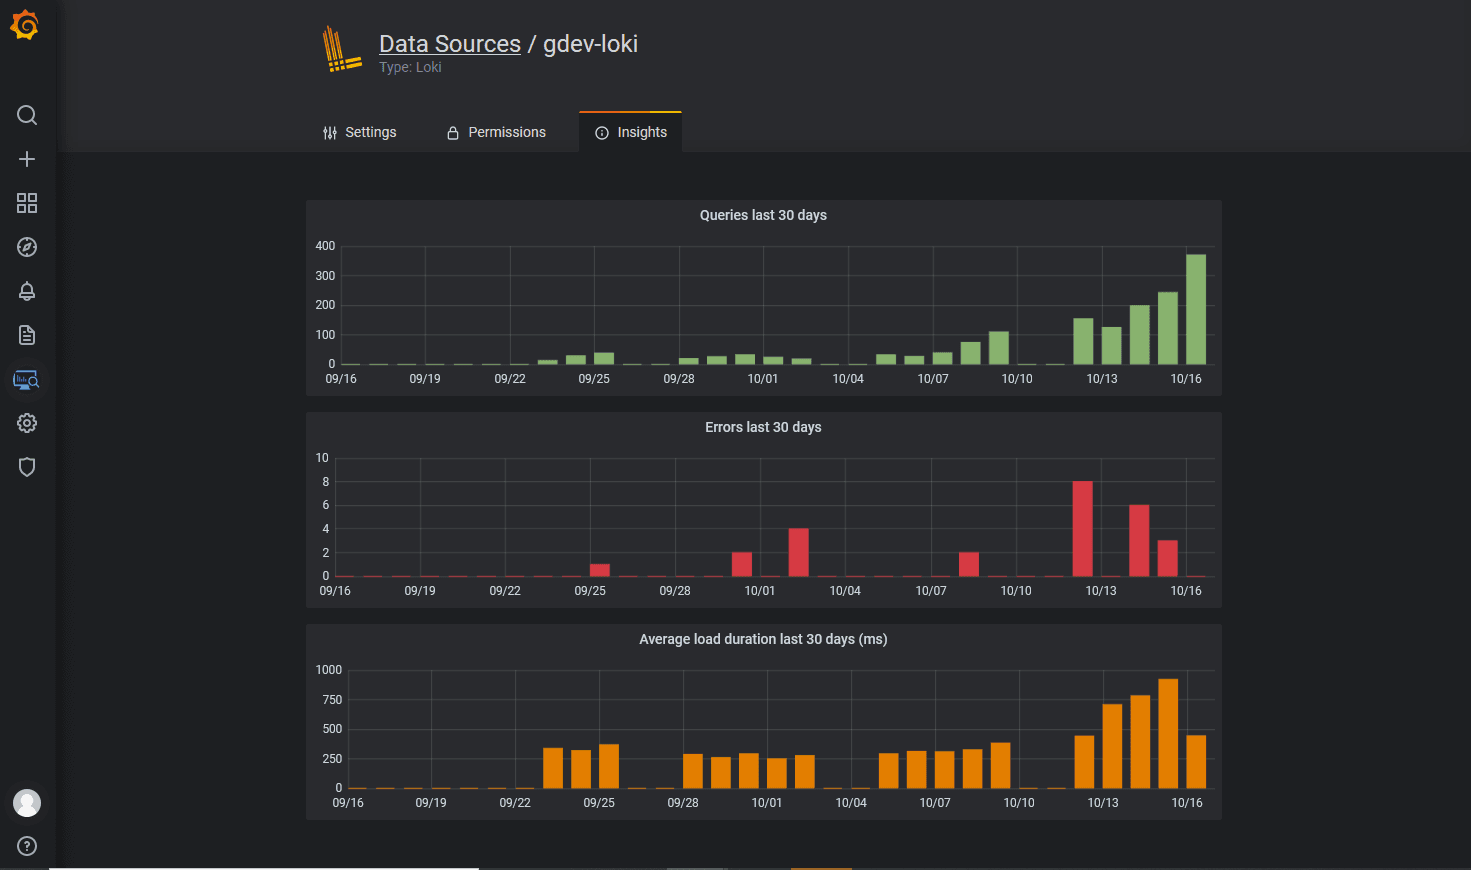
Data source usage insights in Grafana Enterprise
This feature, which is available for customers with a license to Grafana Enterprise, allows you to track a data source’s query duration, query count, and error count so that you can better understand how it’s being used within your organization. That way, you can make any changes necessary to keep the data source reliable and useful for your team. More information can be found in the docs.
Auditing in Grafana Enterprise
Audit logs allow you to track user actions in your Grafana instance, which may have sensitive information in logs and metrics. Using this Enterprise feature, you can more easily find and mitigate suspicious activity and meet compliance requirements. Read the docs for more information.

Sigv4 authentication for AWS users
If you’re using AWS Elasticsearch, you’ll want to know that this release enables Sigv4 authentication, AWS’s de facto request signing process. With Grafana 7.3, you can now configure your Elasticsearch data source to access your Amazon Elasticsearch Service cluster directly from Grafana. For more details, please refer to the Elasticsearch docs.

Multiple pipeline aggregations in Elasticsearch
A community contribution from simianhacker, this power-user feature allows you to chain multiple pipeline aggregations together and use the results of one pipeline aggregation in the results of another. For example, users are now able to perform second-order derivatives on their metrics by chaining two derivatives.
Assuming you are monitoring RAM usage on your server, this enables you to have an insight on how much memory is being allocated per second (first-order derivative) and at which rate this allocation speed changes (acceleration, second-order derivative).
CSV exports for Excel
In v7.0, we introduced a new table panel and inspect mode with Download CSV enabled. However, CSV export to Excel was removed. As it turns out, Grafana users love their Excel! After many requests, this community contribution from tomdaly brought it back.
For more information, refer to Download raw query results as CSV in the Grafana documentation.
Plugin signing
Starting with the 7.0 release, Grafana incorporated the ability to verify that backend plugins are signed before loading them, thus giving users the assurance that they are not running unverified code on their server. For Grafana plugin authors, please be aware that in the near future, we will require all plugins to be signed.
Live updates broadcast to dashboards
And last but definitely not least, this cool new feature is behind a feature flag in 7.3, but we’re excited to give you a preview. The Live feature allows you to broadcast any updates to your dashboard to everyone looking at that dashboard. You just have to save your dashboard, and everyone sees the update automatically. If viewers are in edit mode, or have local edits, they see a popup that prompts them to either continue editing or discard local changes to see the updated dashboard.
Changelog
Check out CHANGELOG.md for a complete list of new features, changes, and bug fixes.
Upgrade Grafana
Download or try Grafana 7.3 in the cloud today.
Refer to Upgrading for more information about upgrading your Grafana installation.
Interested in getting started with Grafana? Watch this webinar for a demo of the user interface and setup.
Thanks
A big thanks to all the Grafana users who contributed by submitting PRs, bug reports, and feedback!