

Loki 2.0 released: Transform logs as you’re querying them, and set up alerts within Loki
It’s been just about a year since Loki’s 1.0 GA release, and during this time we’ve seen a big uptick in adoption, with enterprises like Grofers and Paytm Insider using Loki in both Grafana’s hosted offering and on premise. In that time we’ve made big gains for improving performance through parallelization and query optimization. In the most recent release, 1.6.0, we continued to refactor code for more performance as well as add small new features to the query language such as binary operations.
The operational benefits of Loki’s small index have been tremendous. Anyone who uses Loki quickly realizes the advantages Loki brings to the table. However, that small index and small labelset crucial for Loki’s performance imposed limitations on what was possible in queries, and we don’t like limitations.
This is why we set out to improve Loki in a significant way, and why we are extremely excited to announce the release of Loki 2.0. With Loki 2.0, we unlock a whole new set of query language features that enable extraction of labels at query time, removing previous limitations.
Now we can have the best of both worlds: a small set of labels to index logs during ingestion, combined with a comprehensive query language that lets you extract more labels at query time to allow for query possibilities only limited by your imagination!
Let’s dig right into the new features!
Extract labels from log lines at query time
Let’s check out the new query language additions in 2.0!
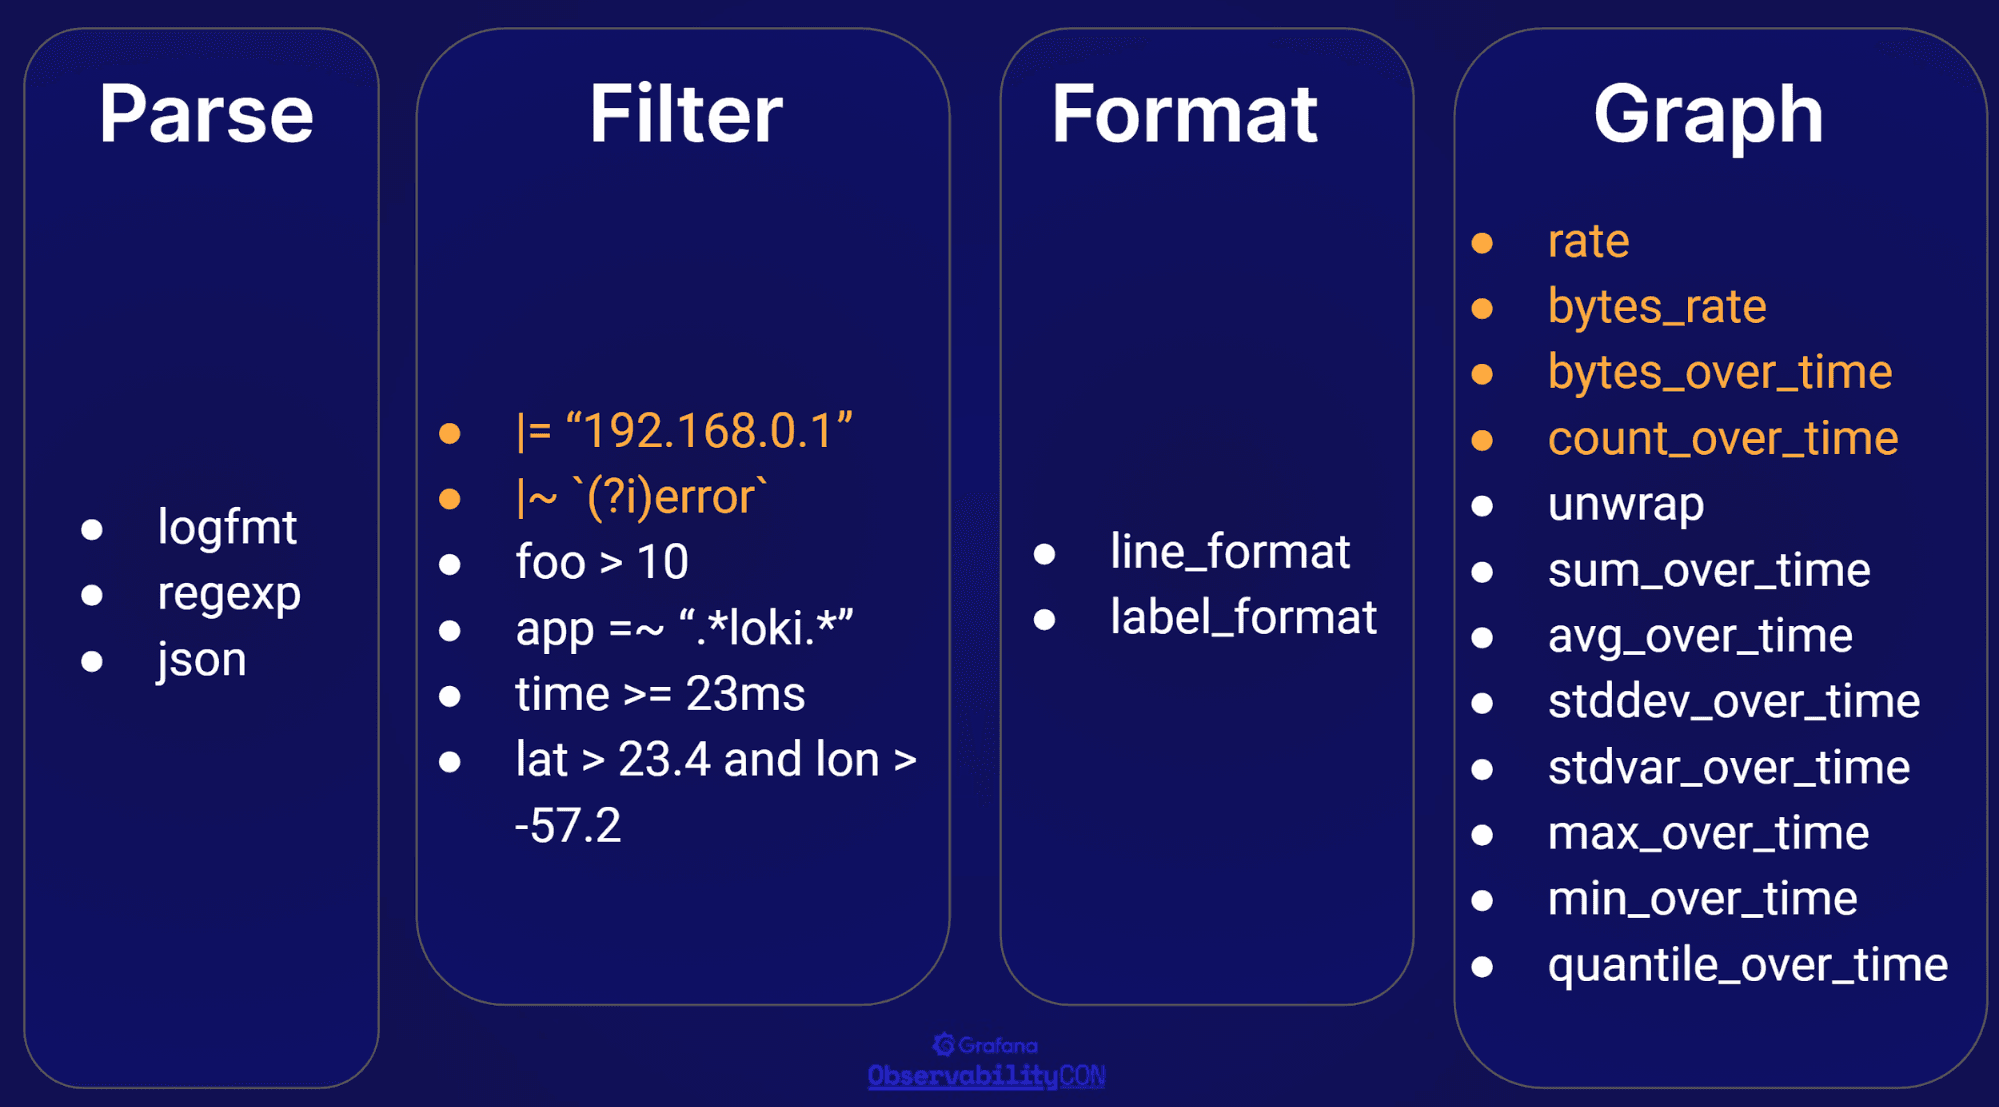
Things in orange you should already be familiar with. Filtering on log content with |=!=|~ and !~, and converting your logs into metrics with rate and count_over_time were available in Loki 1.x. Everything else in white is new in 2.0, and I think it might be best to show how this works with examples, so here we go!
Parse
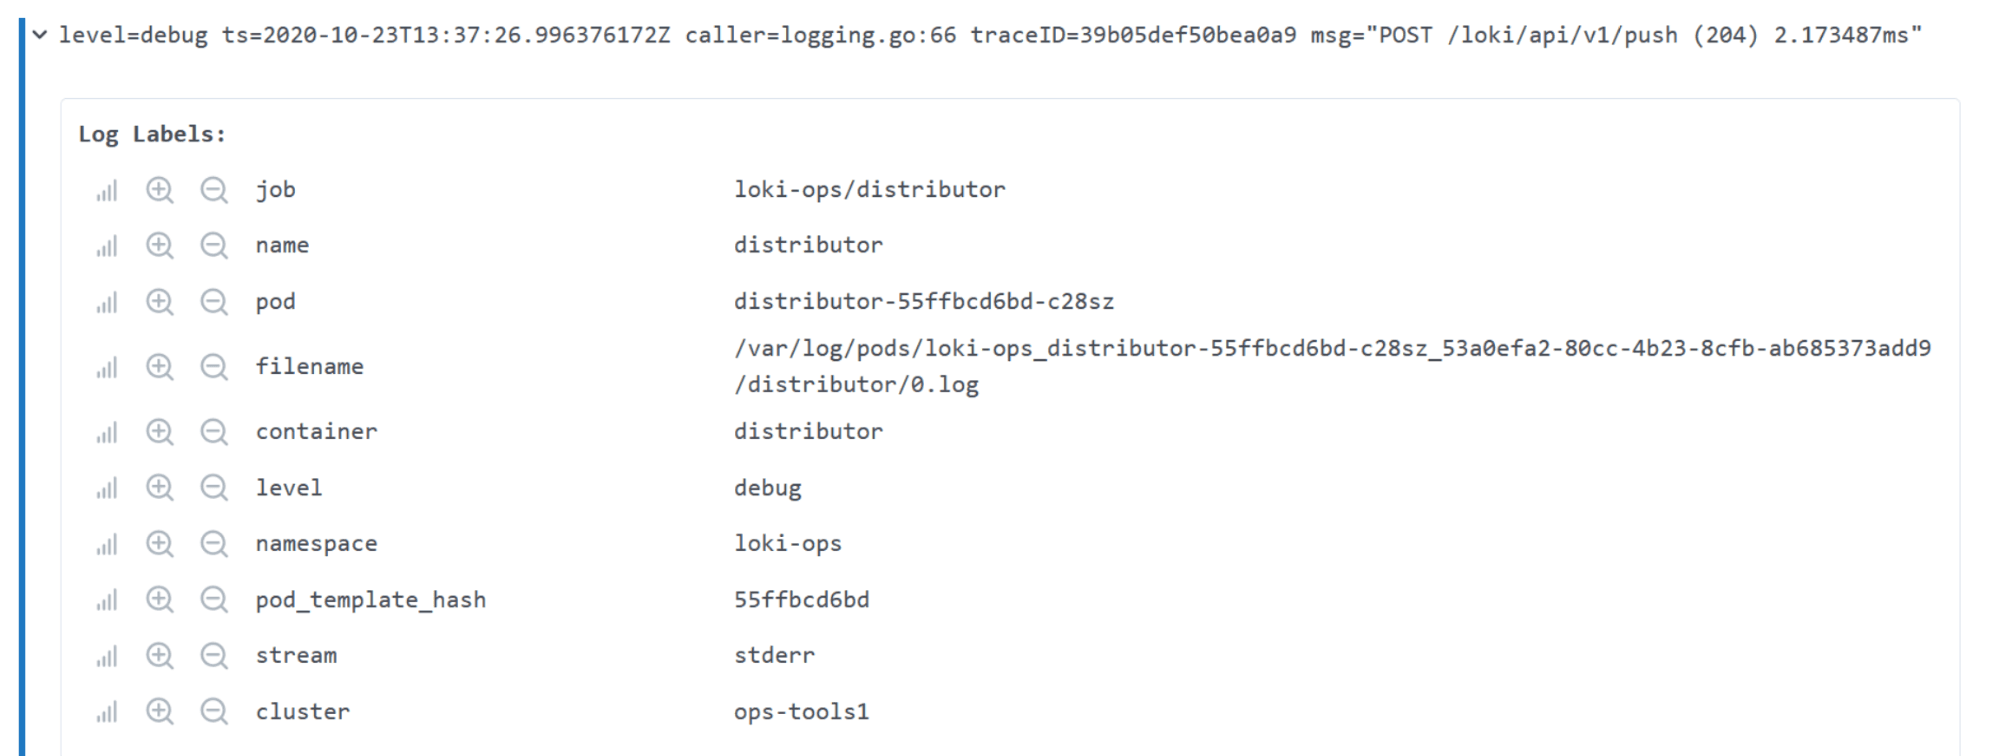
This is where we start: how we extract labels at query time. For an example, let’s look at a Loki distributor log:

And look at the labels that were returned:
Now let’s make one simple change to the query that returned this log:

But now when we look at the labels…
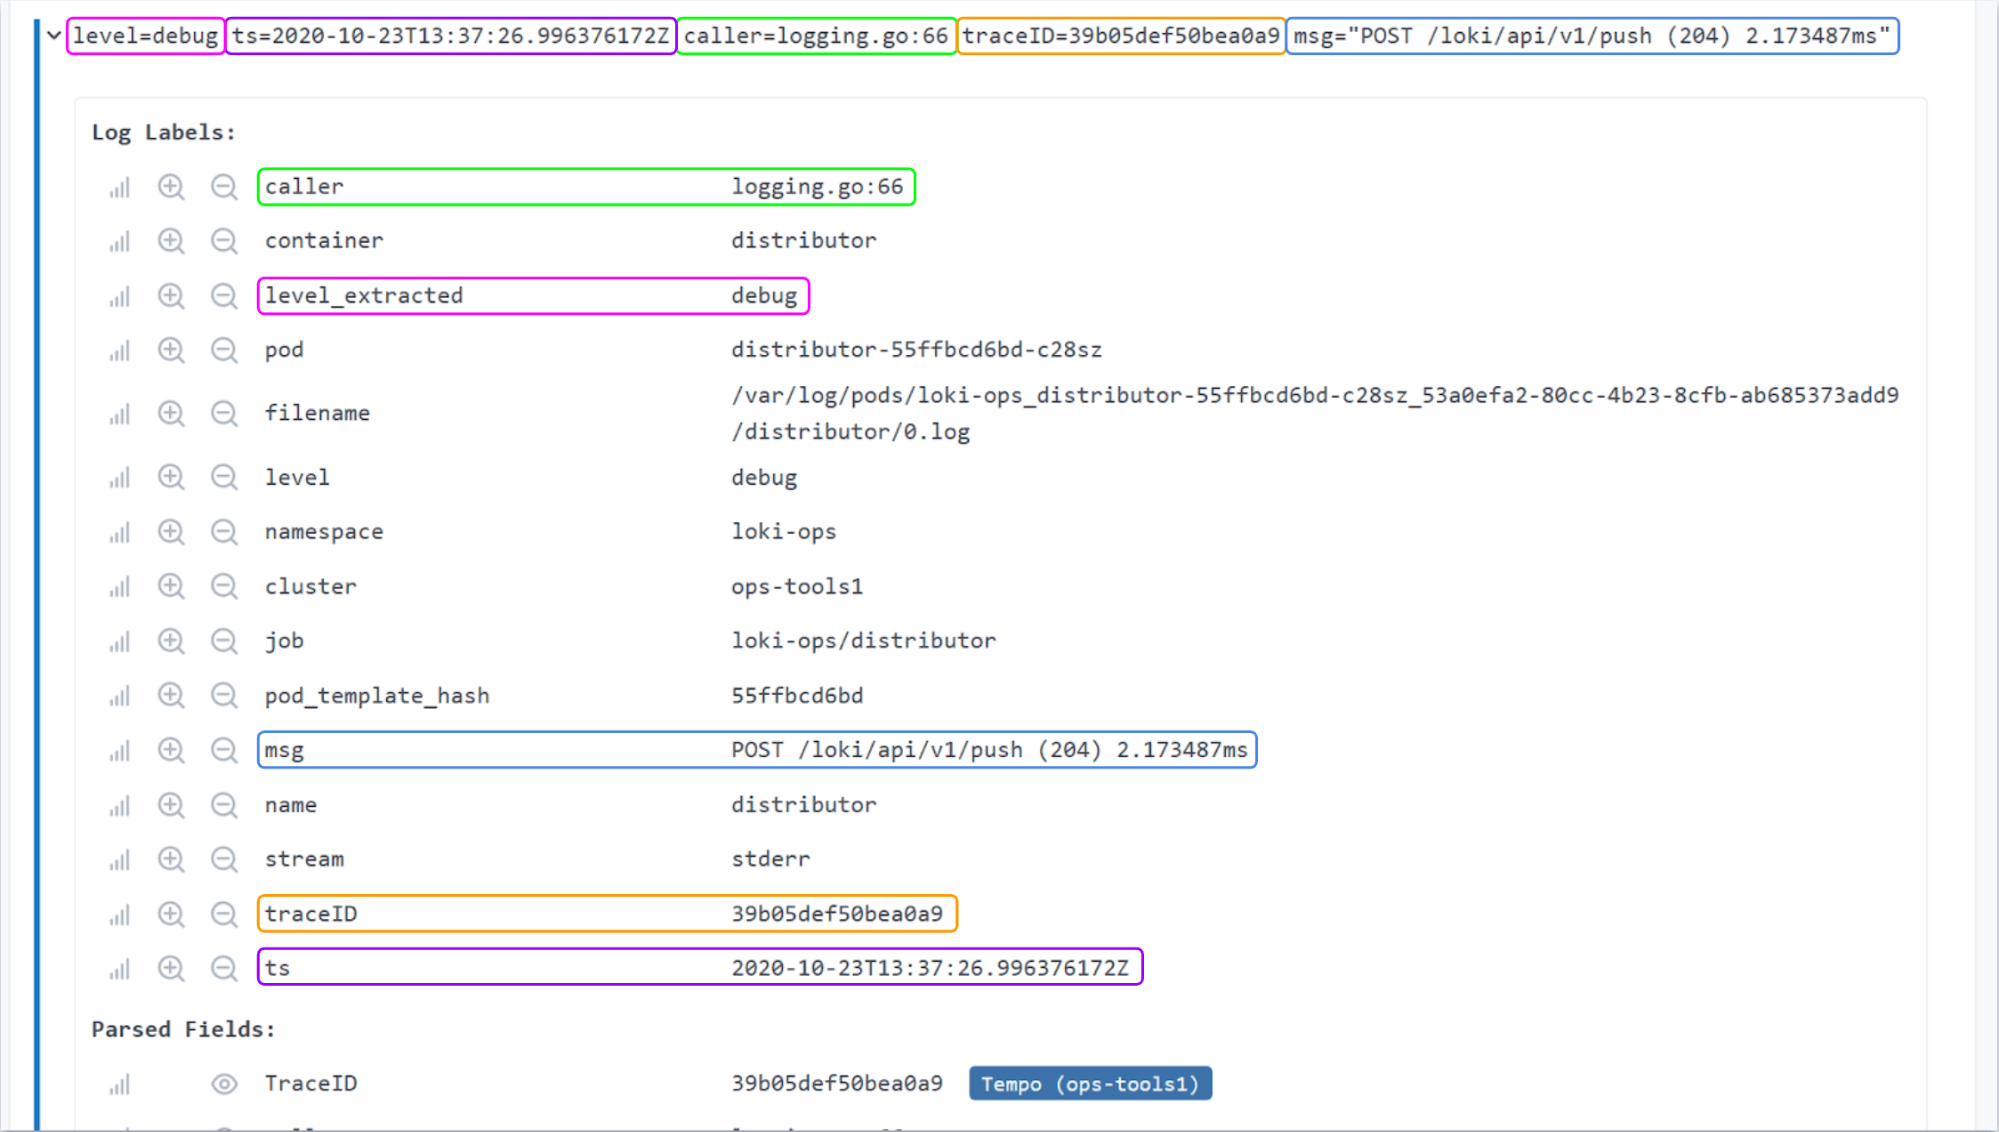
Just like that, every key=value pair of this logfmt formatted log line has become a label!
Not using logfmt?? No worries, we have you covered.
Regex:
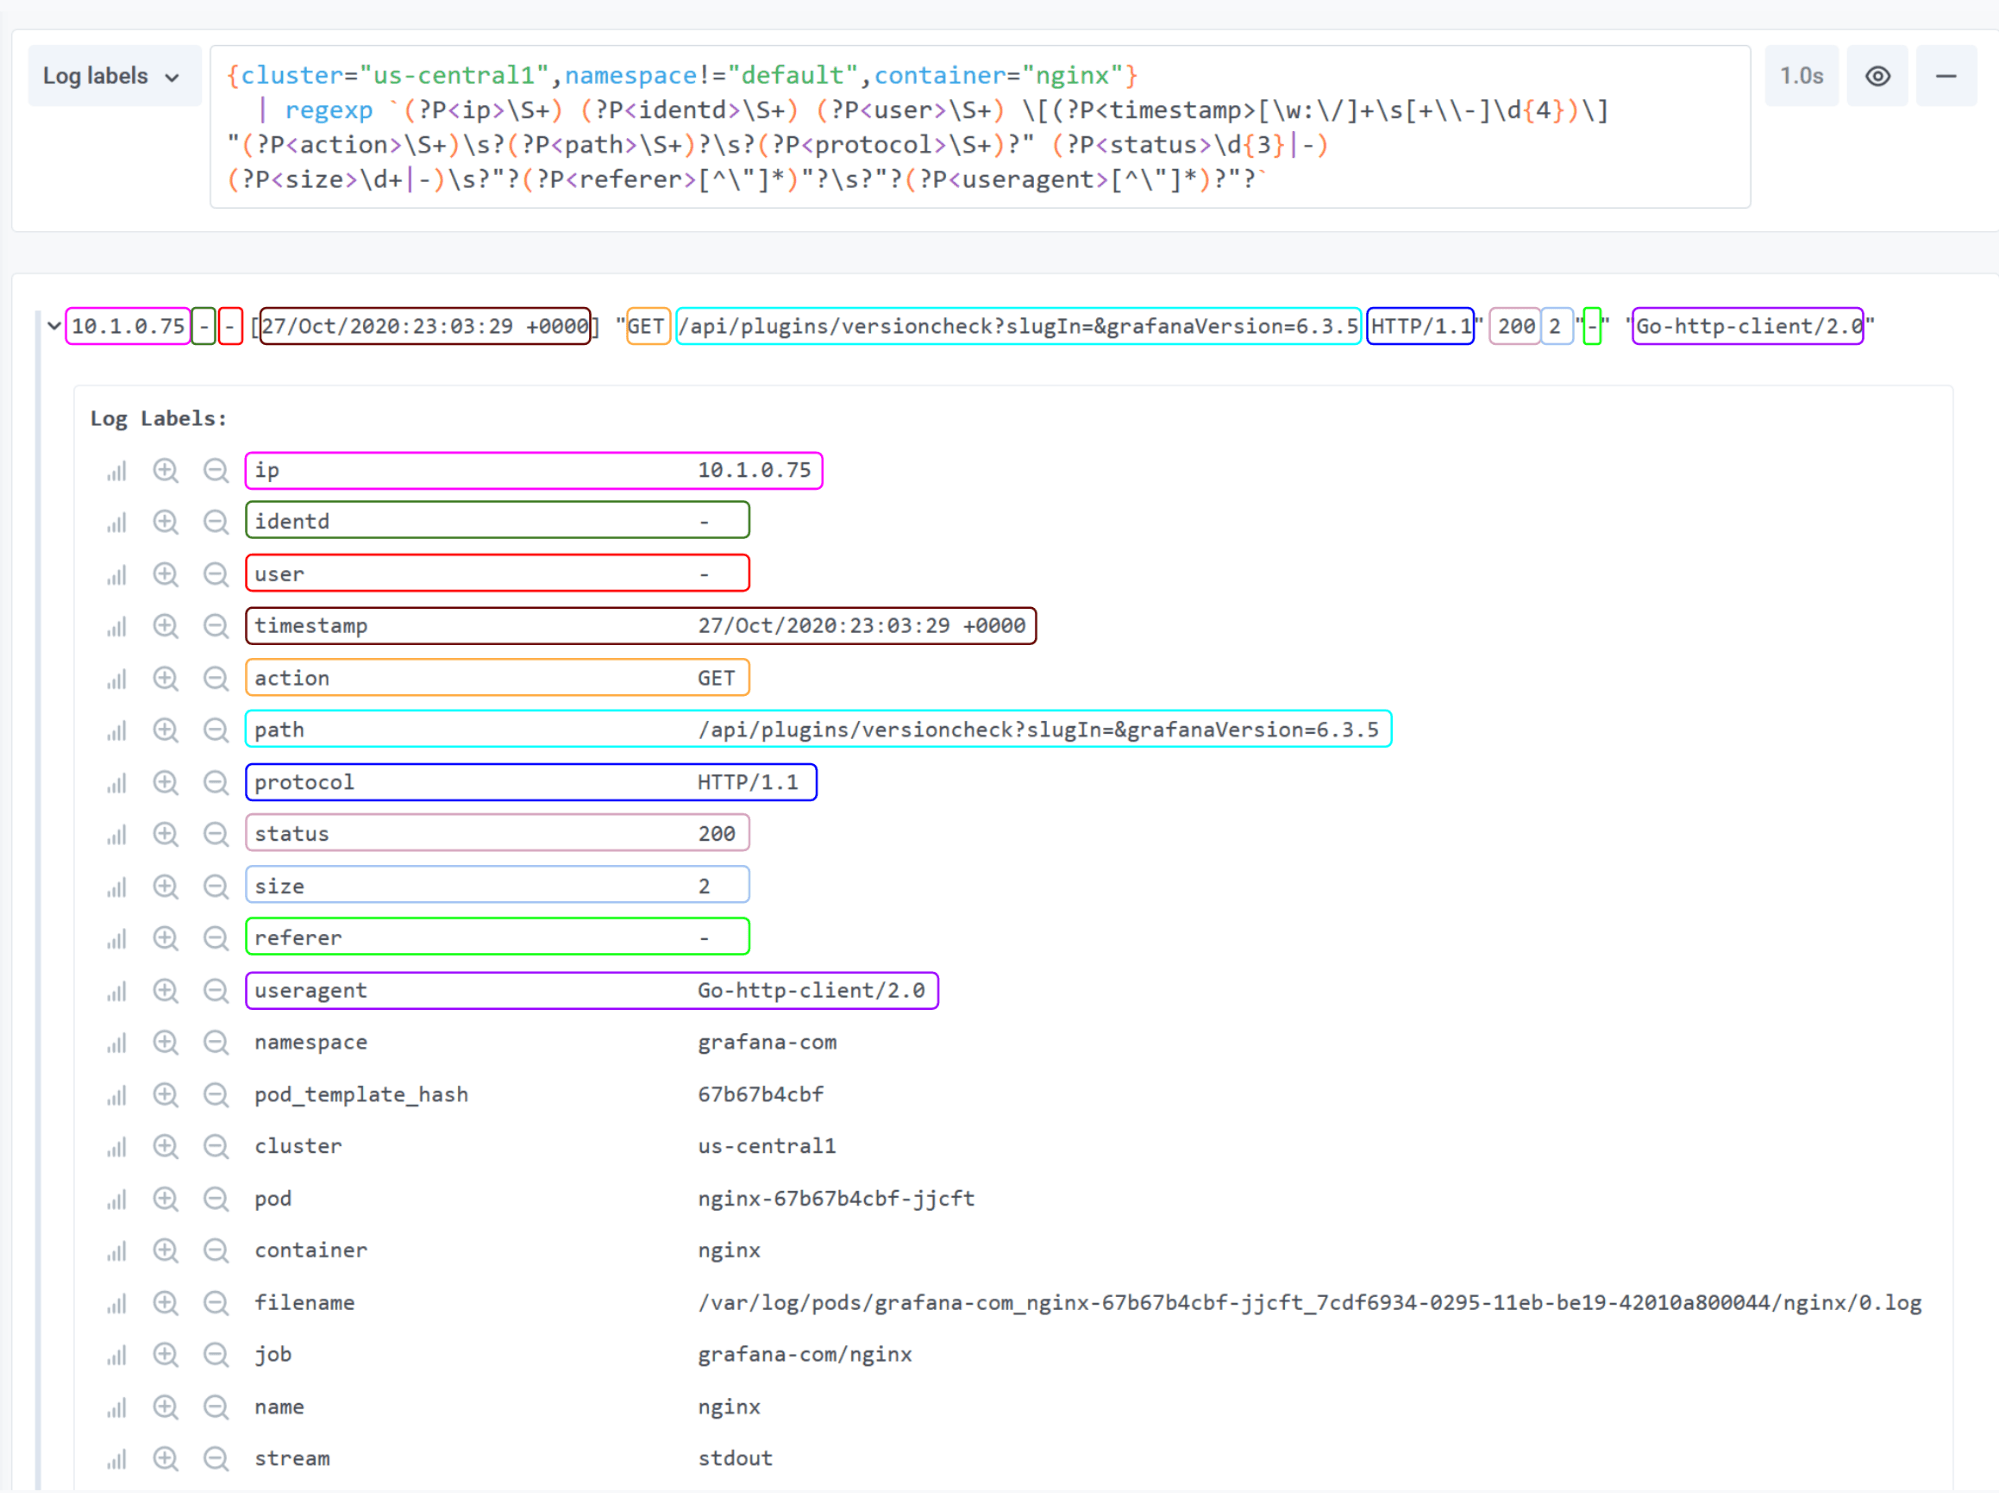
JSON:
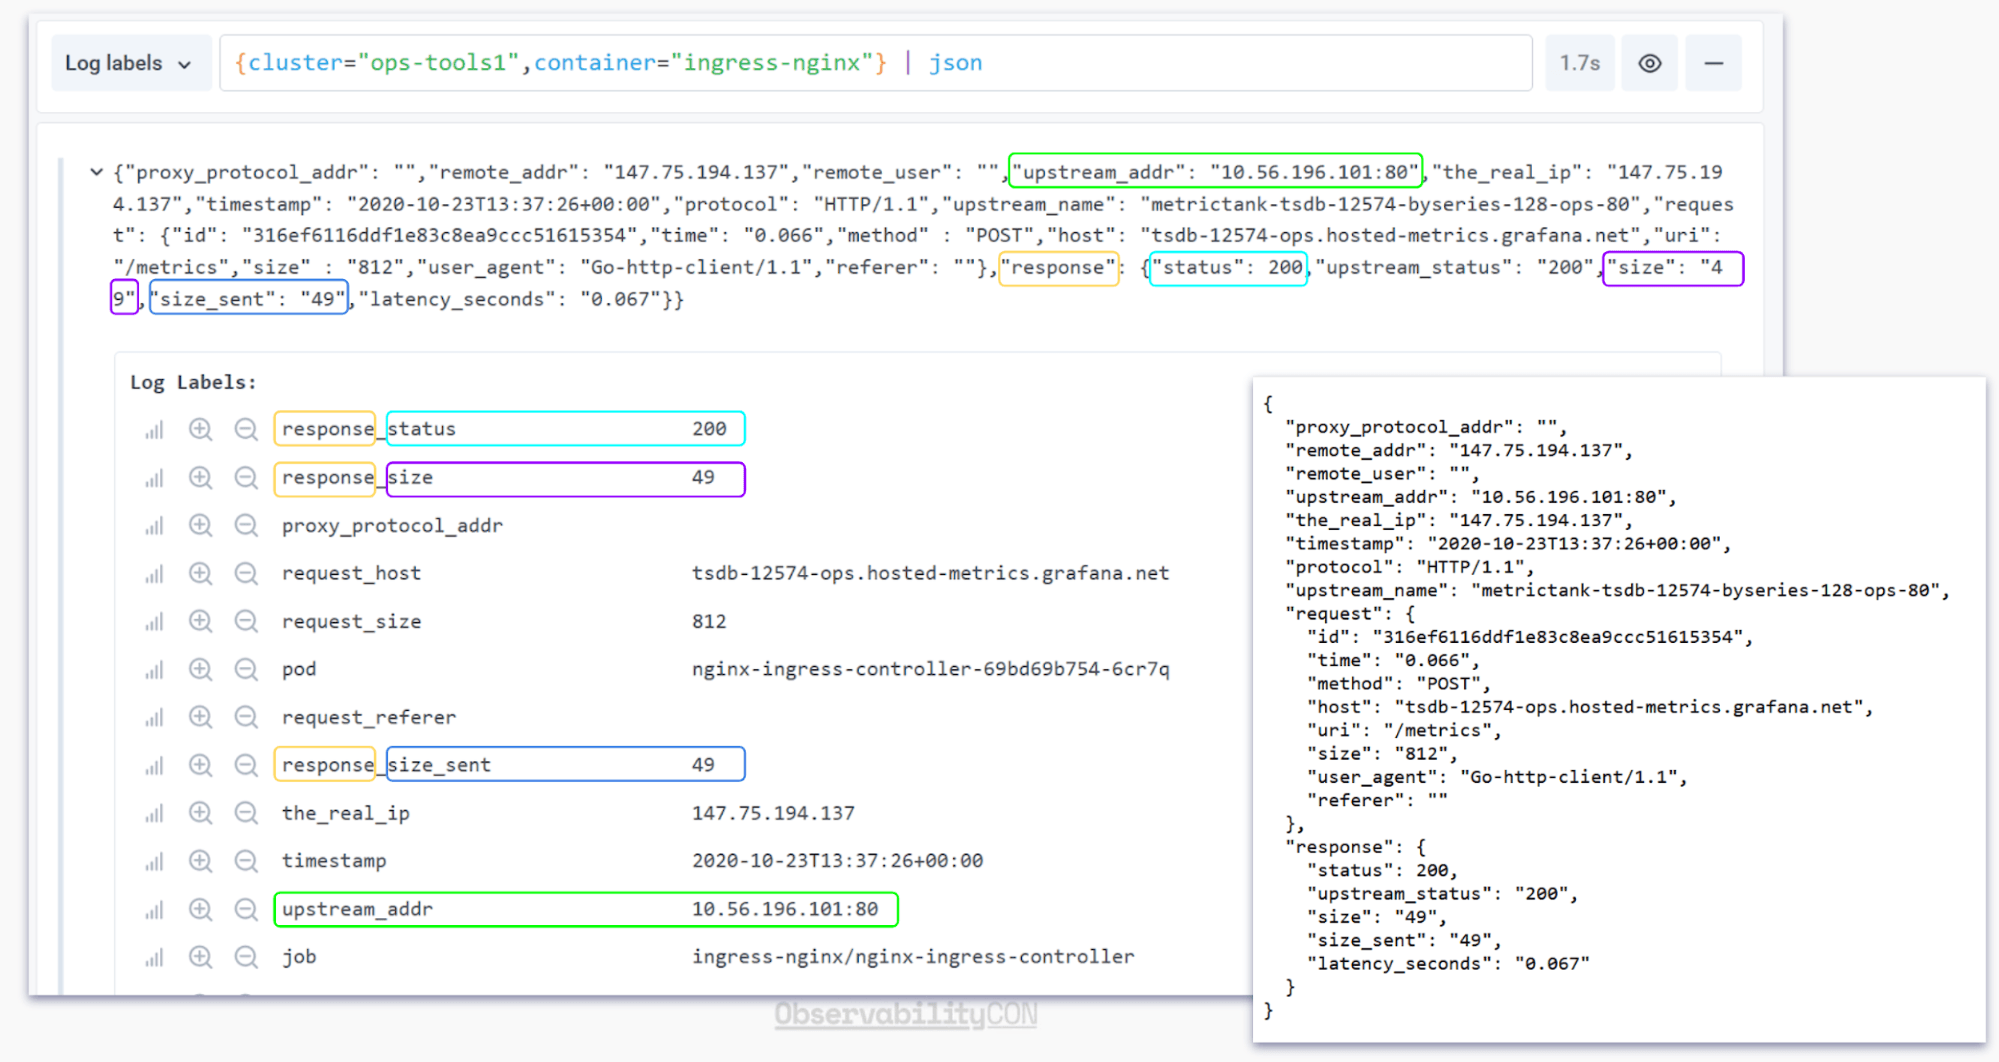
Note: For JSON we are flattening nested objects using underscores to combine elements; look at the
responseobject in the picture. We plan to further extend JSON processing capabilities in the future, but that entails a language of its own, so for now we have gone with a more simplistic approach.
This covers step 1, extracting your log content into query time labels. Now let’s look at what this enables.
Filter
Loki 2.0 introduces much more powerful filtering capabilities. Extending on the existing filter expressions, you can filter on the content you extracted with the parser stages. Let’s look at an example showing only the log lines where the extracted duration is longer than 1s and the query_type=filter:
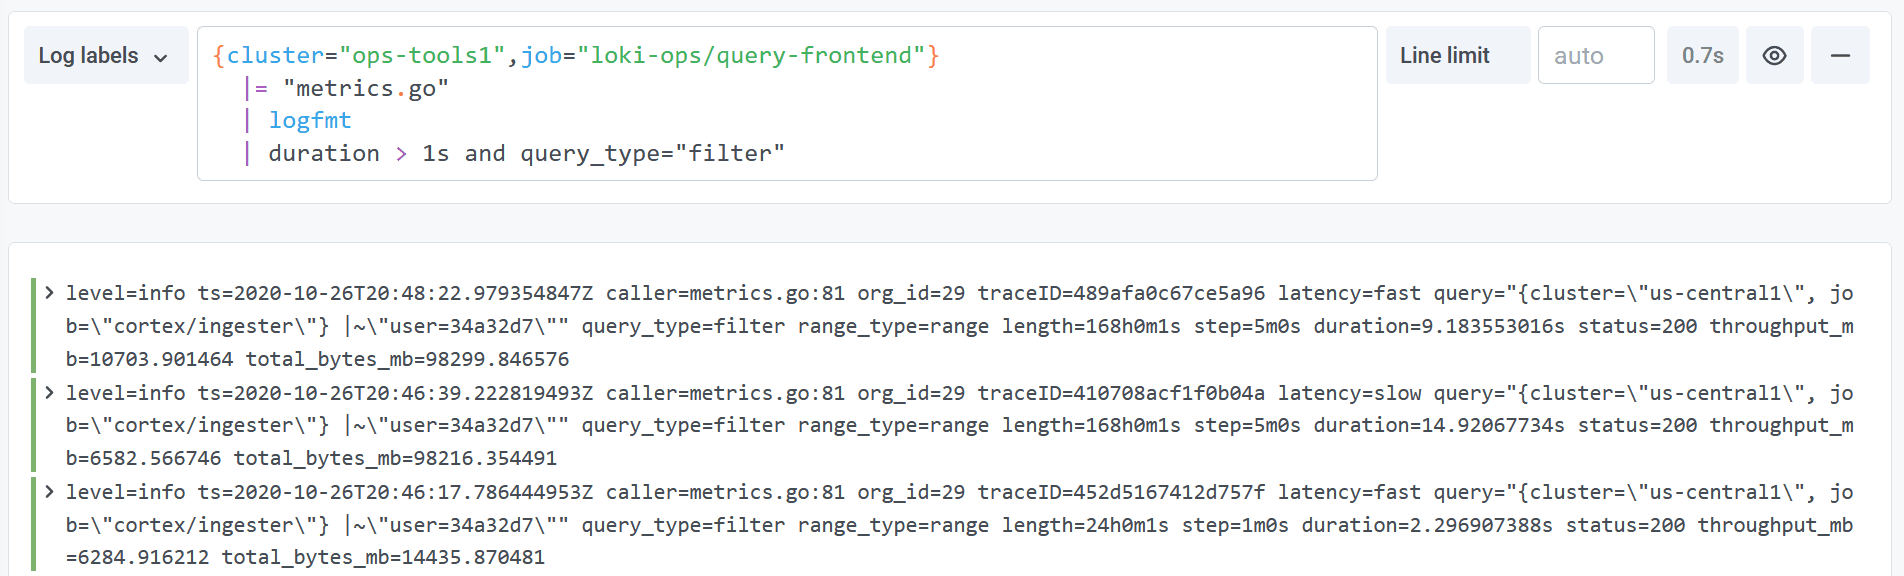
Notice here that Loki can be smart about inferring types of some contents, in this case parsing the Golang style duration of 1s.
Filters are also an important part of error handling in these new features. If something goes wrong with the processing of a line, Loki will assign a new label named __error__ with the name of the error. This can be used to either select the logs that had errors to understand why:
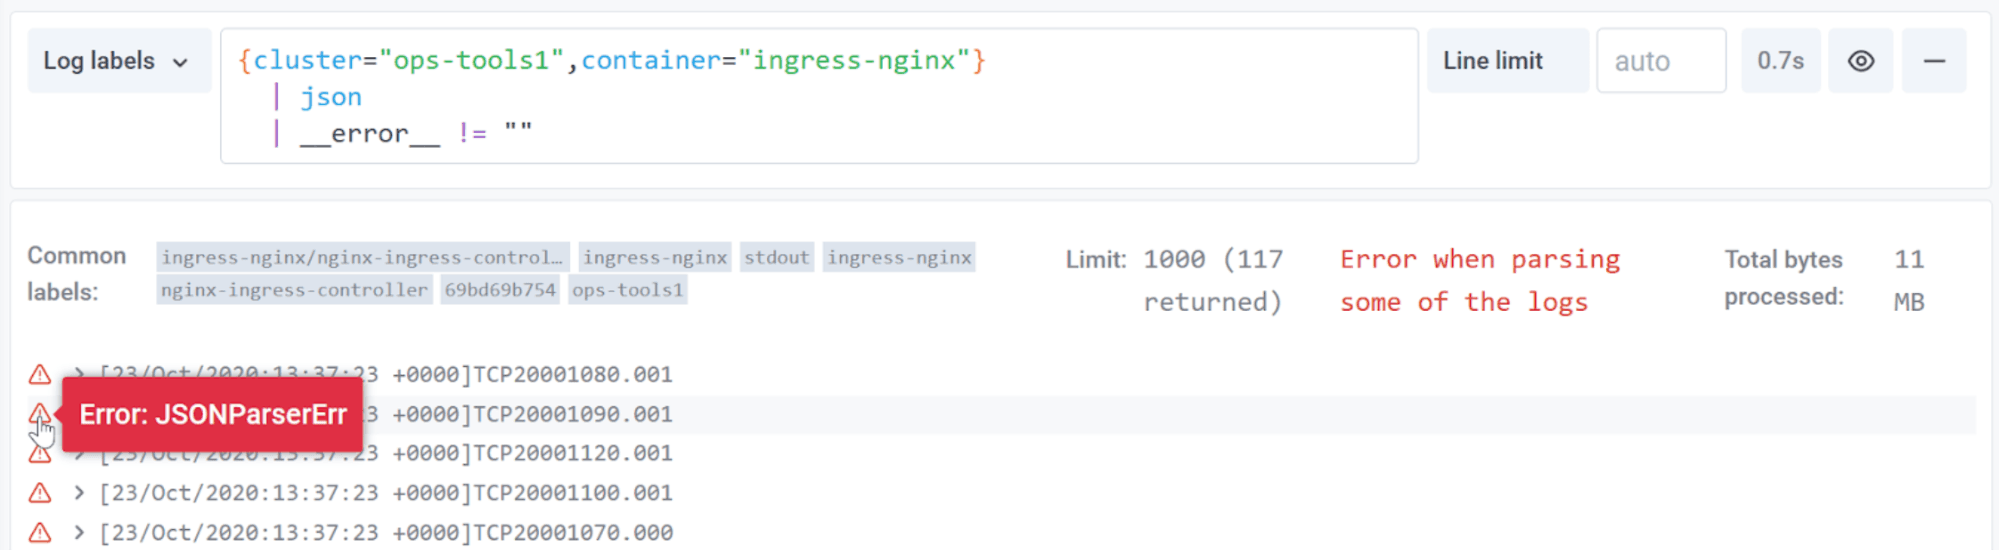
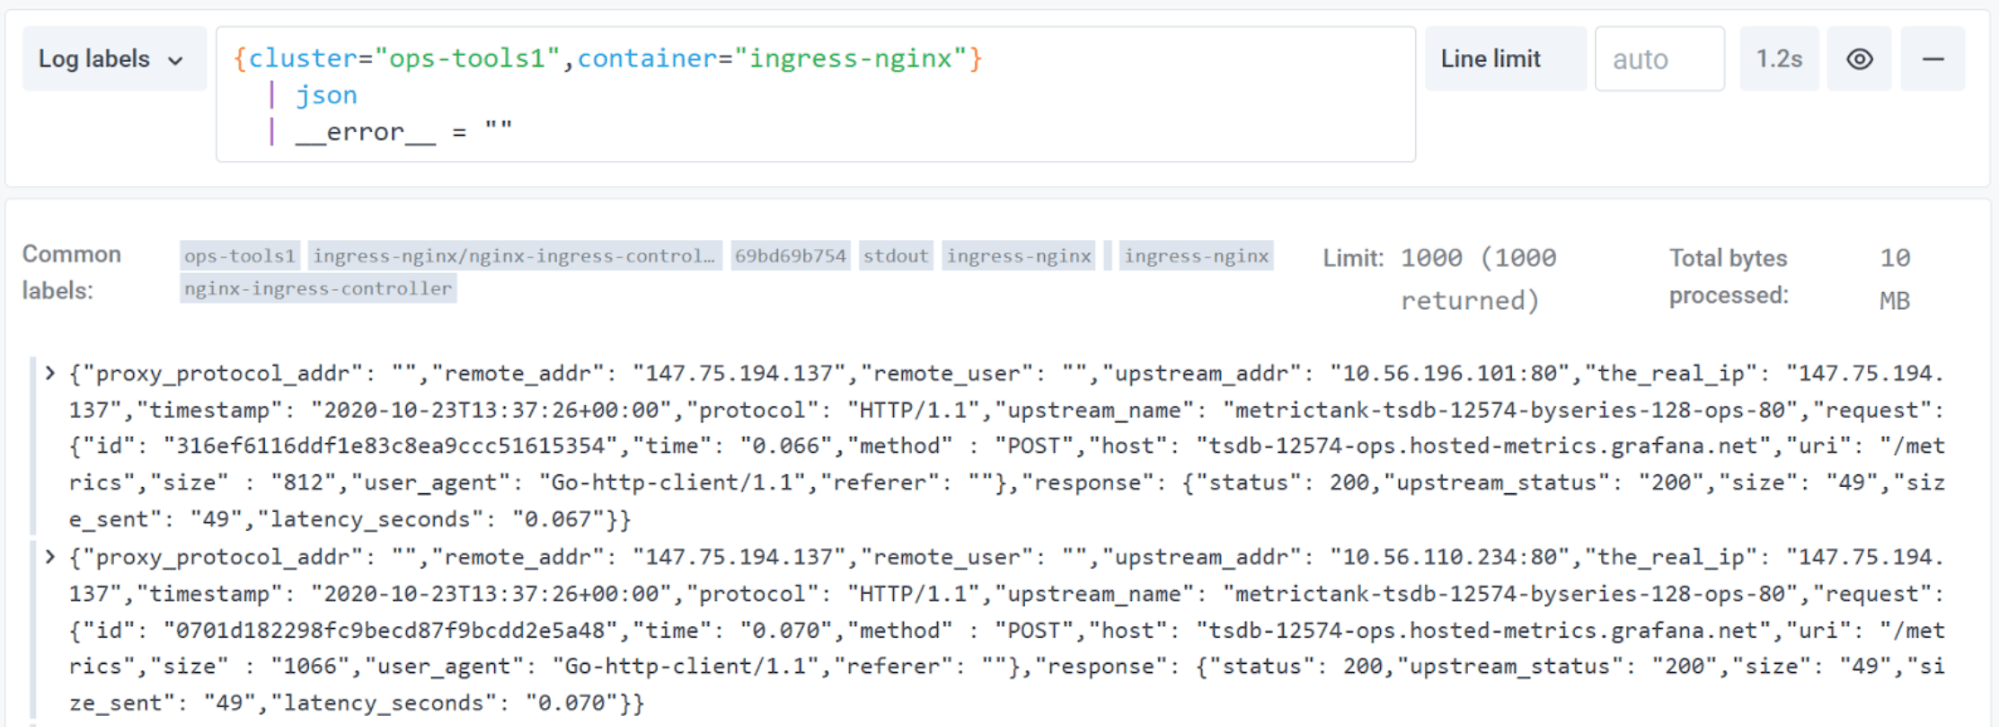
In this case, these lines are not JSON, so they failed to parse as JSON in the json stage. Once you know what the issue is, you can then choose to exclude these lines just as easily:
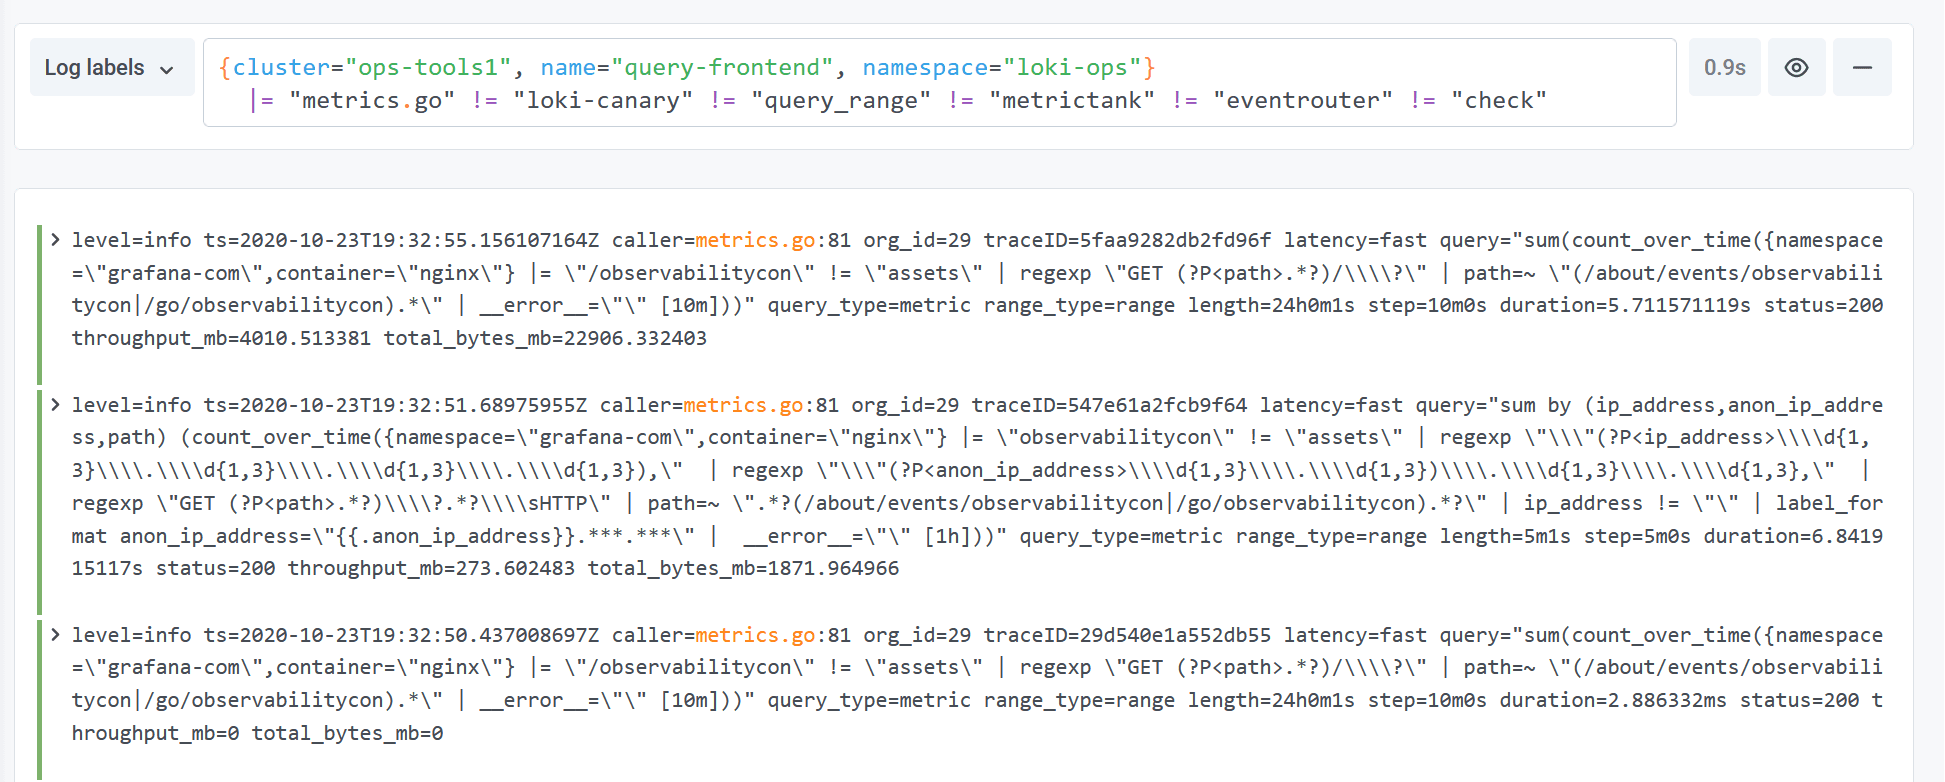
Format
Reducing strain on anyone viewing logs just got easier too. Loki 2.0 lets you re-write your log lines as they show up in the display and gives you the ability to take logs that look like this:
And turn them into this:
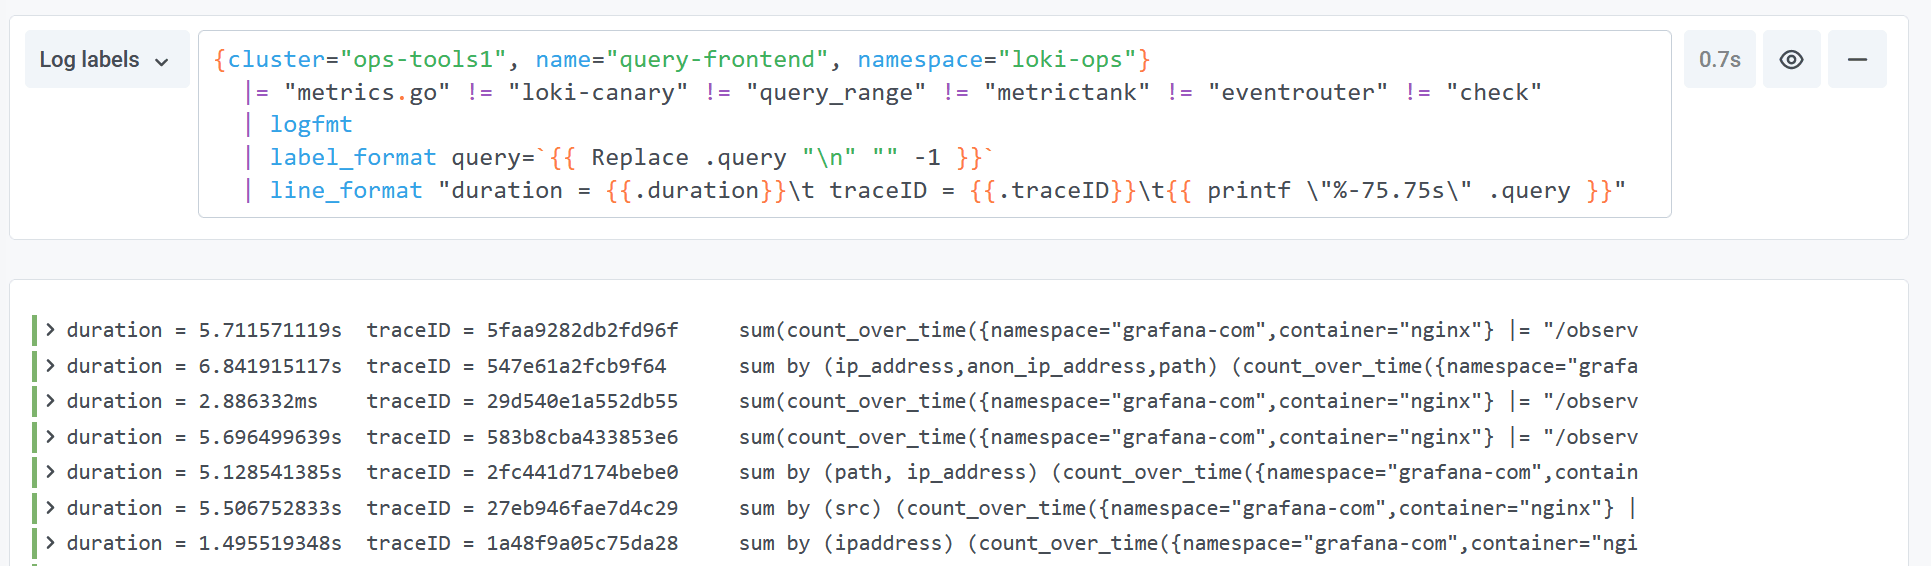
label_format and line_format leverage Golang’s templating syntax, letting you choose the relevant log lines to display. It also includes additional benefits like the ability to vertically align or truncate log contents.
Graph
Perhaps even more exciting than the new filtering capabilities is what you can do for visualizing your logs as metrics. Many new metric aggregation functions can take advantage of the unwrap stage, which will turn an extracted label into a time series sample, allowing it to be used in any of these functions:
- sum_over_time
- avg_over_time
- stddev_over_time
- stdvar_over_time
- max_over_time
- min_over_time
- quantile_over_time
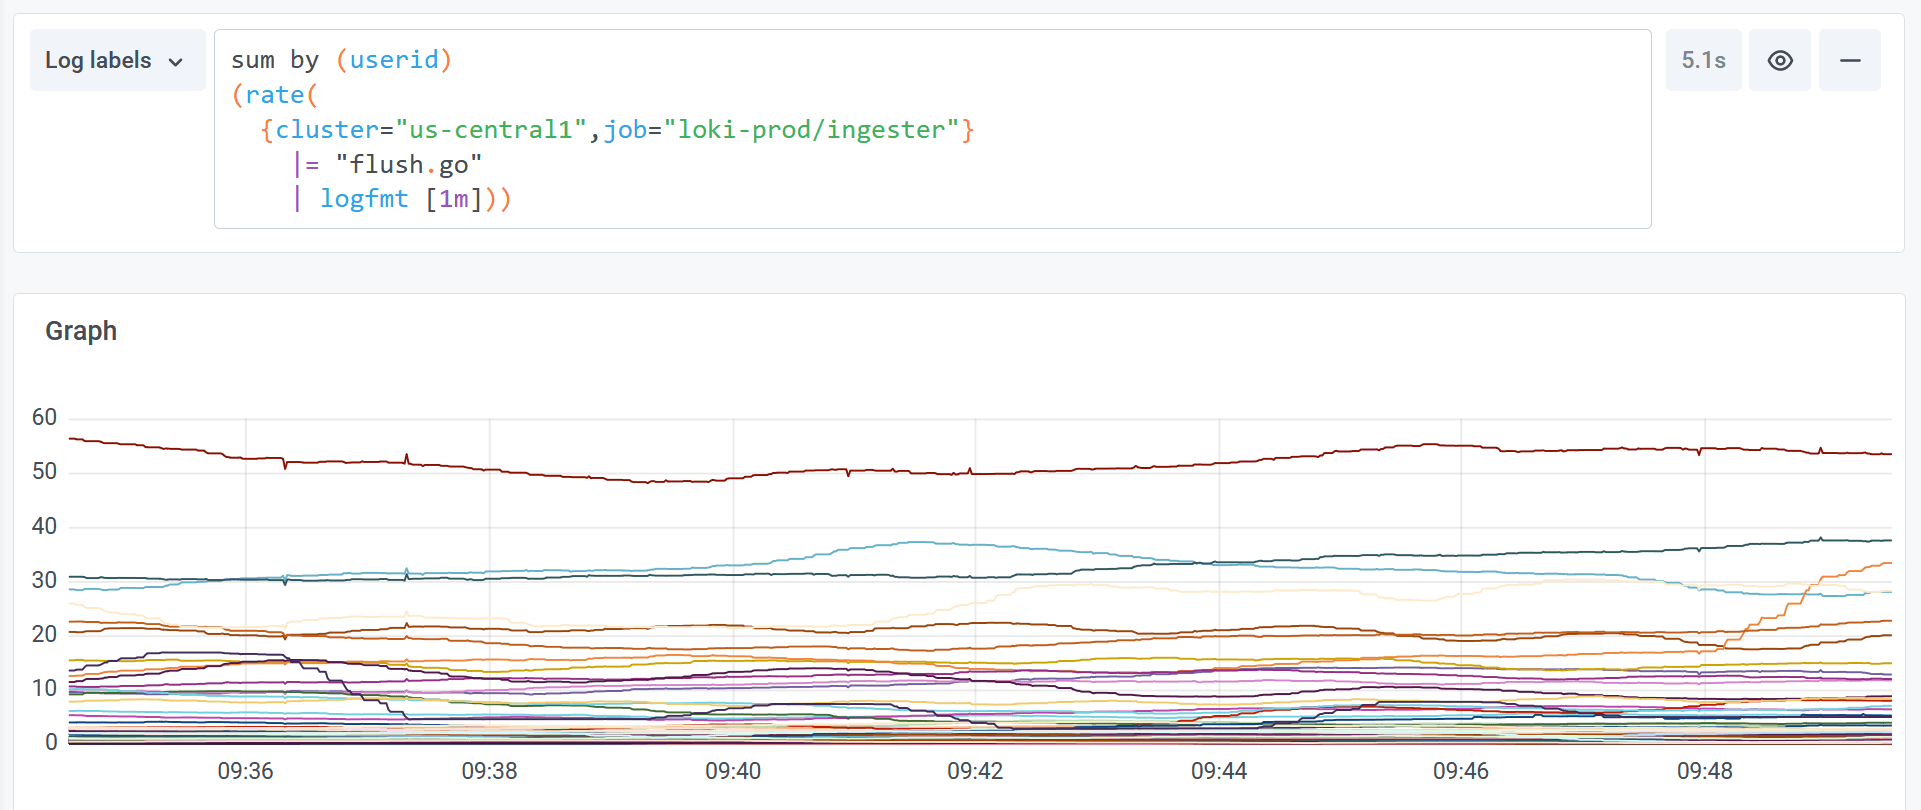
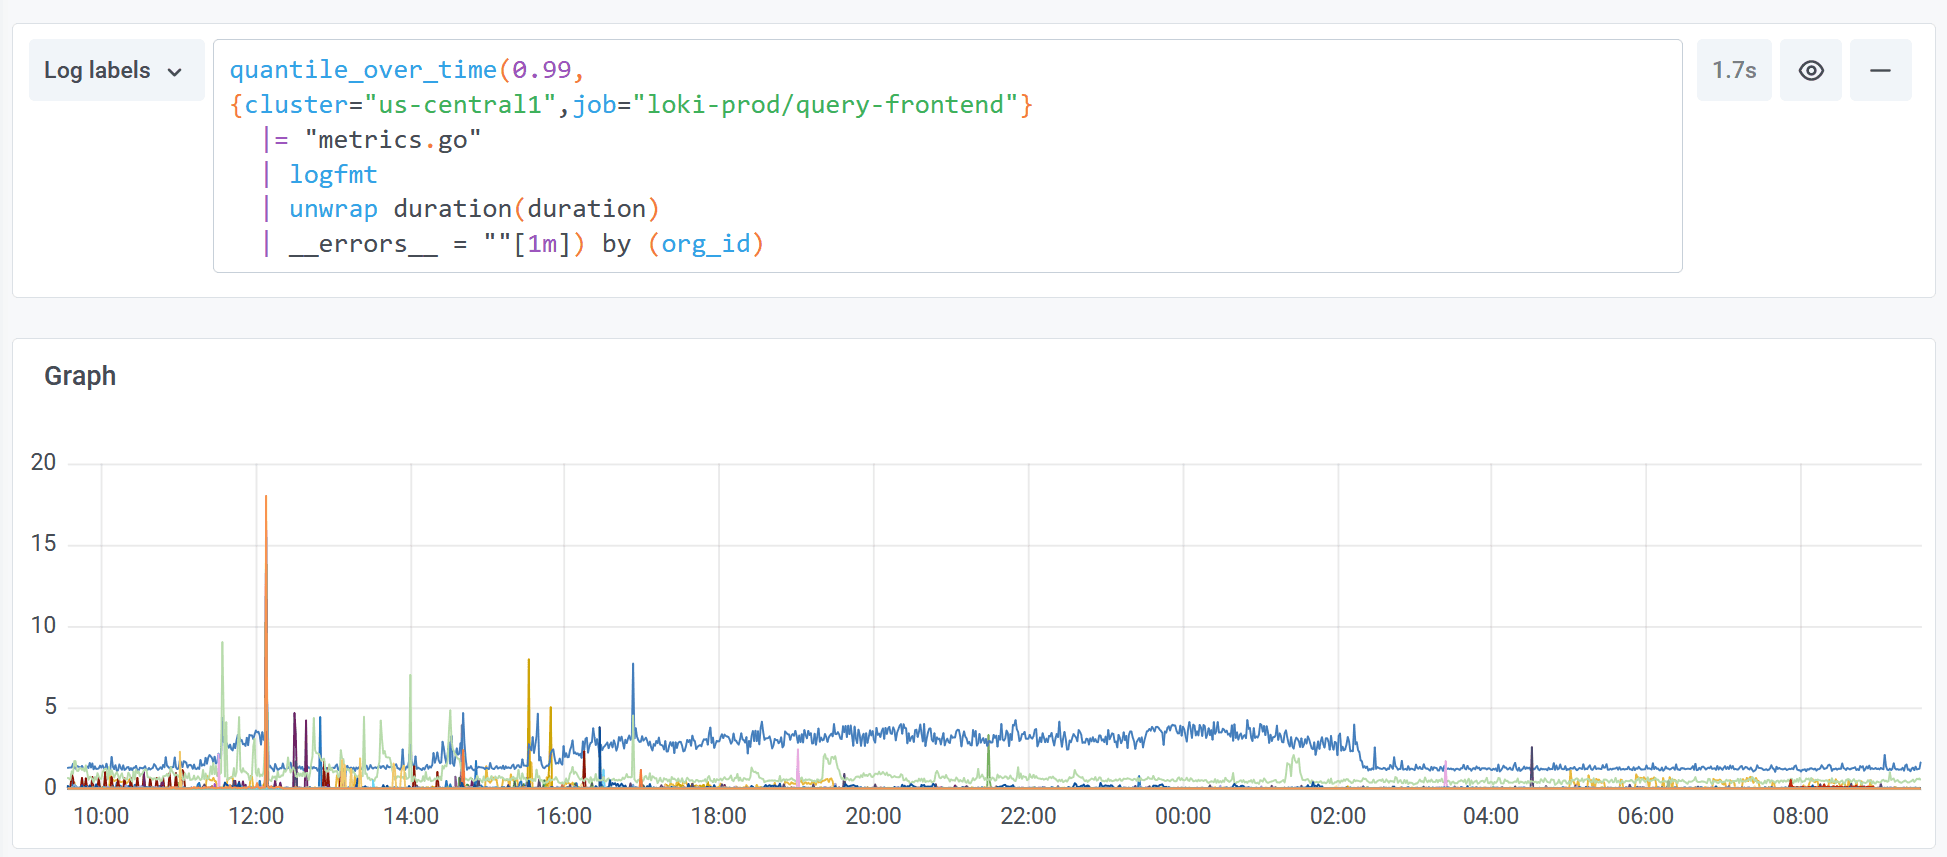
Let’s look at an example of how this could be used to show the 99th percentile request_time from NGINX access logs, aggregated by the destination server:
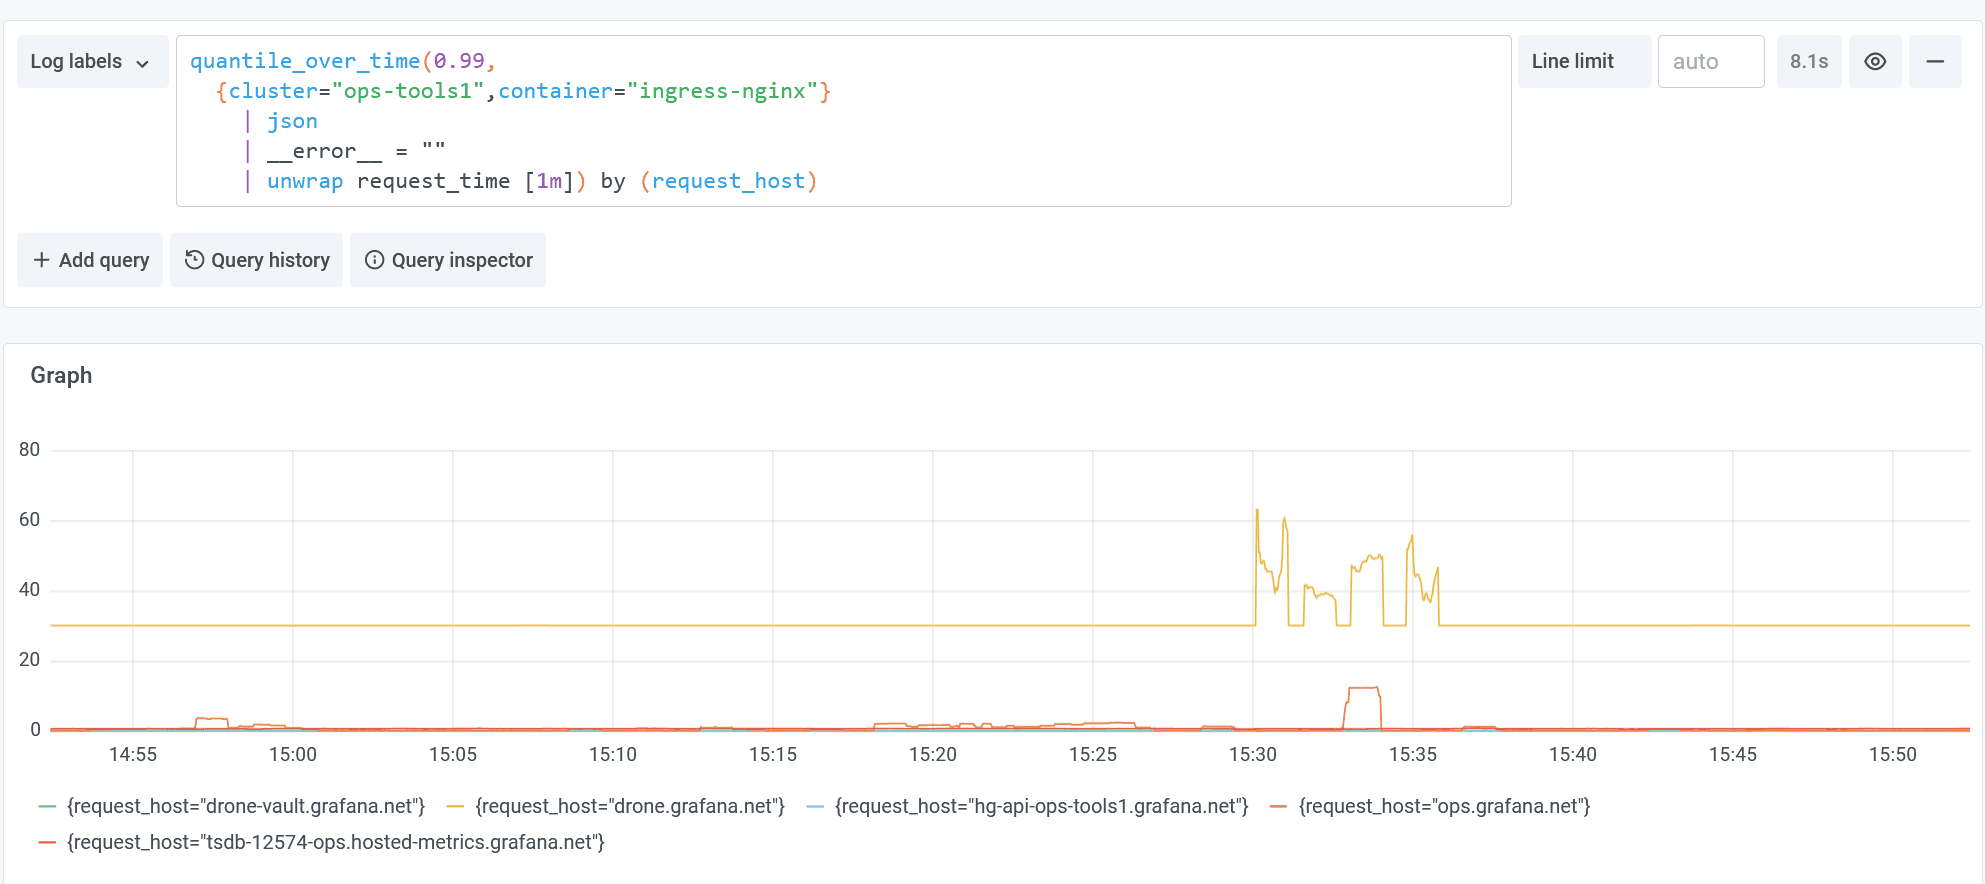
Imagine now taking that same query and aggregating on the client’s request IP:
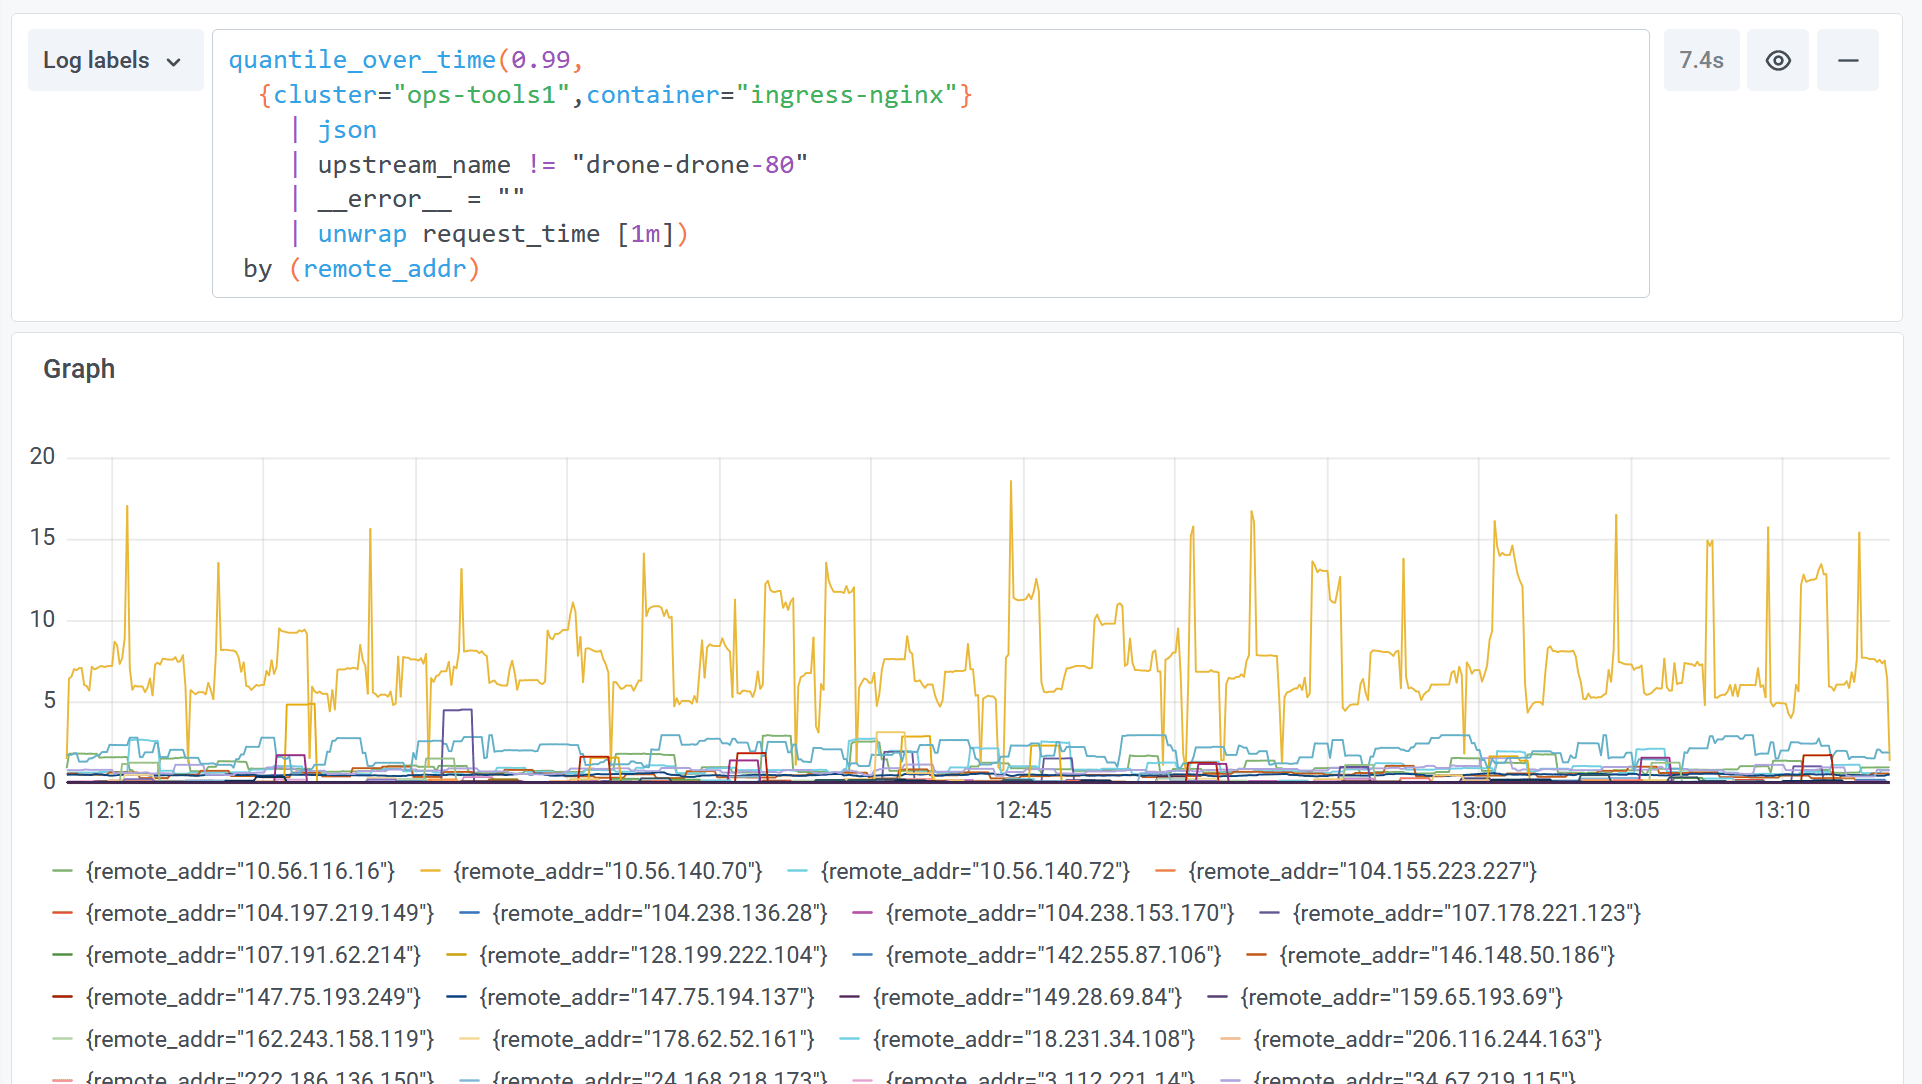
You can see how we are unlocking something new and exciting: the ability to aggregate on high cardinality data!
Here are a couple more examples:
In this last example, we see something else: duration(duration). This is telling Loki to parse the duration label’s value as a Golang duration (which has a time unit on it like ms or s). Support is coming soon for additional types, e.g., kb and mb.
Generate alerts from any query
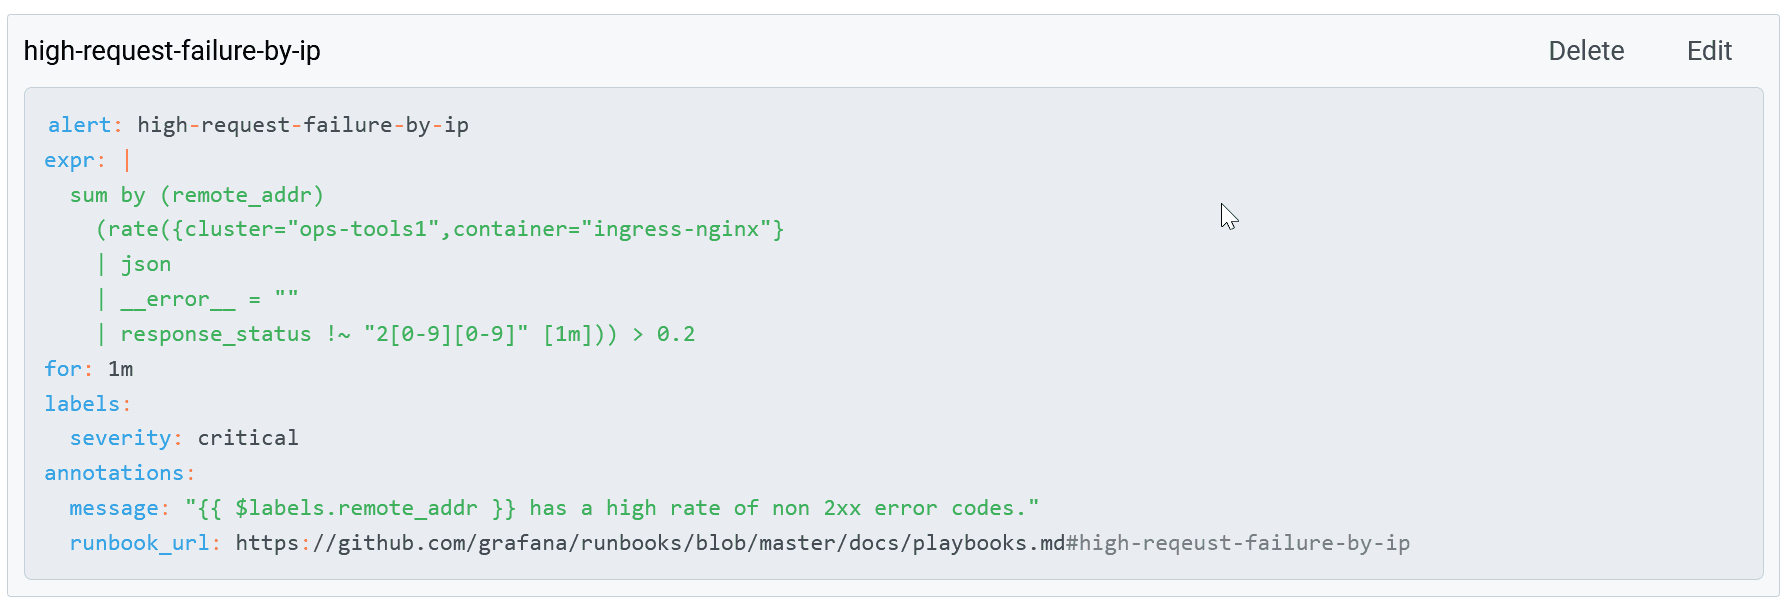
All of these new query features are very exciting, especially when combined with another huge Loki improvement in 2.0: the ability to directly generate alerts from your Logs in Loki and send them to a Prometheus Alertmanager.
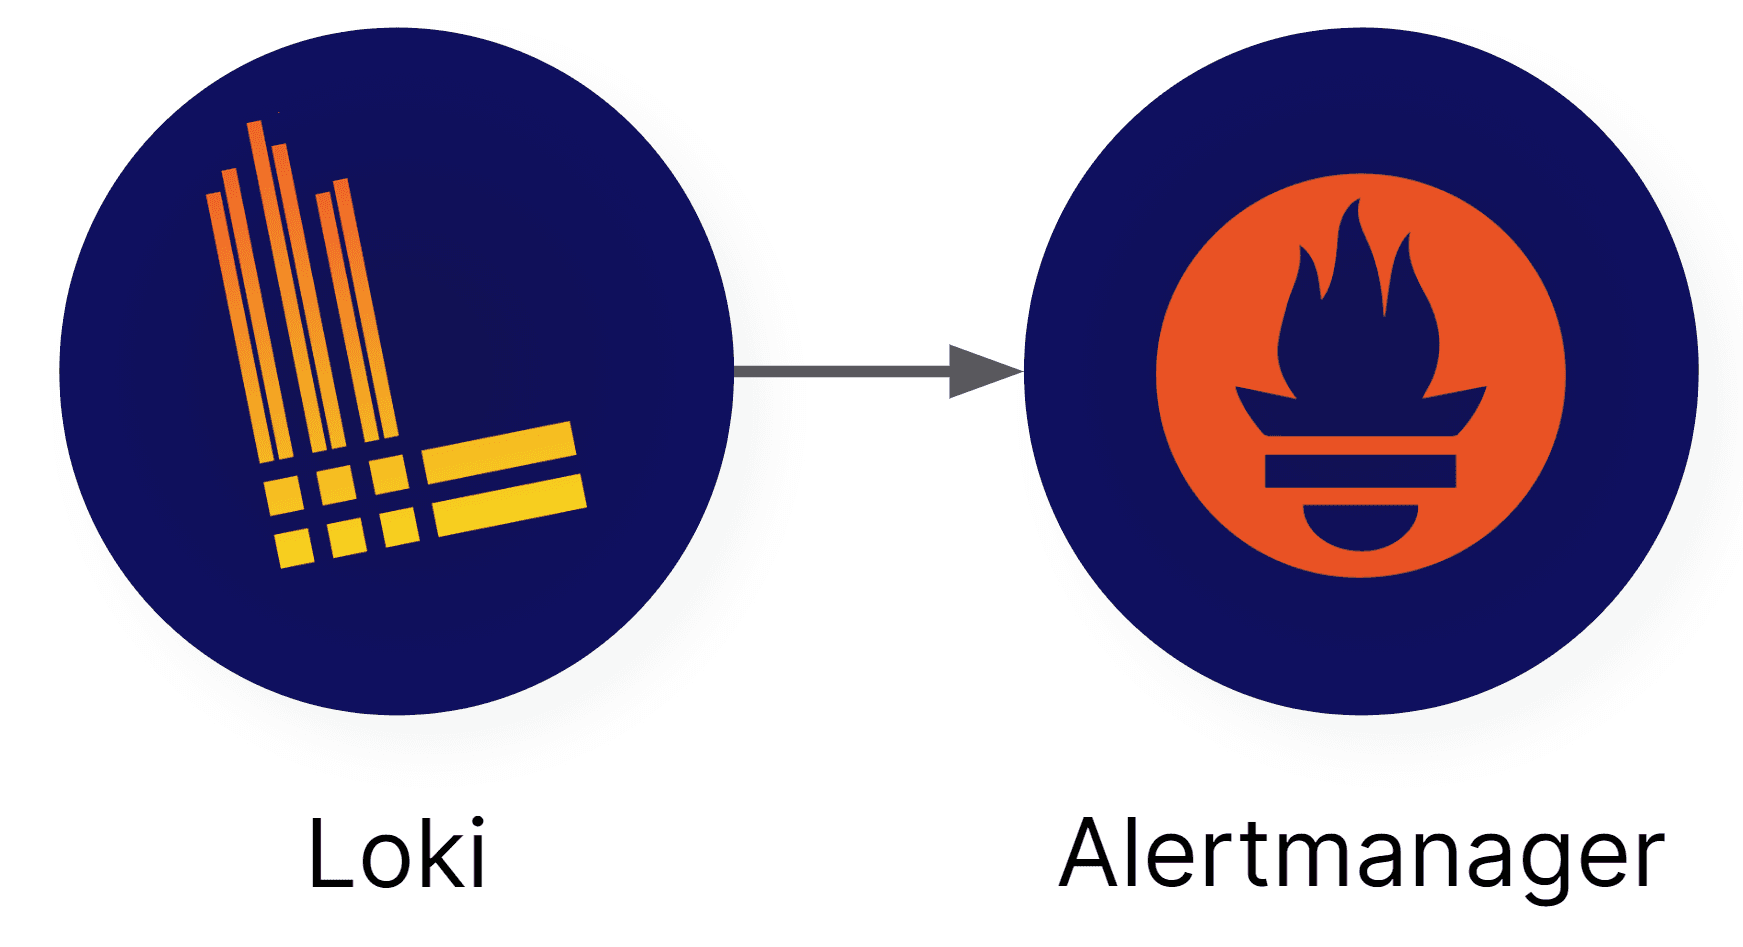
Previously, in order to make alerts with Loki, you would configure Loki as a Prometheus data source and point Grafana to use that to generate Grafana alerts. In Loki 2.0, we’ve integrated a distributed rules evaluation engine so that you can write any Loki 2.0 query to generate an alert statement using familiar Prometheus rule syntax. Alerts are then sent to an off-the-shelf Prometheus Alertmanager, making it really easy to generate and send alerts!
No more separate index store!
The last really exciting news for Loki 2.0 is the removal of the experimental flags from the boltdb-shipper index type!
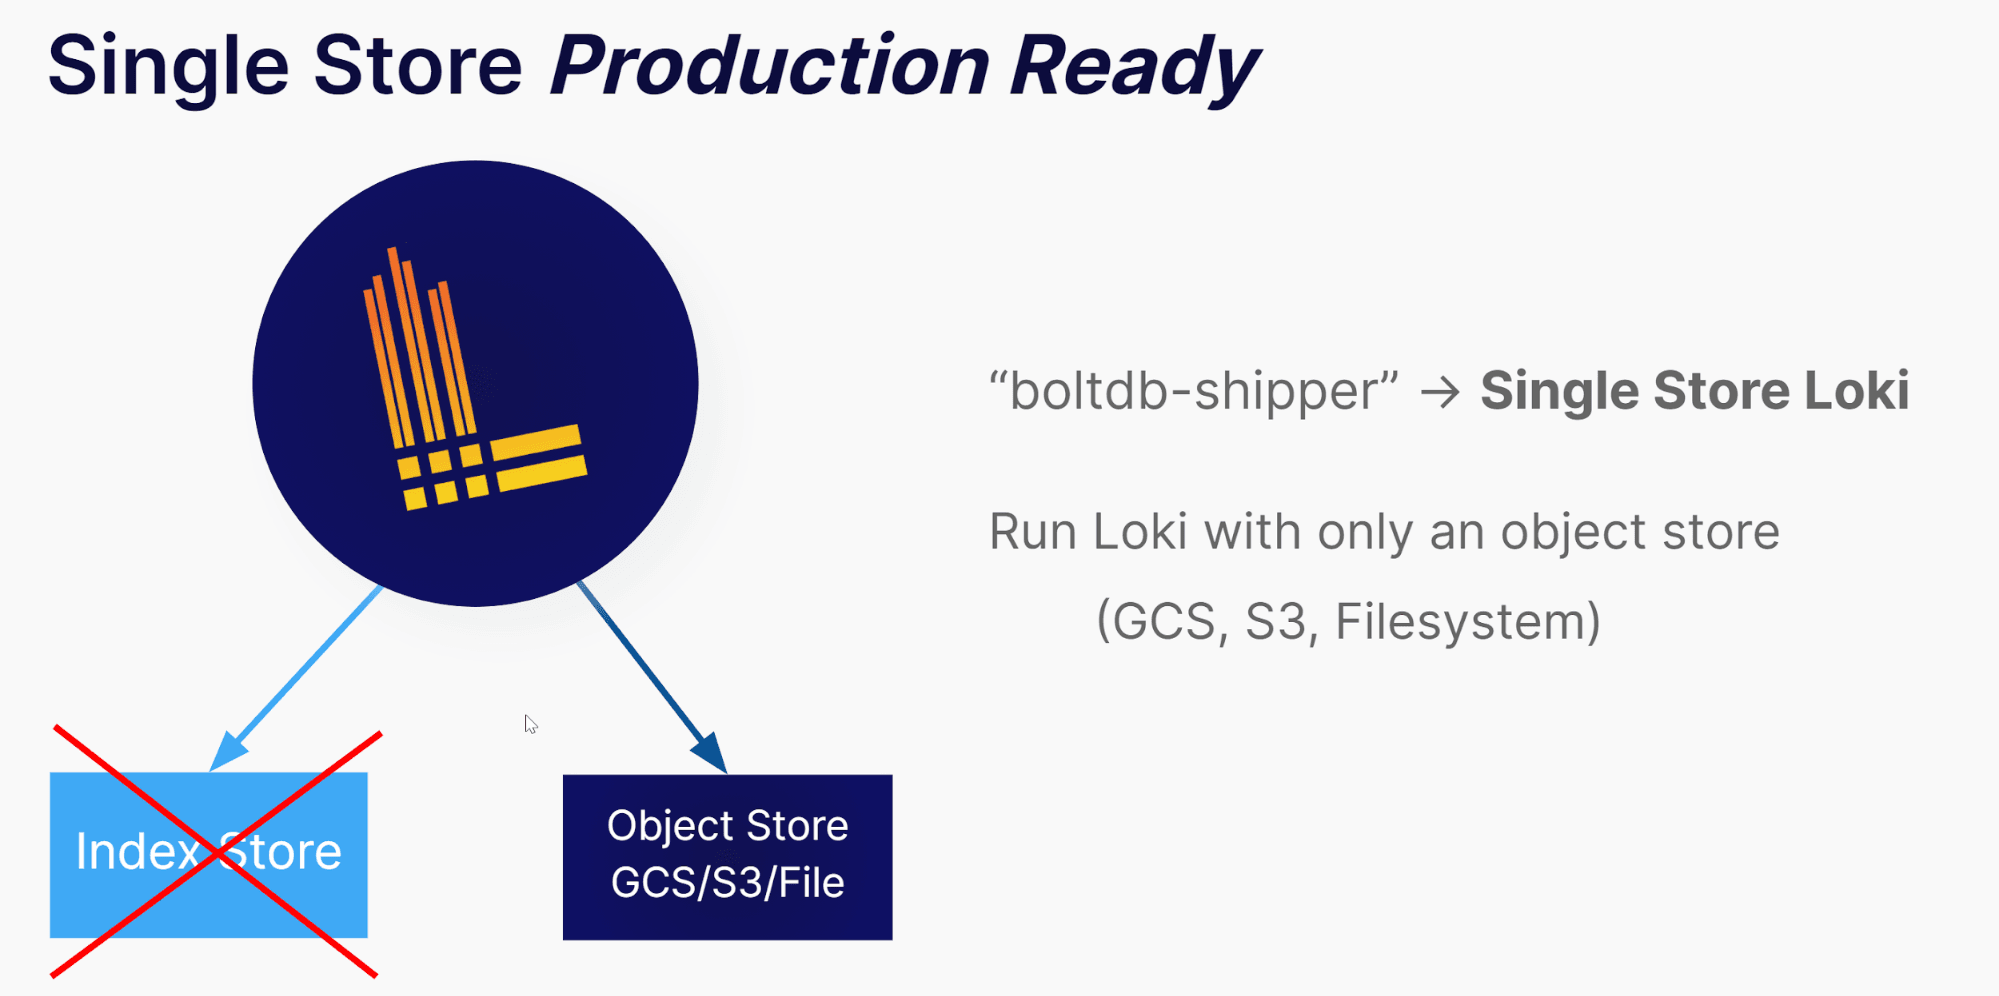
With Loki v1.5.0, we introduced a new index option called boltdb-shipper. This new index allows you to run Loki with only an object store (S3, GCS, Filesystem, etc.); you no longer need a separate dedicated index store (DynamoDB, Bigtable, Cassandra, etc.) and the additional costs that come with it! In 2.0, this is now production-ready. At Grafana Labs, we are internally migrating our clusters in this direction as we speak — or well, type.
For more information
Tune into our ObservabilityCON session, Observability with logs and Grafana today. There will be a live Q&A at the end!
Don’t want to run your own Loki, or maybe you just want to try all this out? Sign up for your 30-day free trial of Grafana Cloud! Out of the box you’ll get a Loki instance wired up to Grafana and an Alertmanager with a new alert rules UI, making it easy to get started ingesting logs and generating alerts in minutes!
Head to the release page to get started.
Read the upgrade guide for full details on what it takes to update your Loki cluster. There are some things here you should pay attention to!
Check out this excellent video by Ward Bekker further exploring and explaining the new 2.0 features:

Check out the new LogQL documentation.
Learn more about Single Store Loki (boltdb-shipper).

