ObservabilityCON Day 1 recap: Loki 2.0 and Grafana Tempo announced, real-time observability with Redis, Grafana demos, a tester's perspective, and more
ObservabilityCON 2020 is live! Over the next few days, Grafana Labs is bringing together the Grafana community for talks dedicated to observability.
We hope you’re able to catch the great sessions we have planned. You can find the full schedule on the event page, and for additional information on viewing, participating in Q&As, and more, check out our quick guide to getting the most out of ObservabilityCON.
Day 1 was filled with several new announcements about exciting projects and feature enhancements we’ve been working on for our customers and community. And there will be a lot more to learn about this week, like the session on Loki 2.0 on Wednesday.
If you aren’t up-to-date on the presentations so far, here’s a recap of the the opening day of the conference:
Keynote: What is observability?
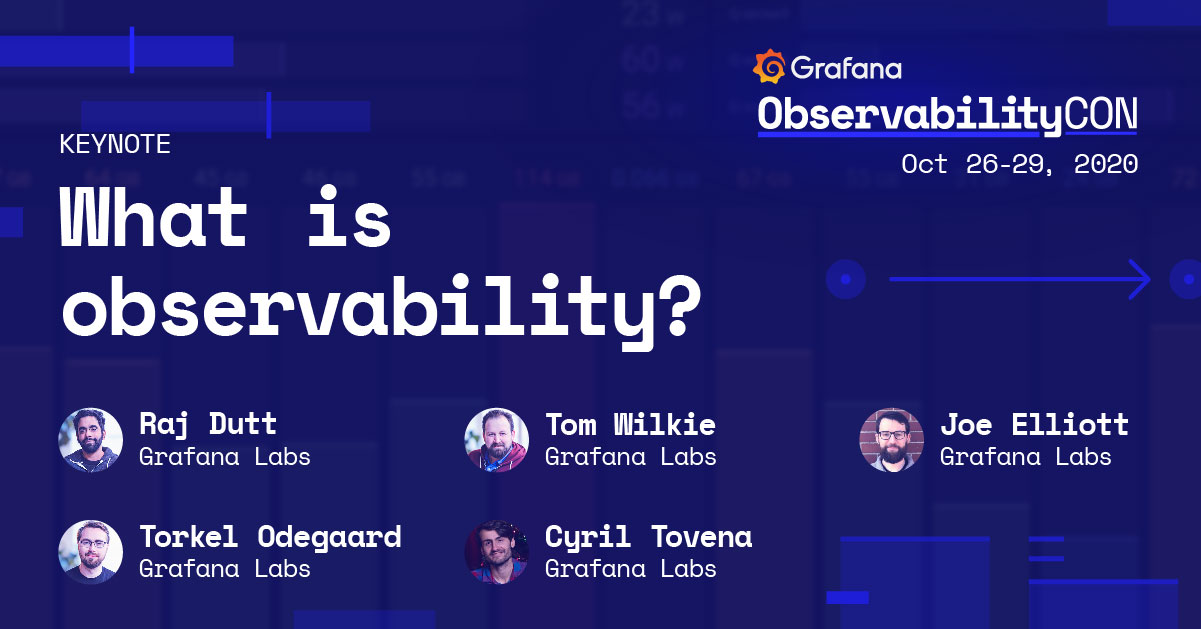
What is observability and what is the company’s vision of observability?
Metrics, logs, and traces are the core foundation of an observability platform, Dutt said, but a platform requires so much more. “It’s about optimized and contextual experience that links those things together, and that’s what the Grafana Labs observability vision is all about.” Dutt then explained why everyone should care about observability, which he considers the foundation for success. It can help companies build better software, faster and more reliably; optimize your IT infrastructure; and foster a data-driven culture (one of the core missions of the open source Grafana project from day one).
How Grafana is rapidly becoming the center of an open observability platform (plus a sneak peek at some of the features of Grafana 7.3)
Ödegaard gave a quick recap of the history of Grafana and how it’s grown over the past six years. Now, he said, it’s “at the center of a big ecosystem of different tools and vendors in the observability space,” and noted it’s been “incredible” to partner with the big Cloud vendors — Amazon, Microsoft, and Google — to provide data sources and integrations with their observability services. He then discussed Grafana 7 and how it improved the platform, unified features, and made tracing “a first-class citizen.” He also gave a preview of the new standard color option, a feature in 7.3, which will be out soon.
Metrics (with a focus on Prometheus and Cortex)
The rise of Prometheus as a de facto standard for monitoring applications and infrastructure was the subject of Wilkie’s portion of the keynote. Prometheus has been growing strongly since 2016, and he presented some data points to back that up: Last year, on average, over 50 percent of Grafana instances had a Prometheus data source, and this year, he said, almost every instance has one. He also shared that a recent survey of CNCF’s end-user community revealed most respondents were using Prometheus (and Prometheus and Grafana together). Wilkie also pointed out that many vendors have been adding support for PromQL, which he interprets to mean customers not only want to instrument their code with Prometheus metrics, they also want to query it using the Prometheus query language. So what’s stopping other people from using Prometheus? Some of the issues could be solved by Cortex, which, he said, “is sympathetic to the needs of large organizations.” He then gave a brief update on Cortex and the Cortex-powered product that we recently launched, Grafana Metrics Enterprise.
Logs (with a focus on Loki, which is rapidly gaining popularity)
Wilkie moved on to a quick refresher course on Loki, talked about its quick growth, and announced the release of Loki 2.0, which includes improvements to the Loki query language, so users can now transform the logs and extract additional labels, enabling more filtering and grouping. Senior Software Engineer Cyril Tovena then gave a demo to highlight all of the new features.
A special announcement
Senior Software Engineer Joe Elliott wrapped things up by introducing Grafana Tempo, our new open source, easy-to-use, and high-scale distributed tracing backend. Currently, 100 percent of our read path — from development, staging, and production — is in Tempo, 24 hours a day, sampling 170,000 spans per second. Elliott gave a brief demo, but join us Wednesday, October 28, at 17:40 UTC for the session on Tracing made simple with Grafana to learn even more about it. (A free beta is coming soon. Register for it in your Grafana Cloud Portal. Don’t have a Cloud account? Sign up for a free 30-day trial here.)
You can watch this session on demand here.
Real-time observability with Redis and Grafana
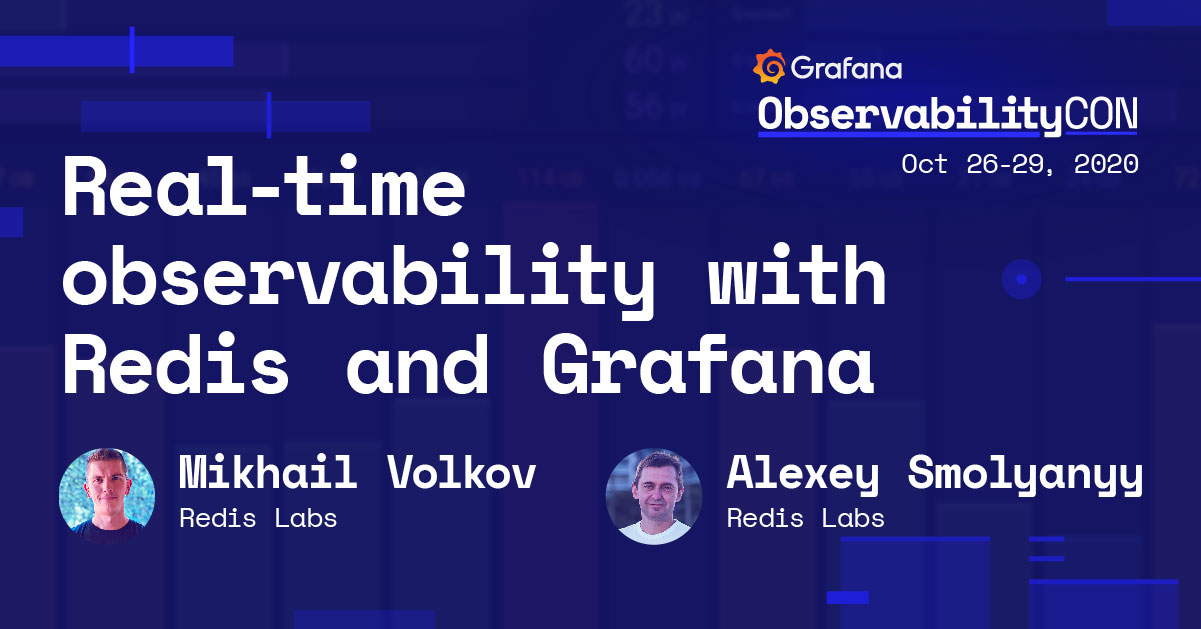
You can check out their session on demand here.
Grafana: The open and composable observability platform
Torkel Ödegaard hosted this session, which focused on features of Grafana (the composable observability platform) and Grafana Cloud and Enterprise (the curated observability stack) and contained the following mini-presentations from Grafana Labs team members:
What’s new in Grafana
Software Engineer Ivana Huckova used metrics and logs from an avocado monitoring system she recently built and showed off Grafana’s newest features and improvements in three areas: platform and visualization, Explore, and data sources. Some highlights: customizable date formats, color scheme picker, Prometheus `$_rate_interval`, and new ways to flip the order of logs and share shortened links.
Getting started with Grafana in 60
UX Designer Oana Mangiurea, who is in charge of the onboarding experience for Grafana Cloud, gave a demo to show how it’s possible (and easy) to get Grafana up and running quickly using Grafana Cloud. (Sign up for a free trial here.)
New data source plugins
Software developer Stephanie Closson, who works on the Enterprise plugins and integrations team, walked through some of the new plugins and how they can be used effectively. She noted that more data means more possibilities, but more data does not mean more insights. Context matters, and it’s the key to gaining insights. “When you choose the right visualization, and present the right data together,” she said, “it tells a very compelling data story that will affect your bottom line.”
Enterprise new features
Software engineer Agnès Toulet gave demos of Audit Logs (which keeps a record of user action to manage and mitigate suspicious activity, meet compliance requirements, and share sensitive information in Grafana with confidence) and data sources usage insights (which helps you understand how data sources are used to keep them reliable and performant).
You can watch the full session on demand here.
A peek into observability from a tester’s lens
You can watch her session on demand here.
Today’s sessions (Prometheus Day):
- 16:00 UTC The evolution of Prometheus observability with Grafana Labs team members Anthony Woods, Marco Pracucci, Atibhi Agrawal, Jess Müller, Teddy Bartha, and Alex Martin
- 17:00 UTC ConProf: Production-grade Prometheus for continuous profiling with Bartek Plotka, Principal Software Engineer at Red Hat, and Frederic Branczyk, Founder and CEO of Polar Signals
- 17:40 UTC Building observability infrastructure on Istio using Prometheus and Jaeger at LastPass with Krisztian Fekete, DevOps Engineer at LogMeIn
- 18:40 UTC Always-enabled monitoring with Loki, Prometheus, and Grafana with Vaibhav Krishna, Infrastructure Engineer at Grofers
Don’t forget that you can connect with the Grafana community and get the latest updates from the Grafana Labs team during the event on Slack. Join the Grafana Labs Community Slack workspace and drop into the #observabilitycon channel.
See the ObservabilityCON 2020 schedule here.