
Introducing the Snowflake Enterprise plugin for Grafana
This post has been updated to reflect changes in the availability of the Snowflake data source plugin for Grafana Cloud users.
It’s always an exciting feeling releasing a new feature or enhancement. As it gets colder here in the Northeast of the U.S. and I dream of traveling somewhere warm, why not take this opportunity to talk about Snowflake?
Snowflake offers a cloud-based data storage and analytics service, generally termed “data warehouse-as-a-service.” The main benefit of Snowflake is that you pay for compute and storage that you actually use, so it’s not “just another database.”
Snowflake has become very popular over the last few years, culminating in a huge IPO, by allowing enterprise users to affordably store and analyze data using cloud-based hardware and software. Lots of companies use Snowflake to store application and business data like transaction counts, active user sessions, and even time series or metric data. It makes sense that you’d want to visualize your Snowflake data alongside your other data sources in Grafana, in order to put log and metric information in context … and now you can!
The Snowflake Enterprise data source plugin for Grafana sports a Monaco-powered, type-ahead query editor and supports annotations and alerts, so you can overlay events from Snowflake on top of other charts or get alerted when Snowflake data falls outside a certain threshold. As with the SQL Server data source plugin, you can format your query results as a table or as time series data. Here’s a quick look at some of the plugin’s functionality.
Getting started
Once you’ve installed the Snowflake plugin, configure Snowflake as a data source by going to Configuration > Data Sources > Add data source. Select Snowflake.
Add your authentication details, and the data source is ready to query!
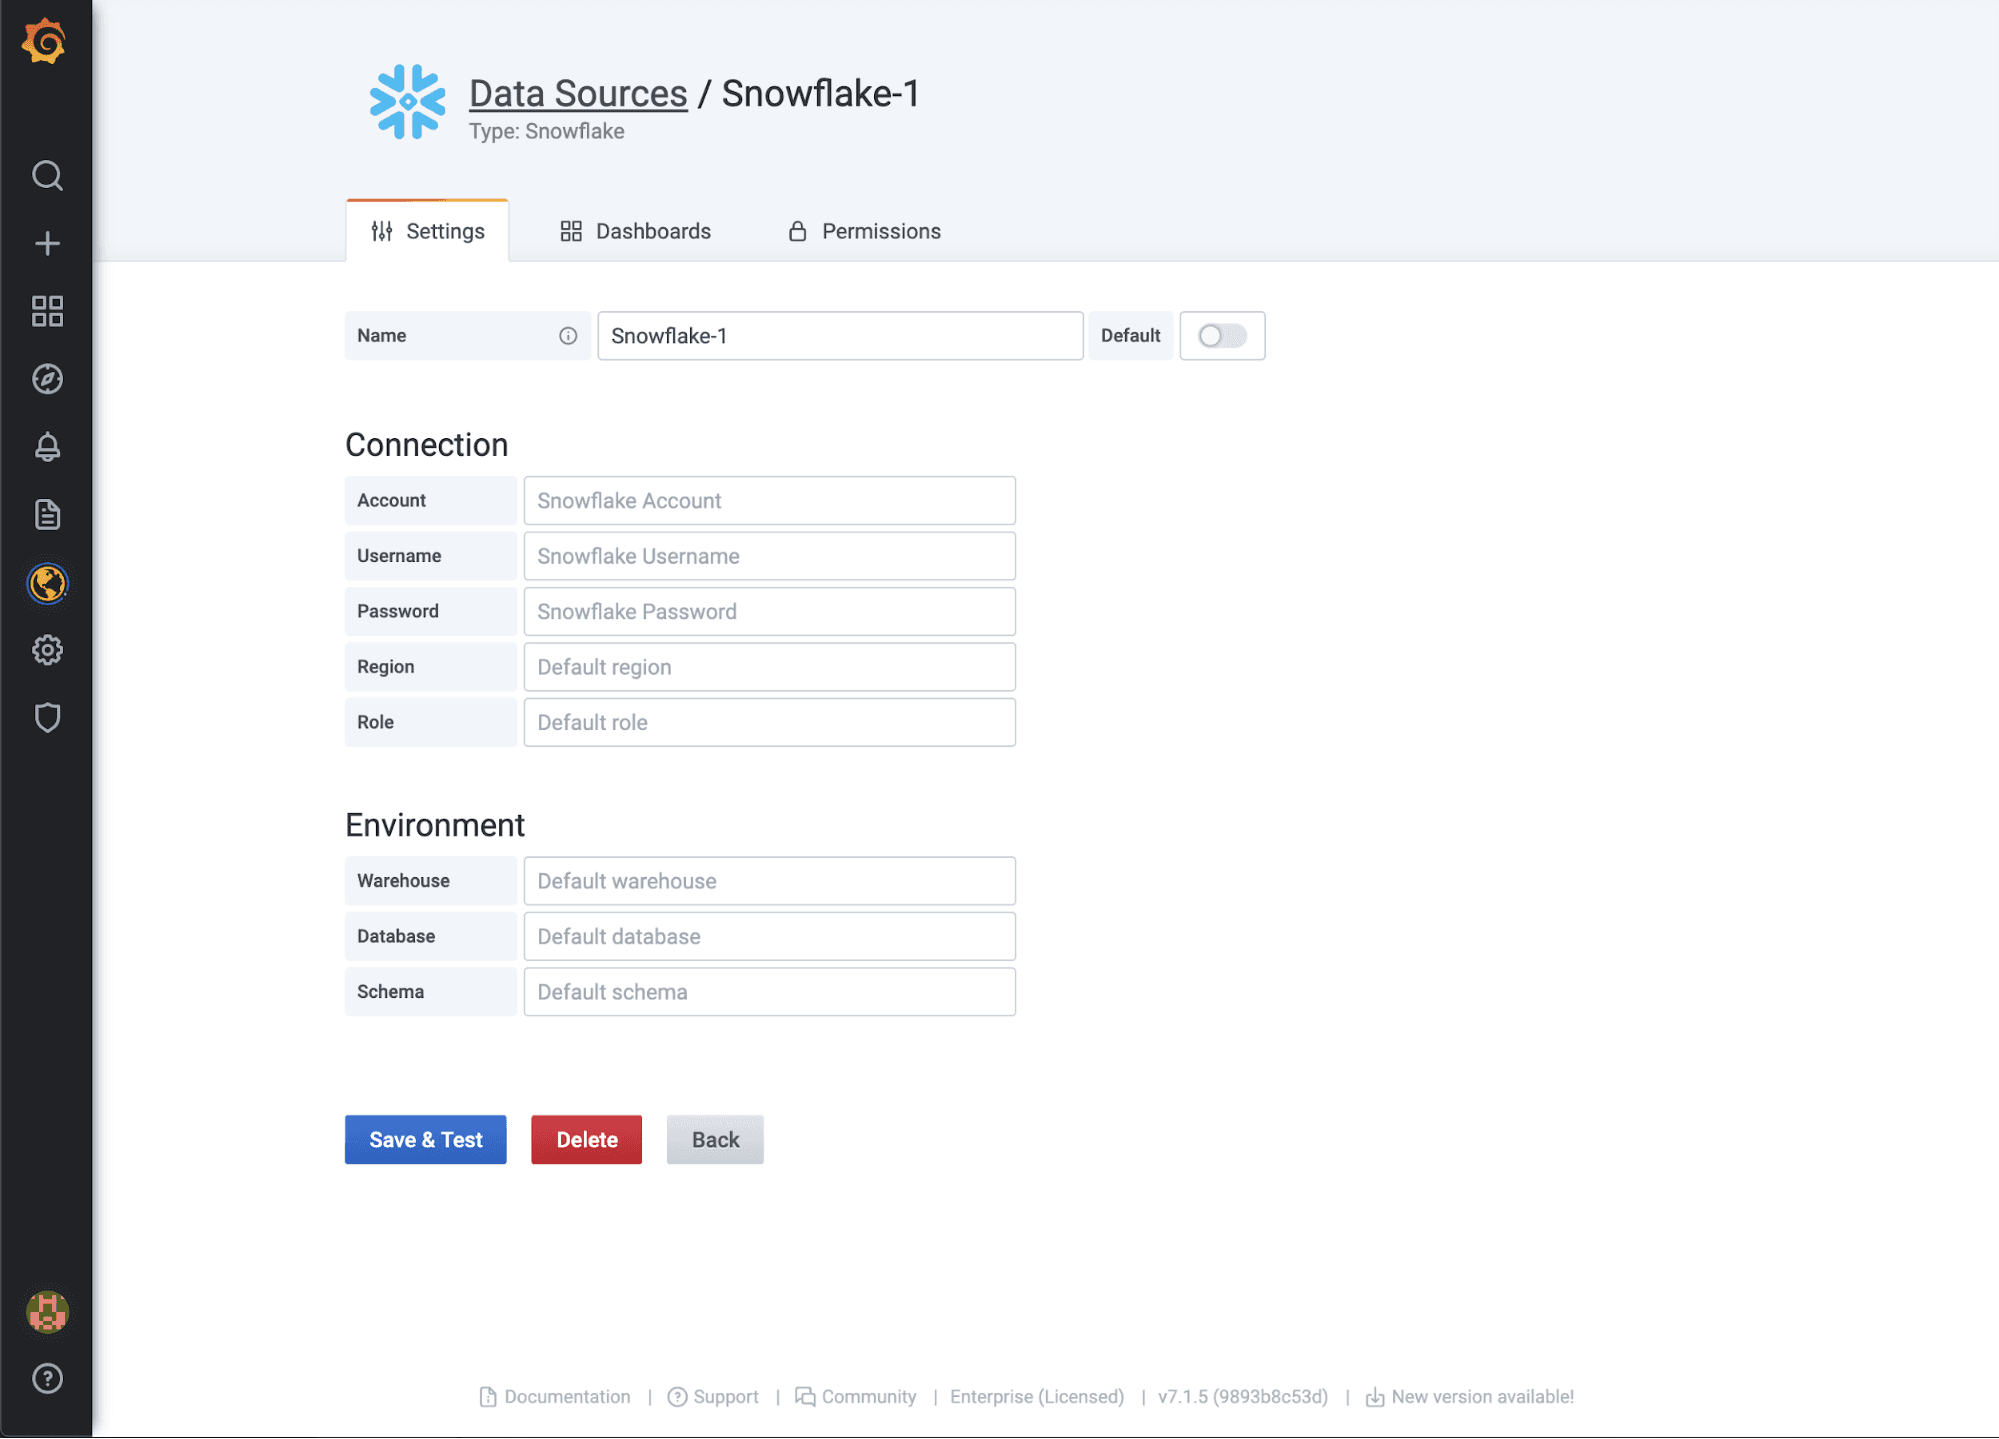
Quick tip: Click on the Permissions tab to enable data source permissions, an Enterprise feature that allows you to control who can query the data source.
Let’s get to querying!
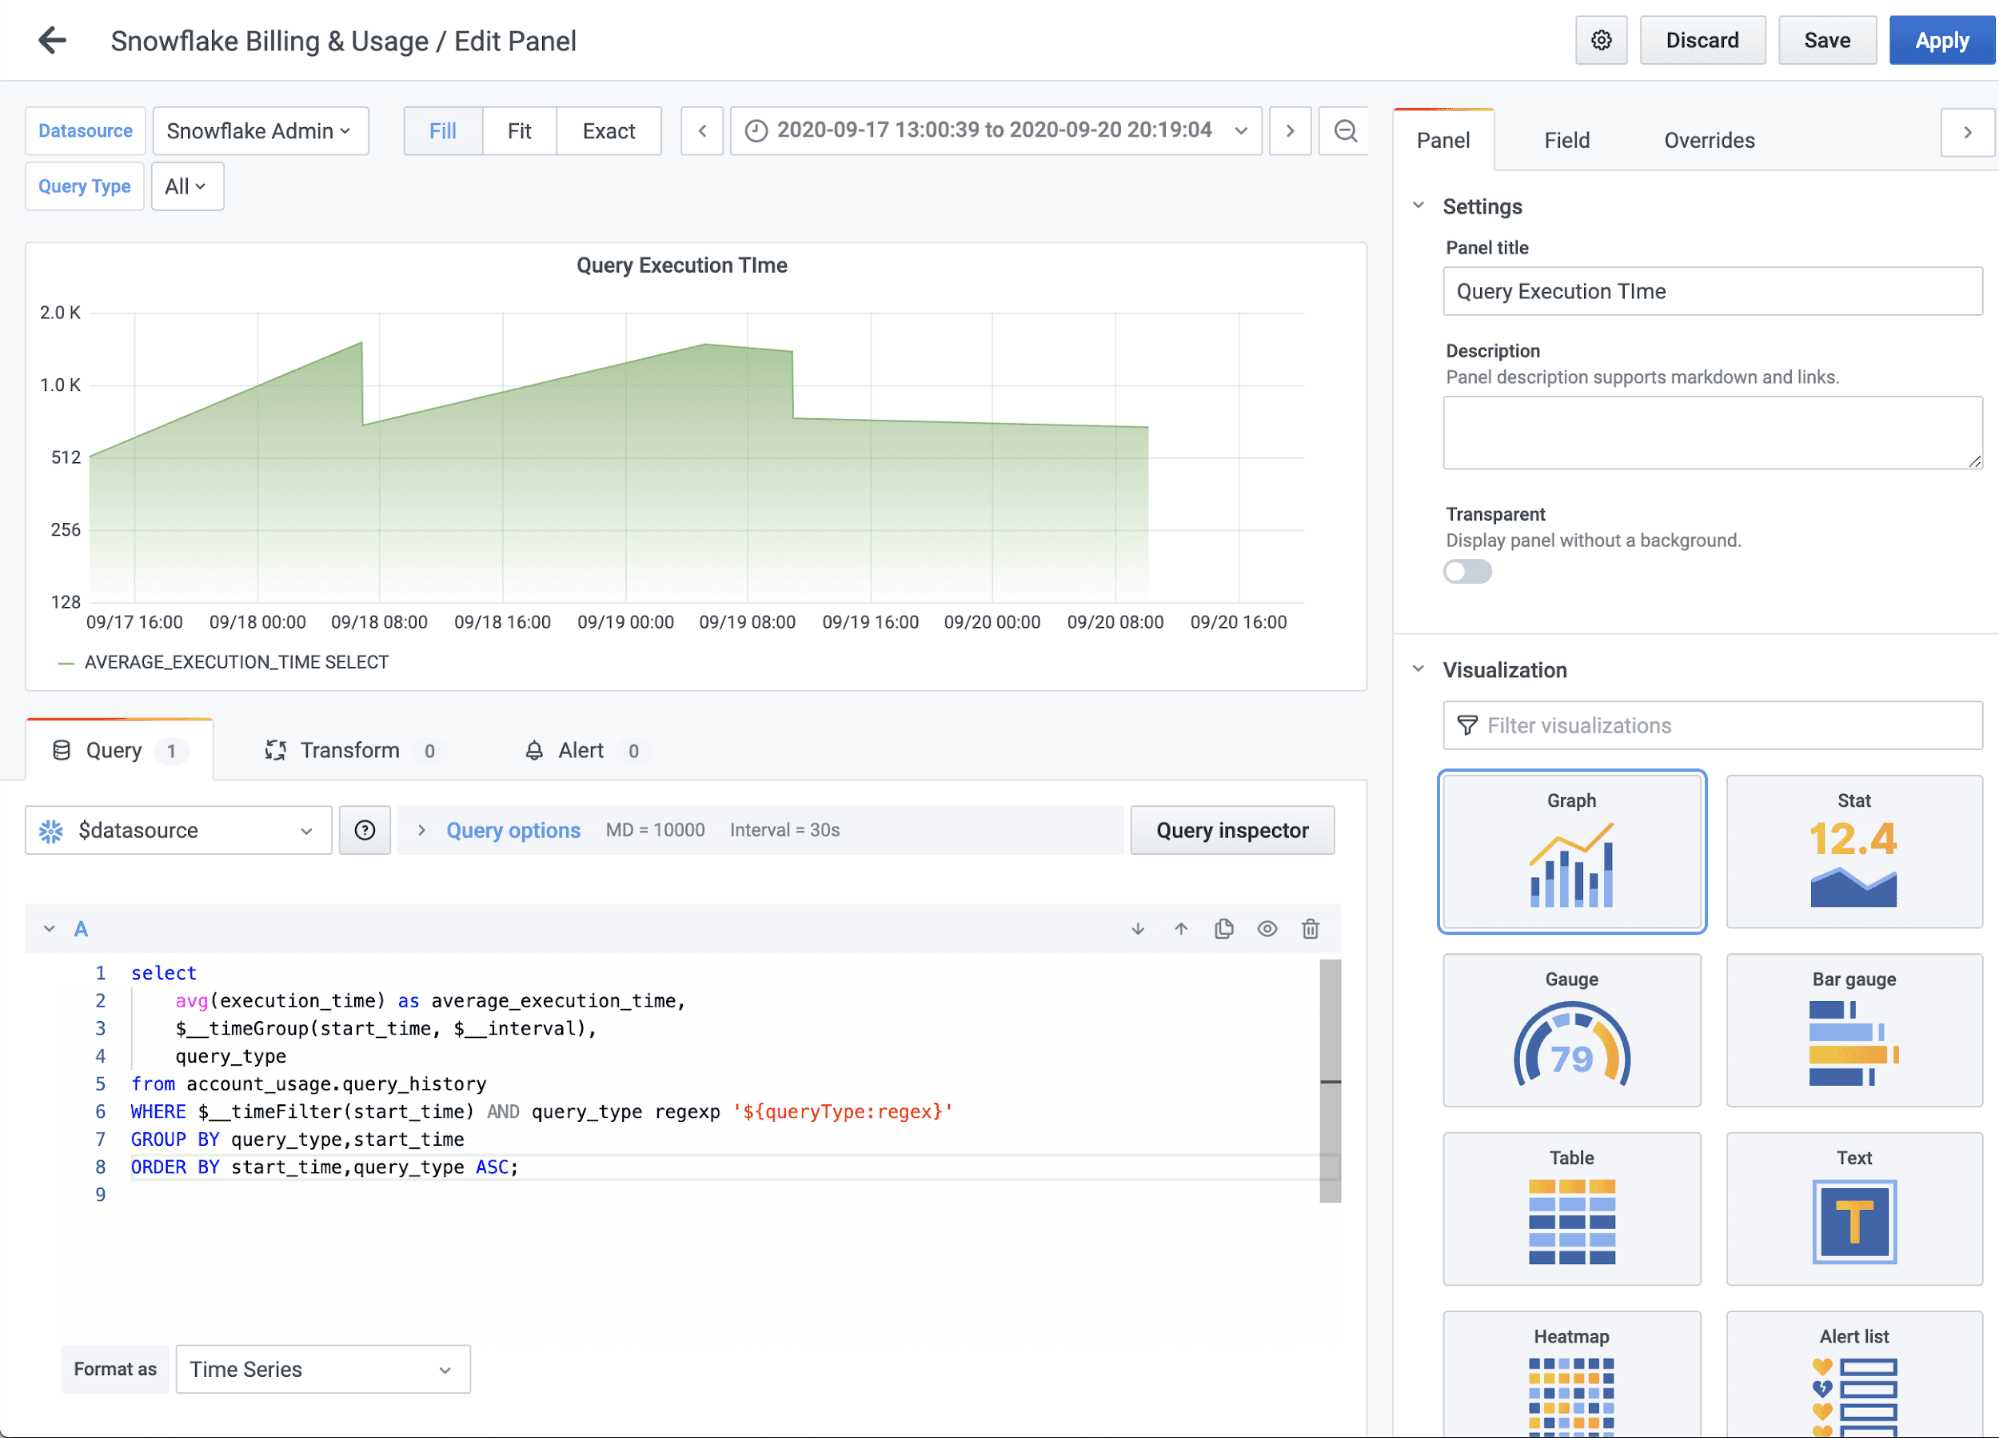
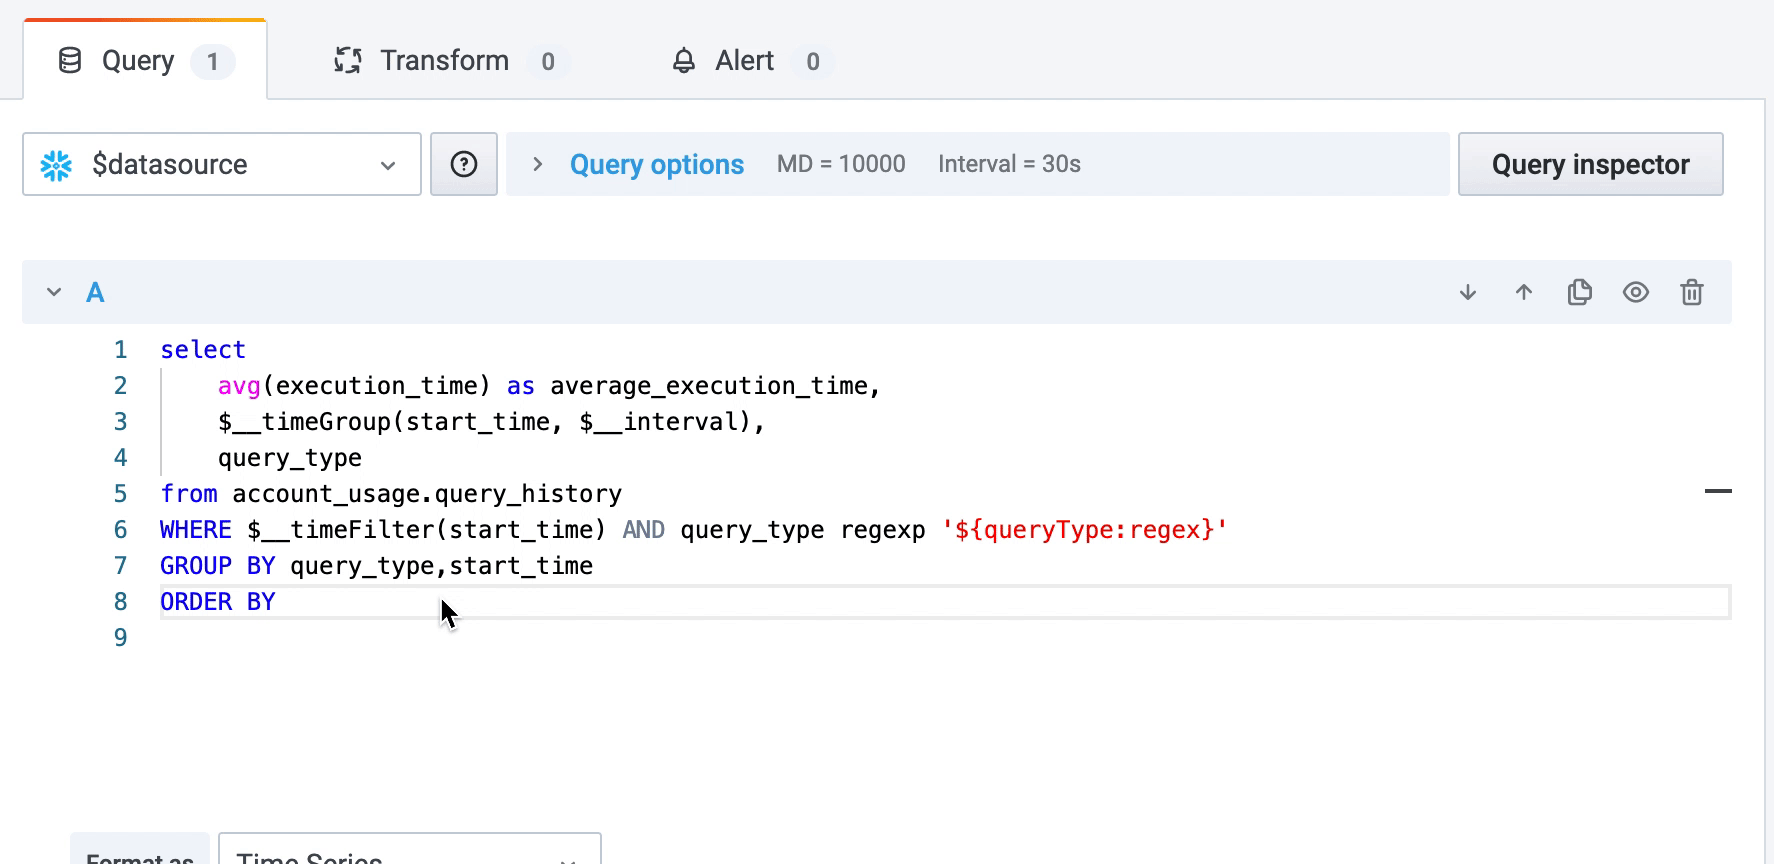
The query editor is a Smart SQL auto-completion editor, allowing you to format as time series or table.
Neat!
Variables are my favorite — and easy to do by simply adding it in the query:
select

from

WHERE  = '$variable'
Multi-value variables can be used in the query like so:
WHERE $__timeFilter(start_time) AND query_type regexp '${queryType:regex}'
And here’s how the variable looks in Grafana:

Alerting and annotations
Now that you’ve got some queries, how about we add some alerts?
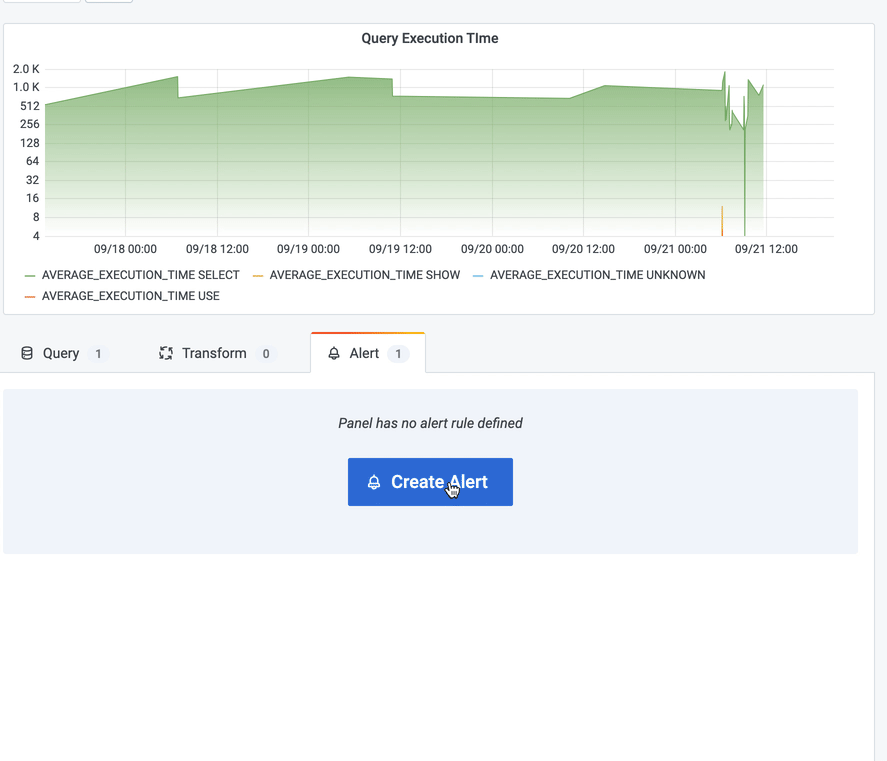
Lastly, I want to talk about annotations. Annotations provide a way to mark points on the graph with rich events.
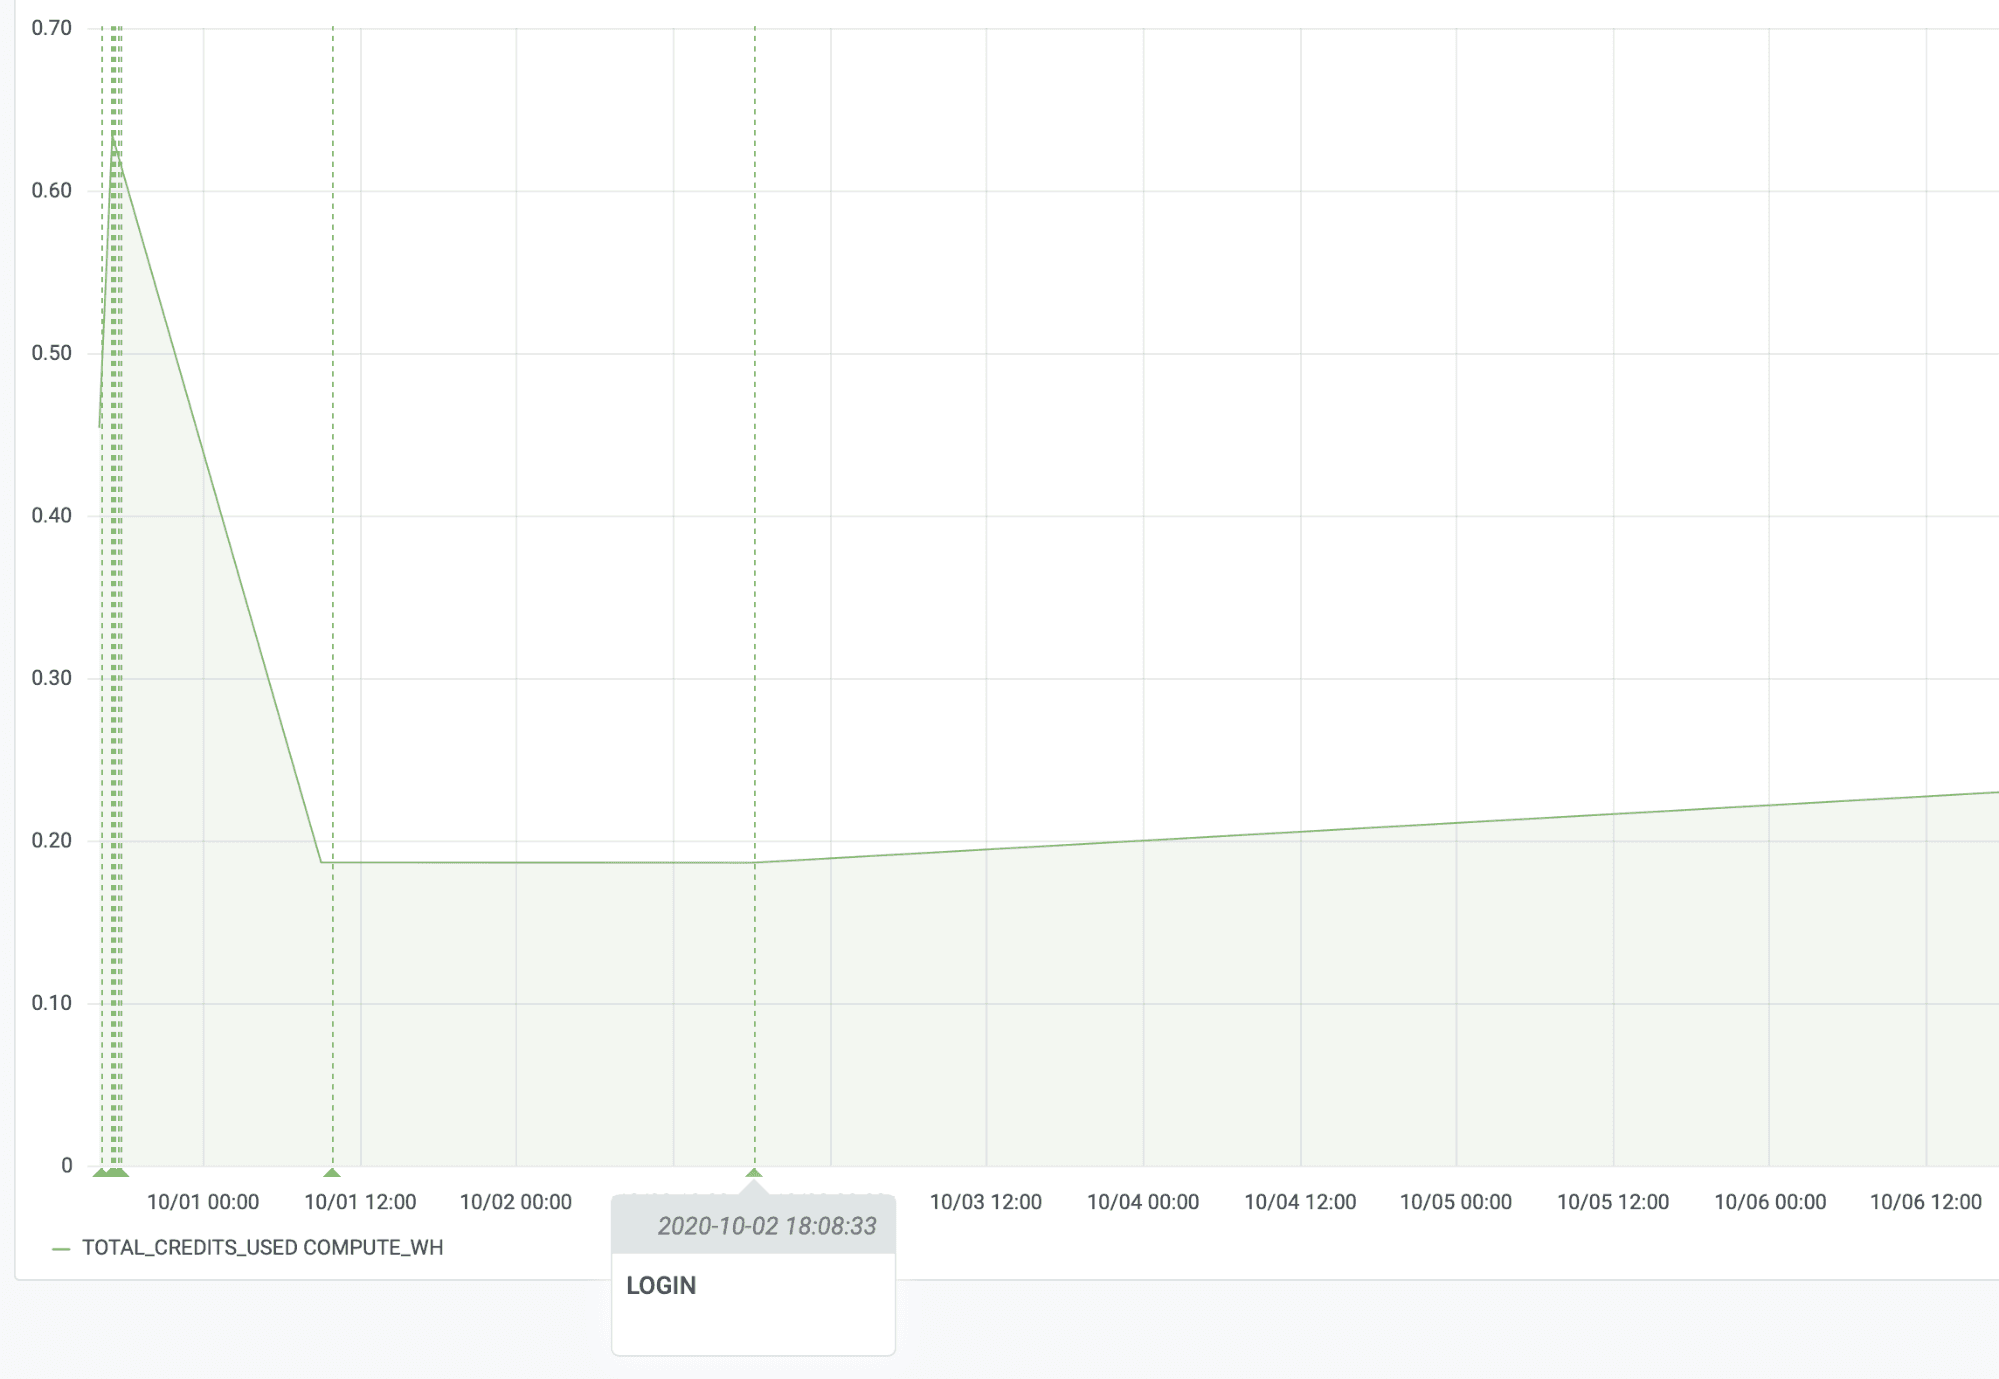
In this example, I’m using this annotation query to show me successful logins and IP as an annotation:
SELECT
   EVENT_TIMESTAMP as time,
   EVENT_TYPE,
   CLIENT_IP
FROM ACCOUNT_USAGE.LOGIN_HISTORY
WHERE $__timeFilter(time) AND IS_SUCCESS='YES'
ORDER BY time ASC;
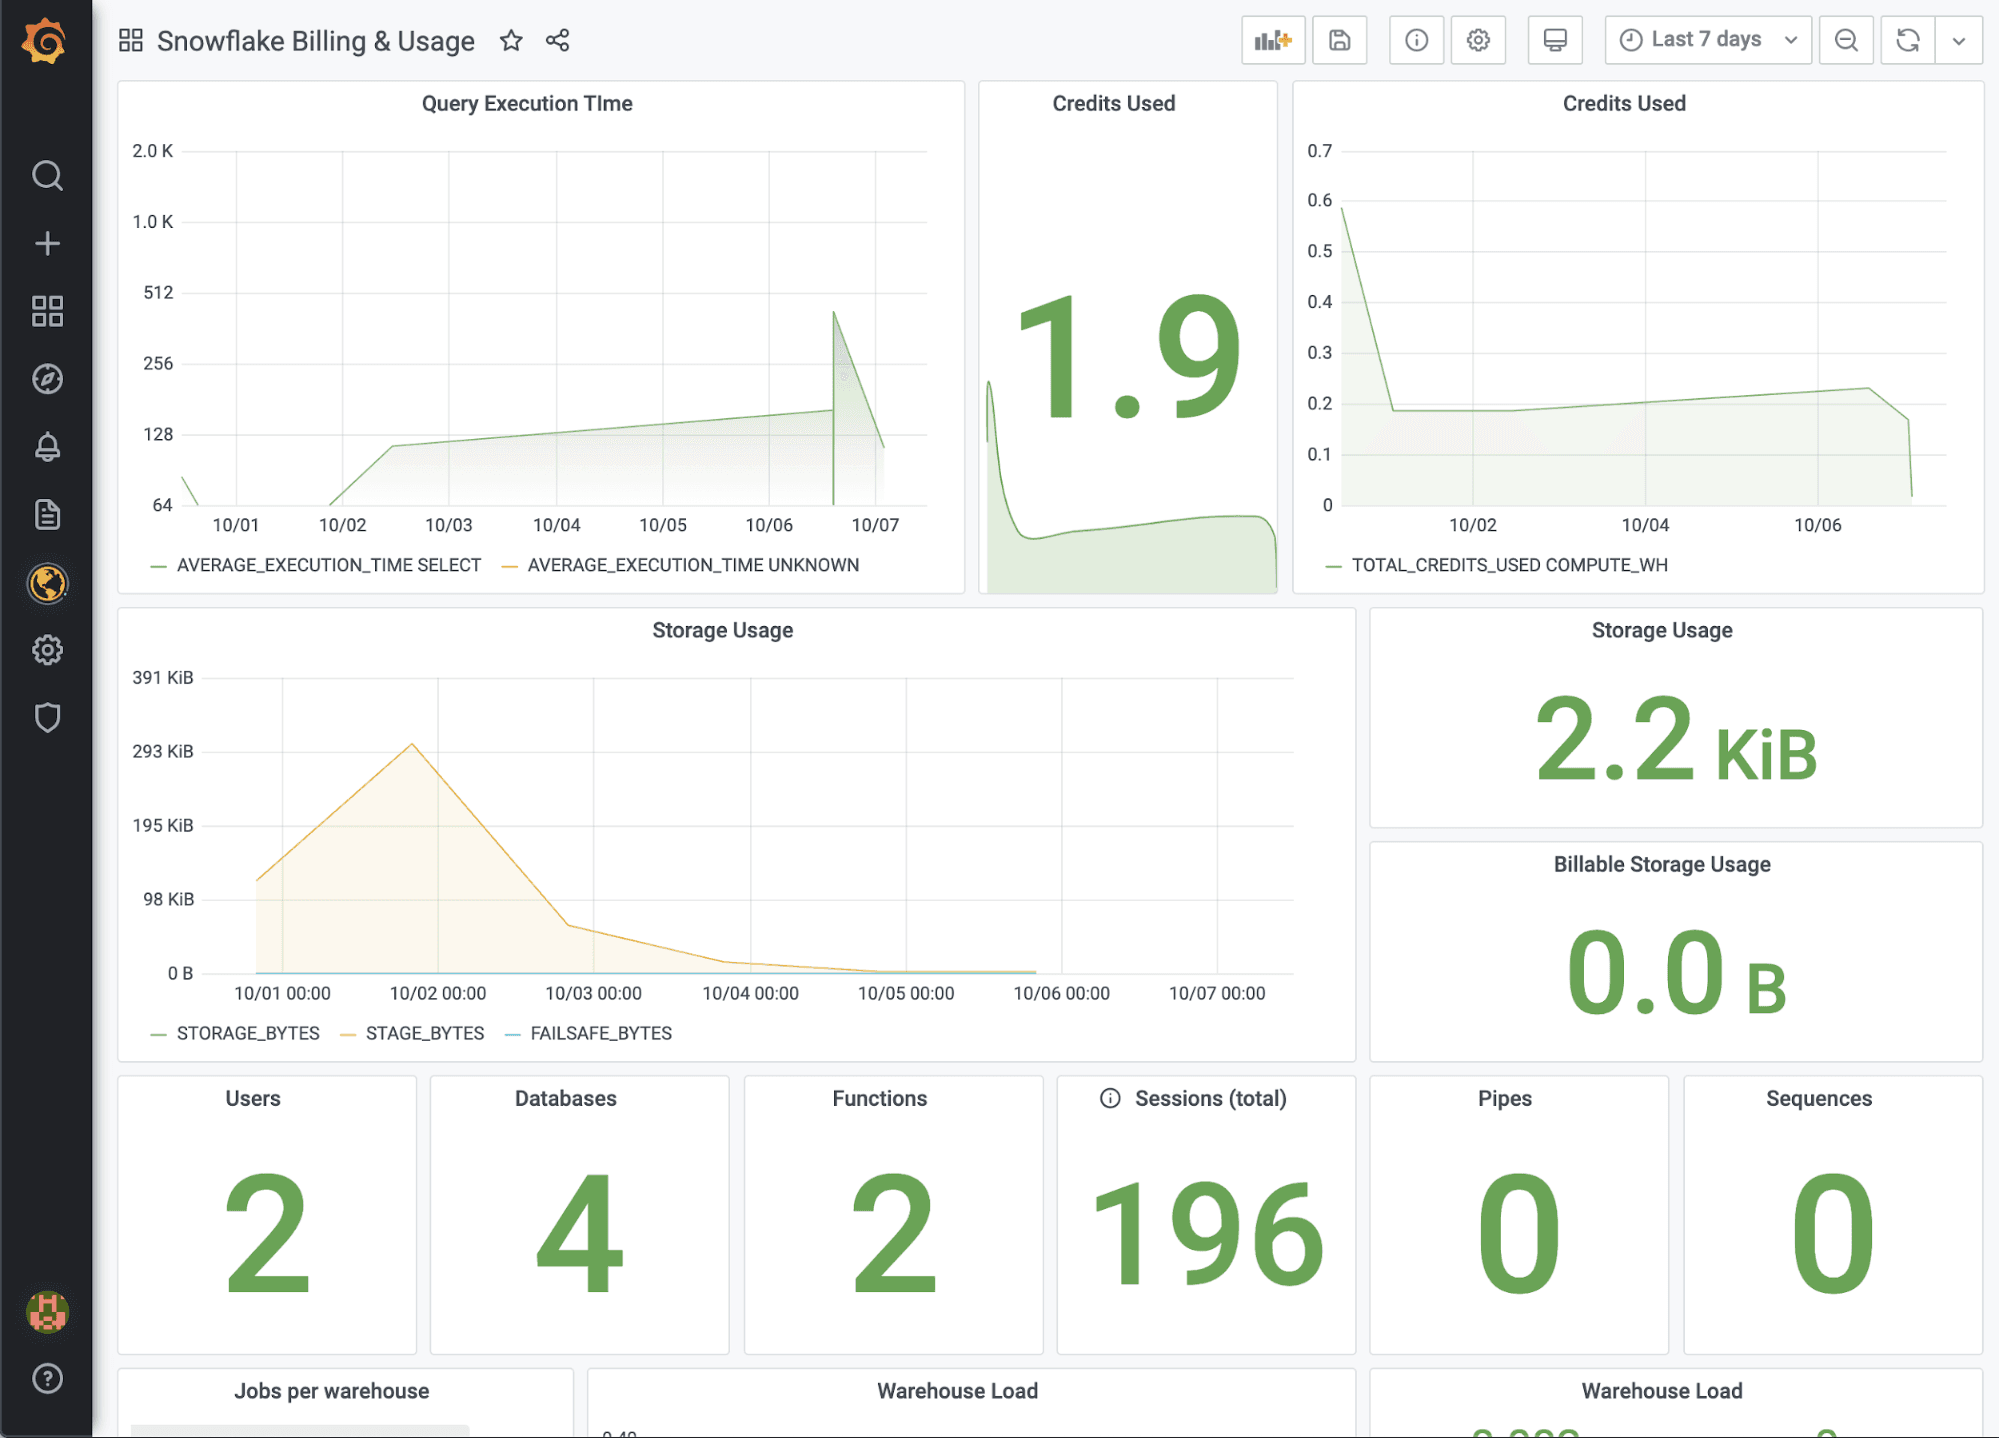
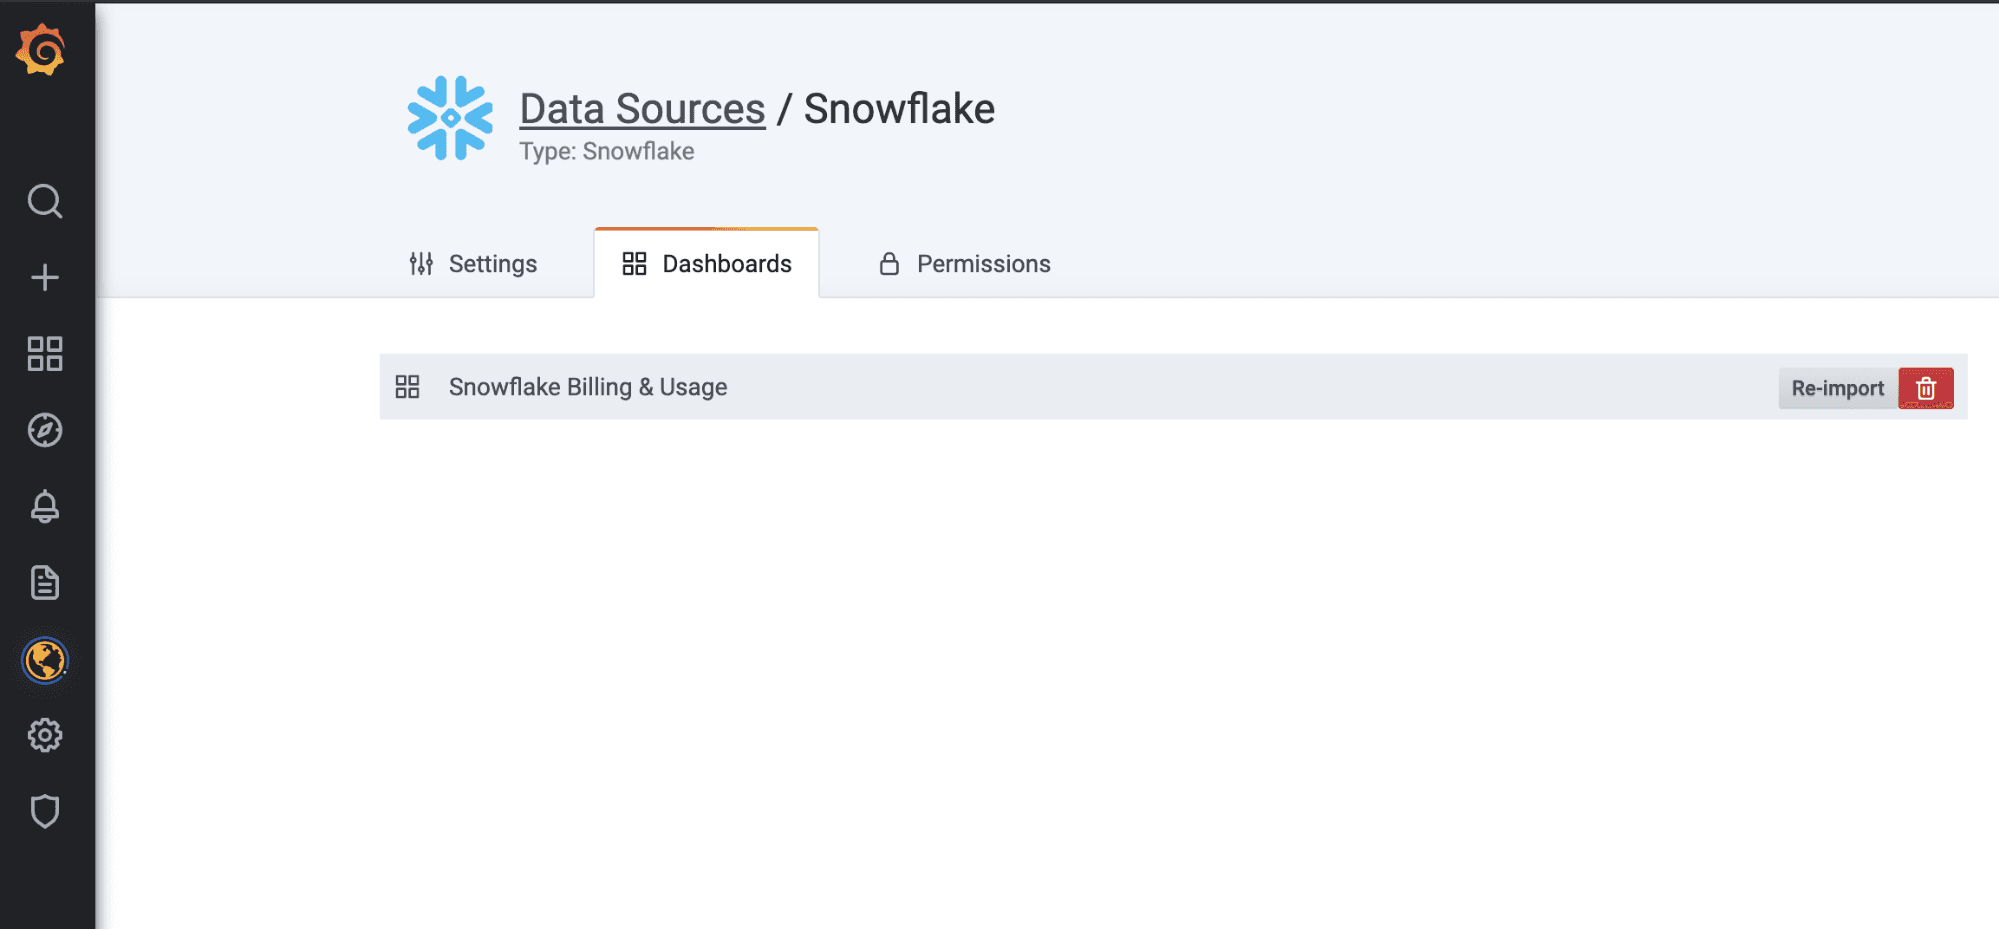
Quick tip: Within the data source, you can import the dashboard we have used in the examples to help get you started with querying, variables, and annotations.
This dashboard shows you useful billing and usage information. It uses the ACCOUNT_USAGE database and requires the querier to have the ACCOUNTADMIN role. To do this securely, you can create a new Grafana data source that has a user with the ACCOUNTADMIN role and select that data source in the variables above.
Learn more
The Snowflake plugin is available for users with a Grafana Cloud account or with a Grafana Enterprise license. For more information or to get started, check out the Snowflake solutions page or contact our team.
If you’re not already using Grafana Cloud — the easiest way to get started with observability — sign up now for a free 14-day trial of Grafana Cloud Pro, with unlimited metrics, logs, traces, and users, long-term retention, and access to one Enterprise plugin.

