The new Wavefront Enterprise plugin brings the high-scale, high-speed SaaS to your Grafana dashboards
This post has been updated to reflect changes in the availability of the Wavefront data source plugin for Grafana Cloud users.
Greetings! This is Eldin reporting from the Solutions Engineering team at Grafana Labs. In previous posts, you might have read about announcing ObservabilityCON or a quick peek inside the recent updates to the ServiceNow plugin. In this week’s post, I am introducing Mike, who will be covering our Wavefront plugin. – Eldin
Hello! Mike J. from Solutions Engineering – one of the newer team members at Grafana Labs. I’m here to showcase another one of our latest favorite Enterprise plugins: Wavefront!
Why Wavefront is special
In early 2020, the Wavefront team was merged into the newly formed “Tanzu” portfolio under VMware’s Modern Applications business unit. Though it’s formally named “VMware Tanzu Observability by Wavefront,” most people still know the product simply as Wavefront, the high-scale, high query-speed metrics observability SaaS with best-in-class histogram support, best-in-class query language, and ease-of-use features for consuming distributed tracing data from Spring Boot applications. For organizations needing scale and speed, it’s really good at what it does. And now that it is a part of the Tanzu portfolio, it integrates with TMC, or Tanzu Mission Control, to manage your Kubernetes clusters. So all in all, very cool tech.
With Grafana’s Wavefront plugin, you can leverage everything you love about Wavefront while still centrally visualizing your other data sources side-by-side. The outcome? That flexible, single-pane view of the underlying metrics that measure the health of your systems and applications to quickly correlate and debug for reduced MTTR.
Out-of-the-box Kubernetes dashboards
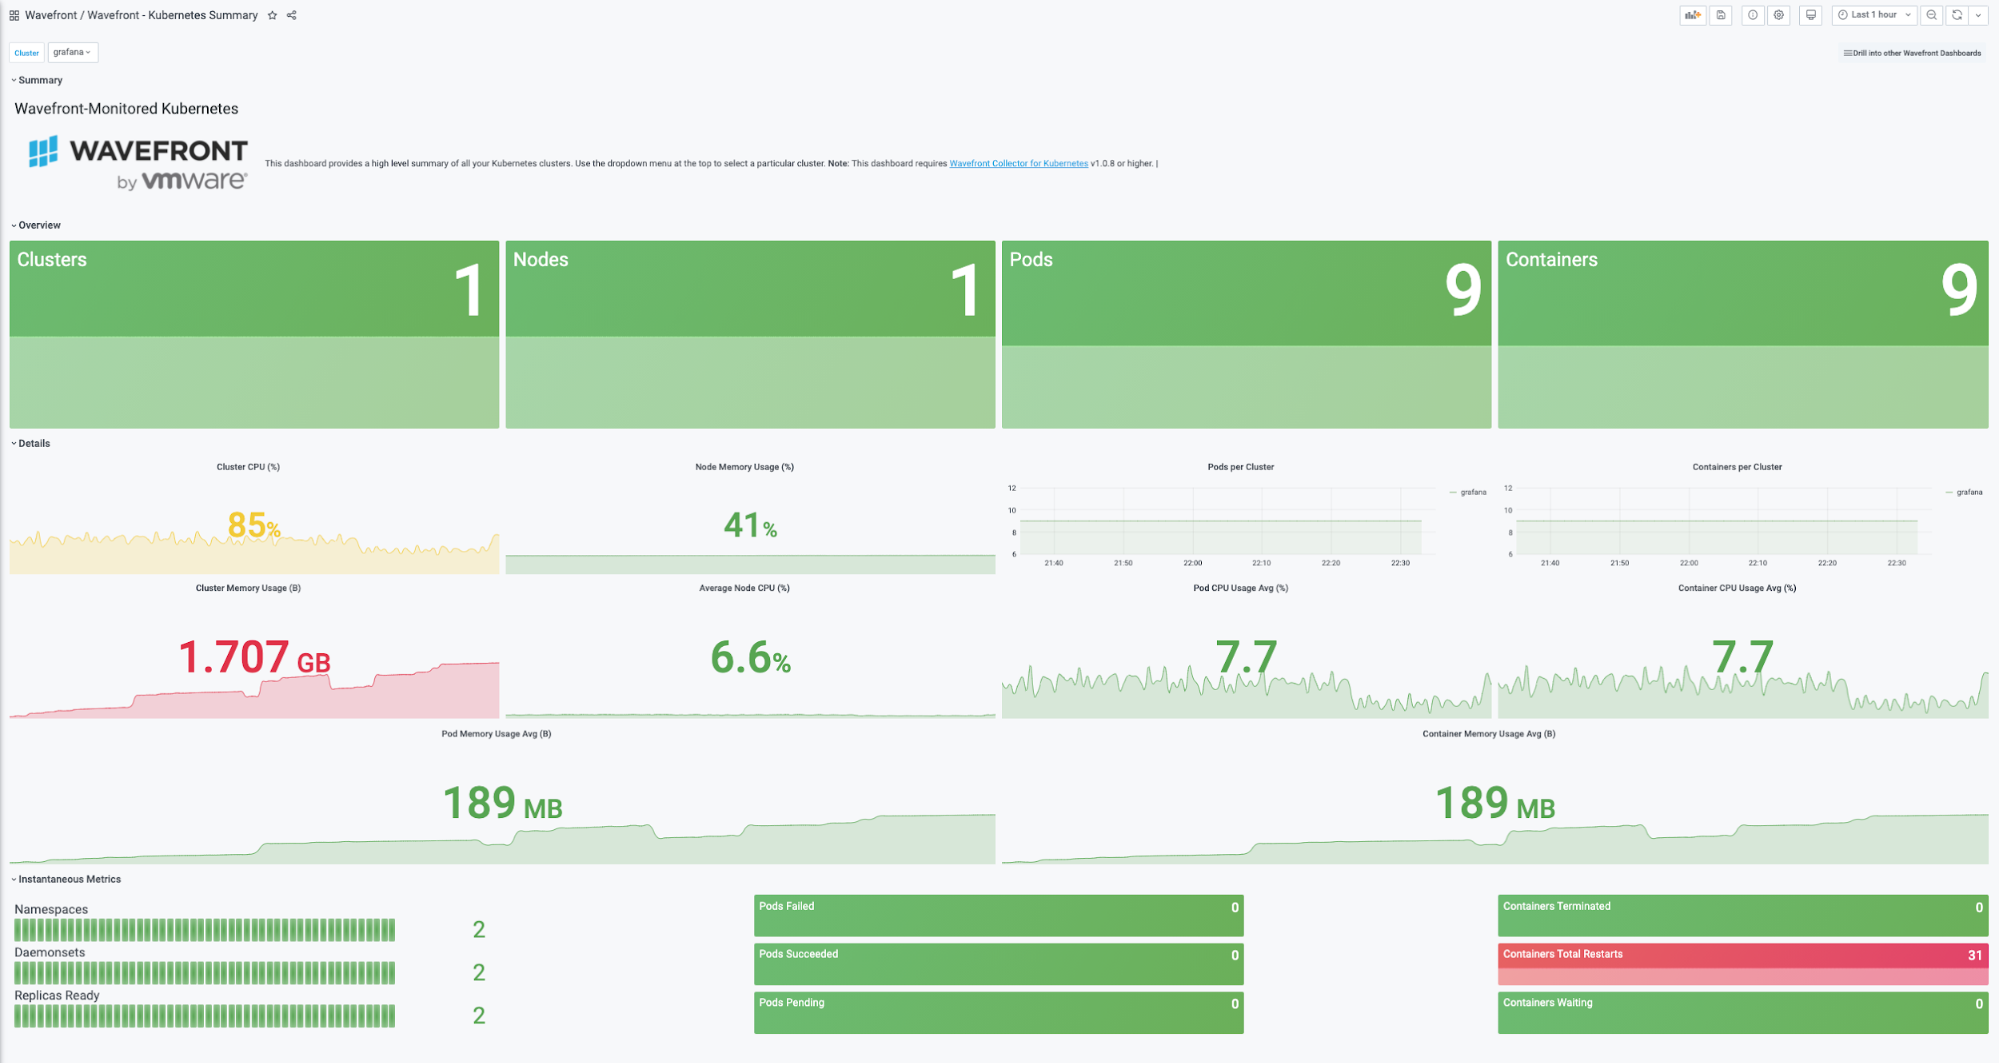
With the release, there are out-of-the-box Kubernetes dashboards. Keep in mind these dashboards are designed to support the Wavefront/Telegraf agent and not Prometheus or other methods of Kubernetes instrumentation (more about that in the “mixed estate” use case below). Below is a quick view of what my Kubernetes-based Wavefront data looks like in Grafana for my personal minikube Kubernetes cluster. First, a summary of the clusters, nodes, pods and containers:
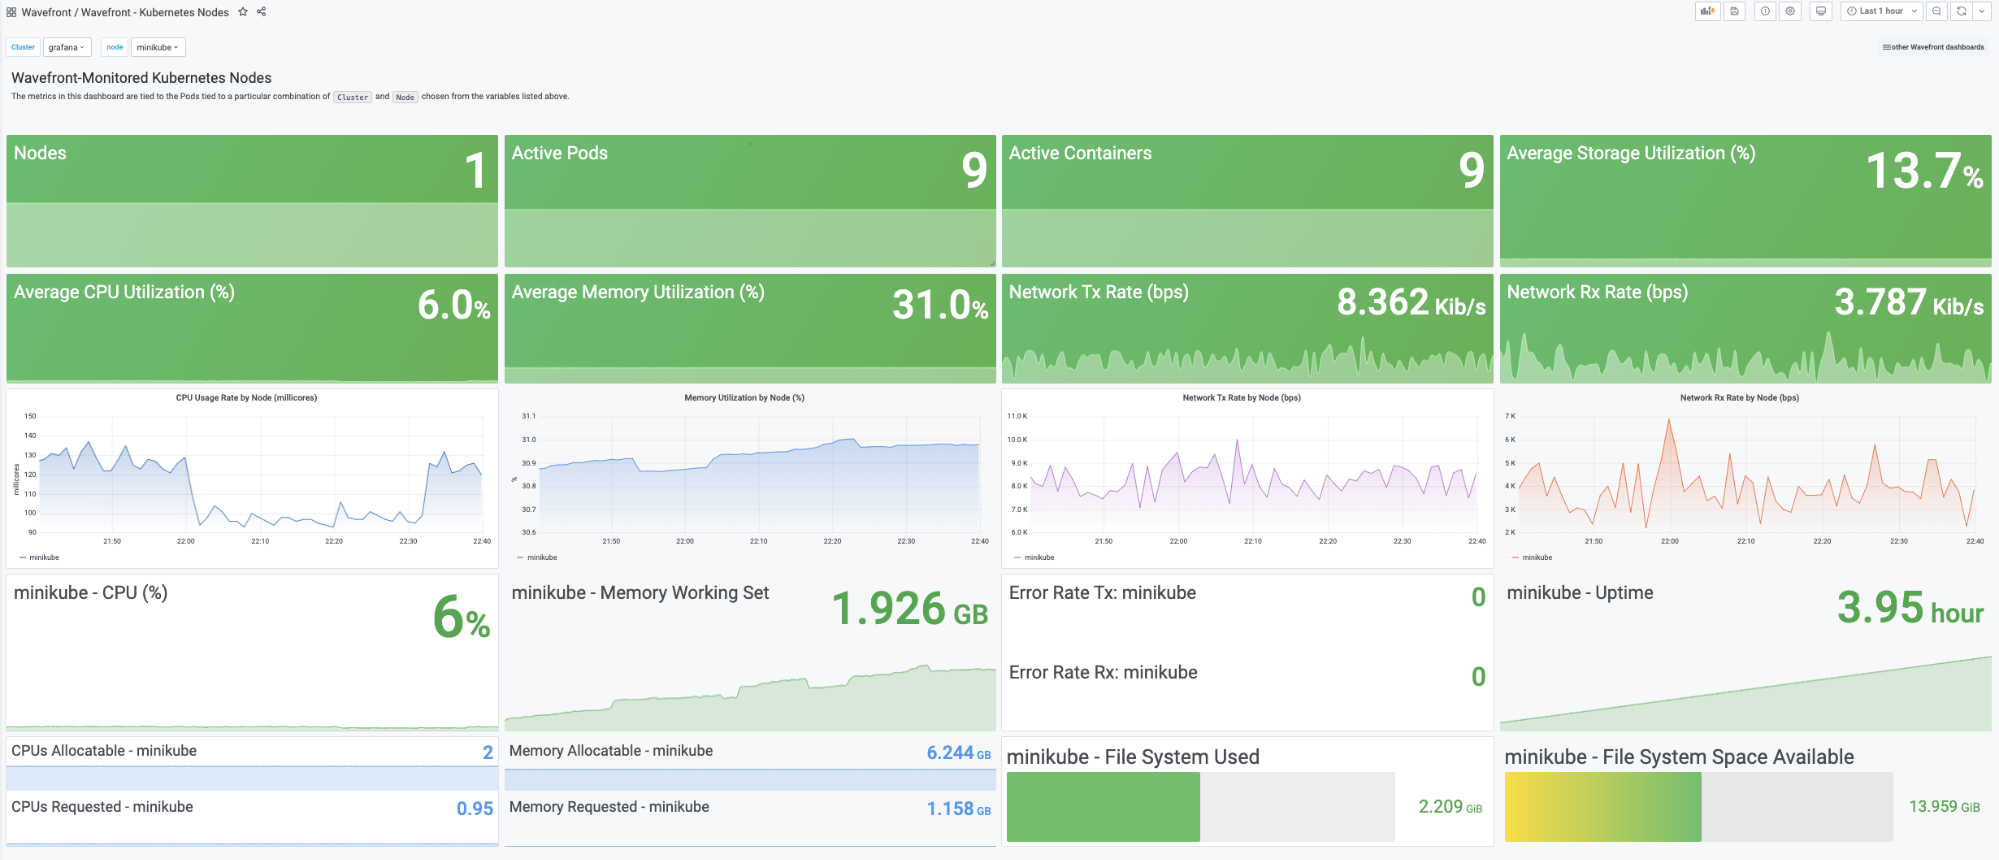
Drilling over to “Nodes,” I get node averages for a cluster as well as per-node metrics over time:
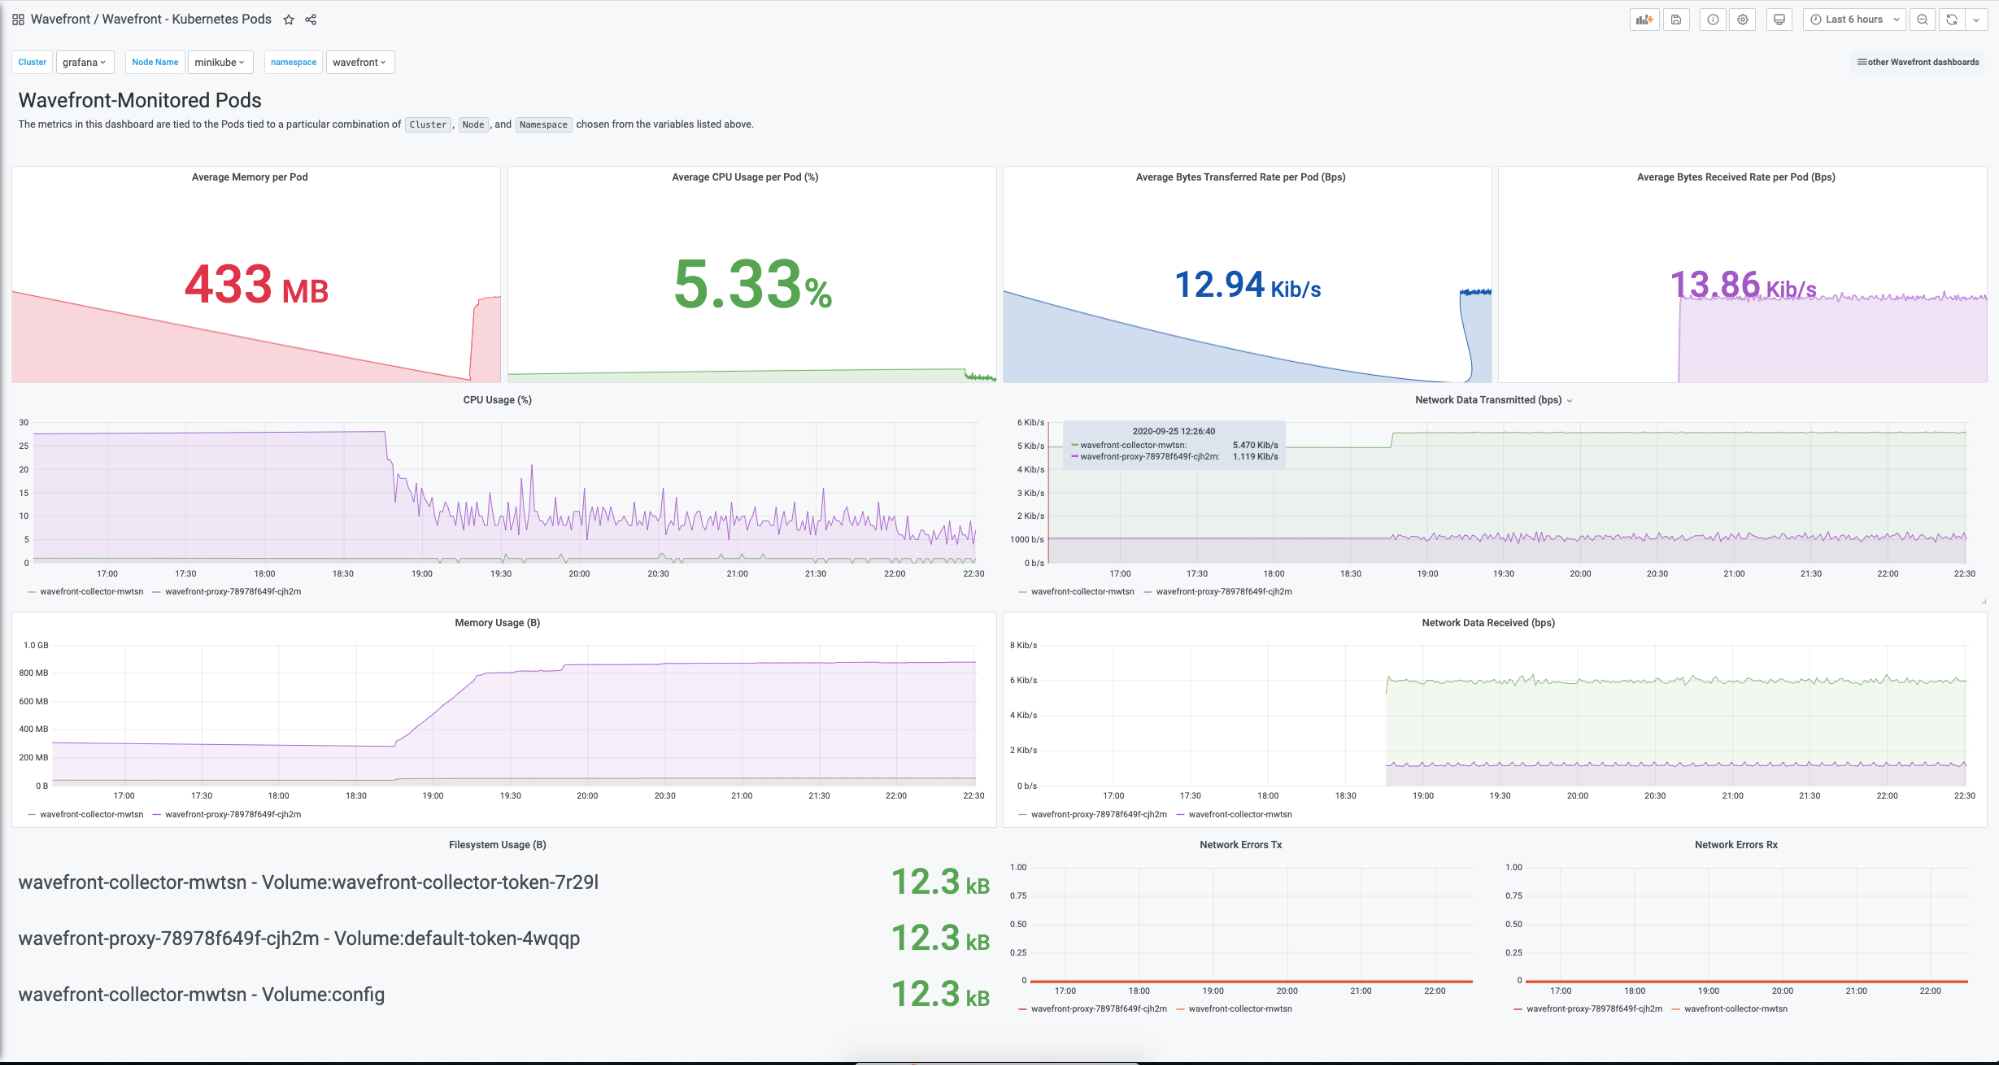
Drilling down to “Pods,” I see more of the same: averages across the pods, and then individual pod details.
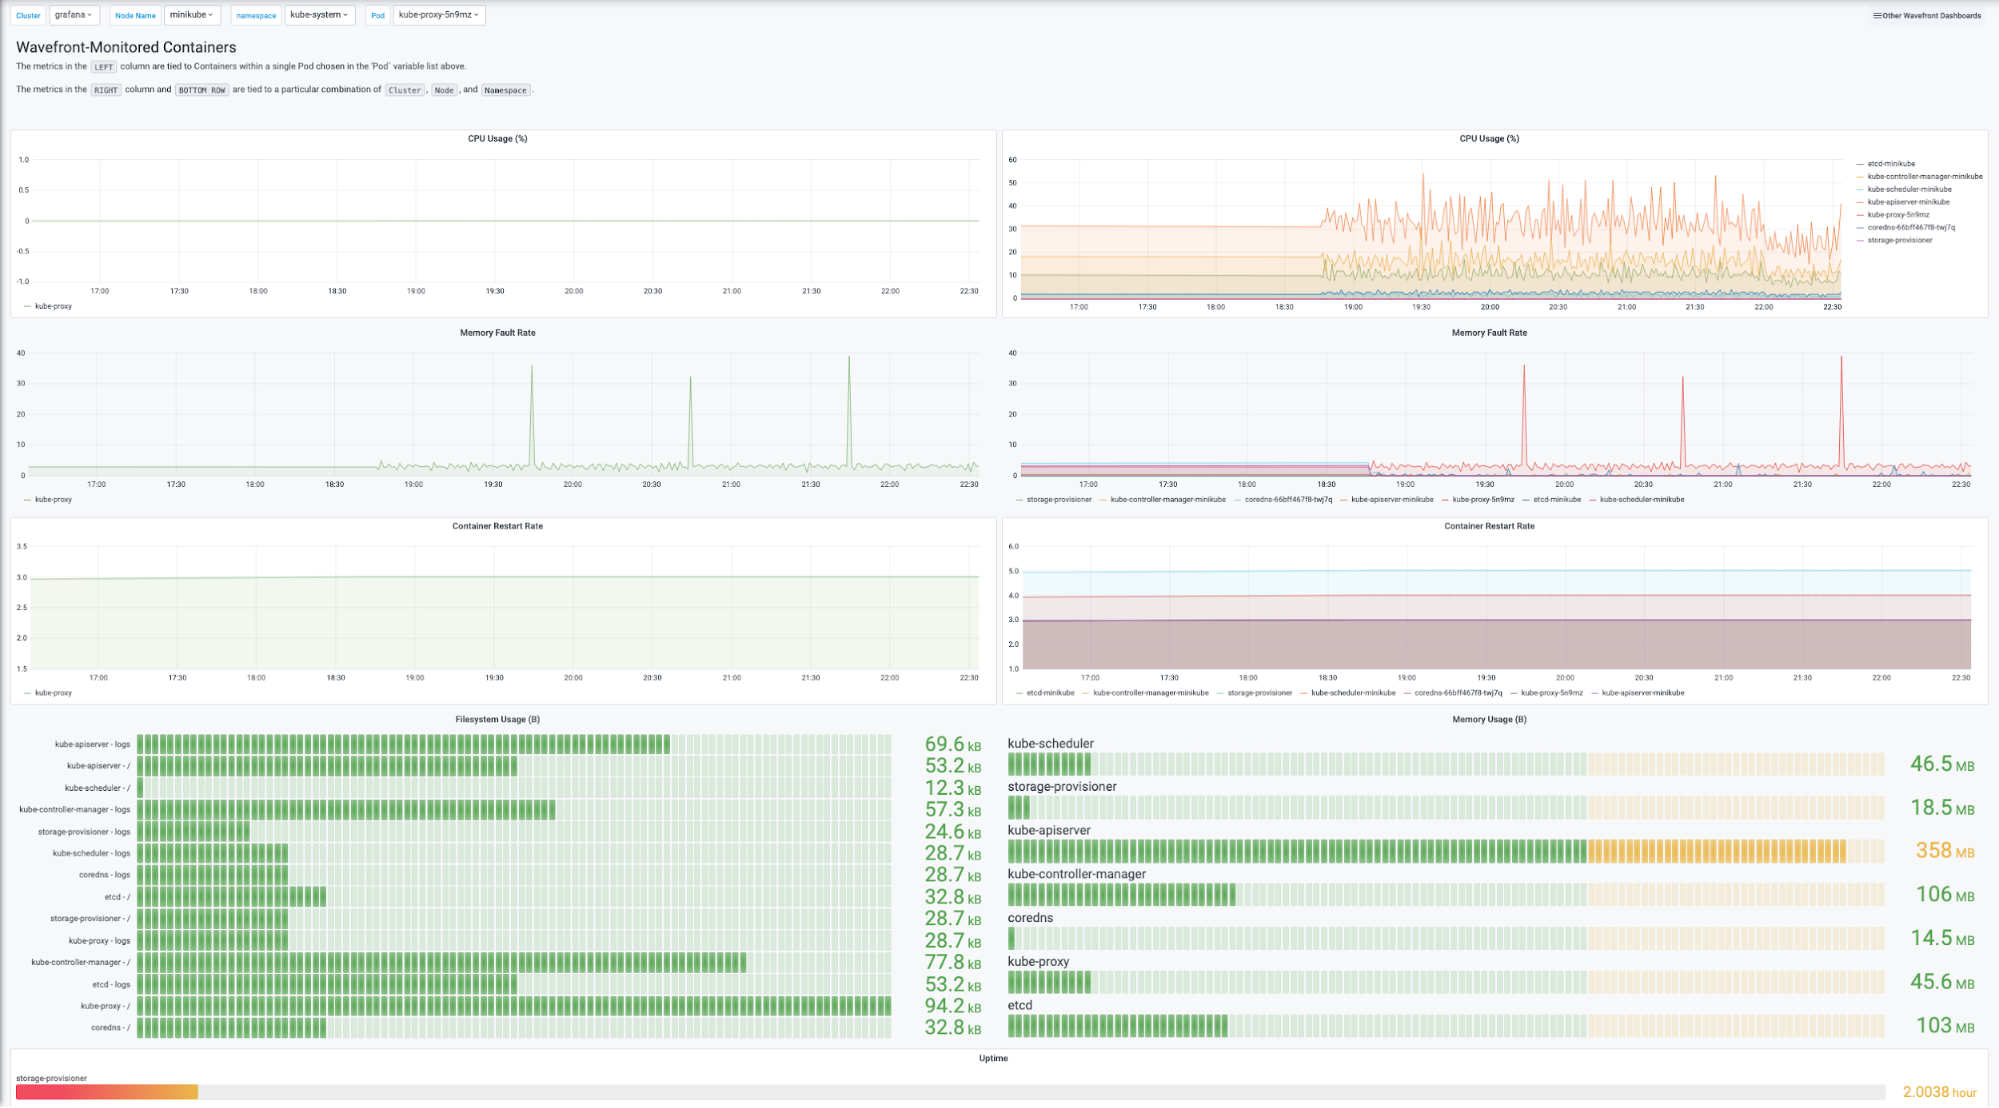
Finally, I drill down to the containers and see container-based metrics (uptime per container has been clipped to save some space here).
Wavefront usage dashboards
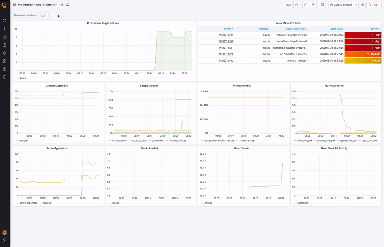
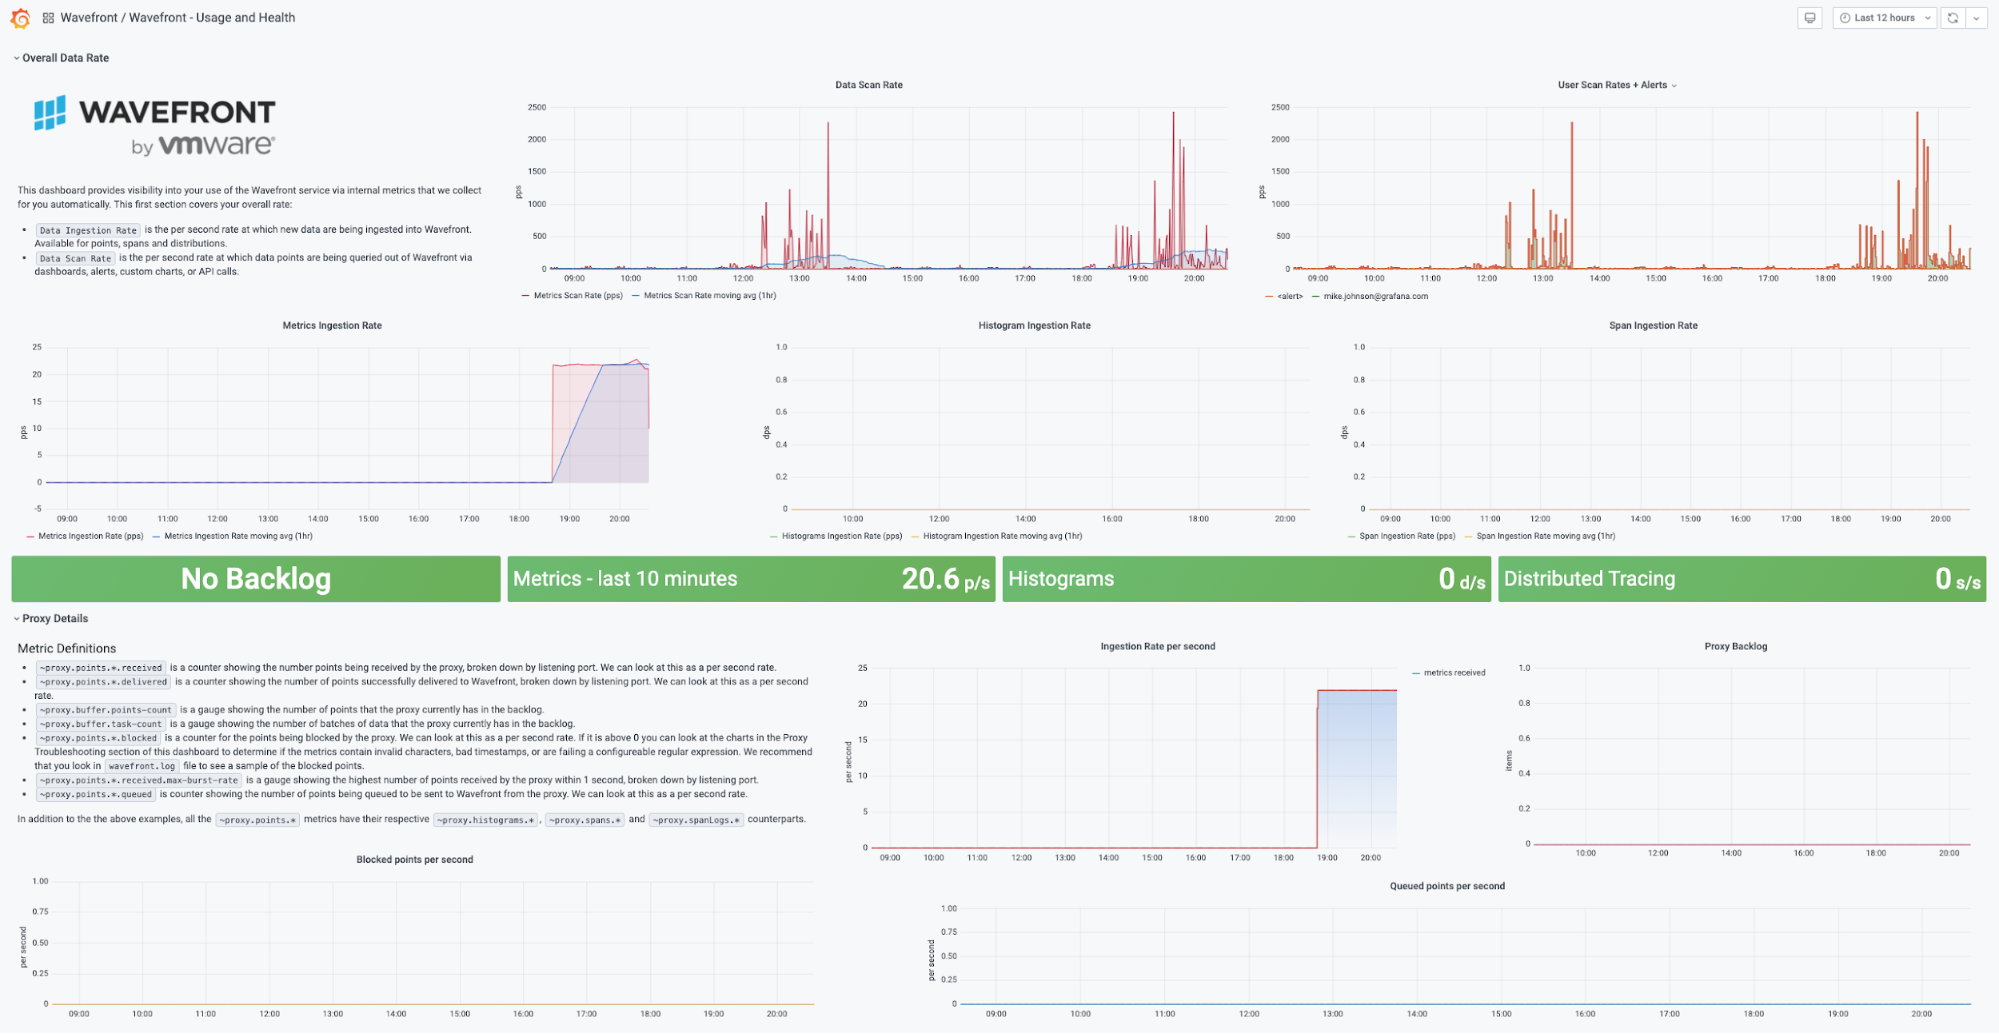
Also included with the plugin are some usage dashboards. The first one shows scan rates, ingest, and proxy metrics. Ingest covers metrics, histograms, and distributed tracing.
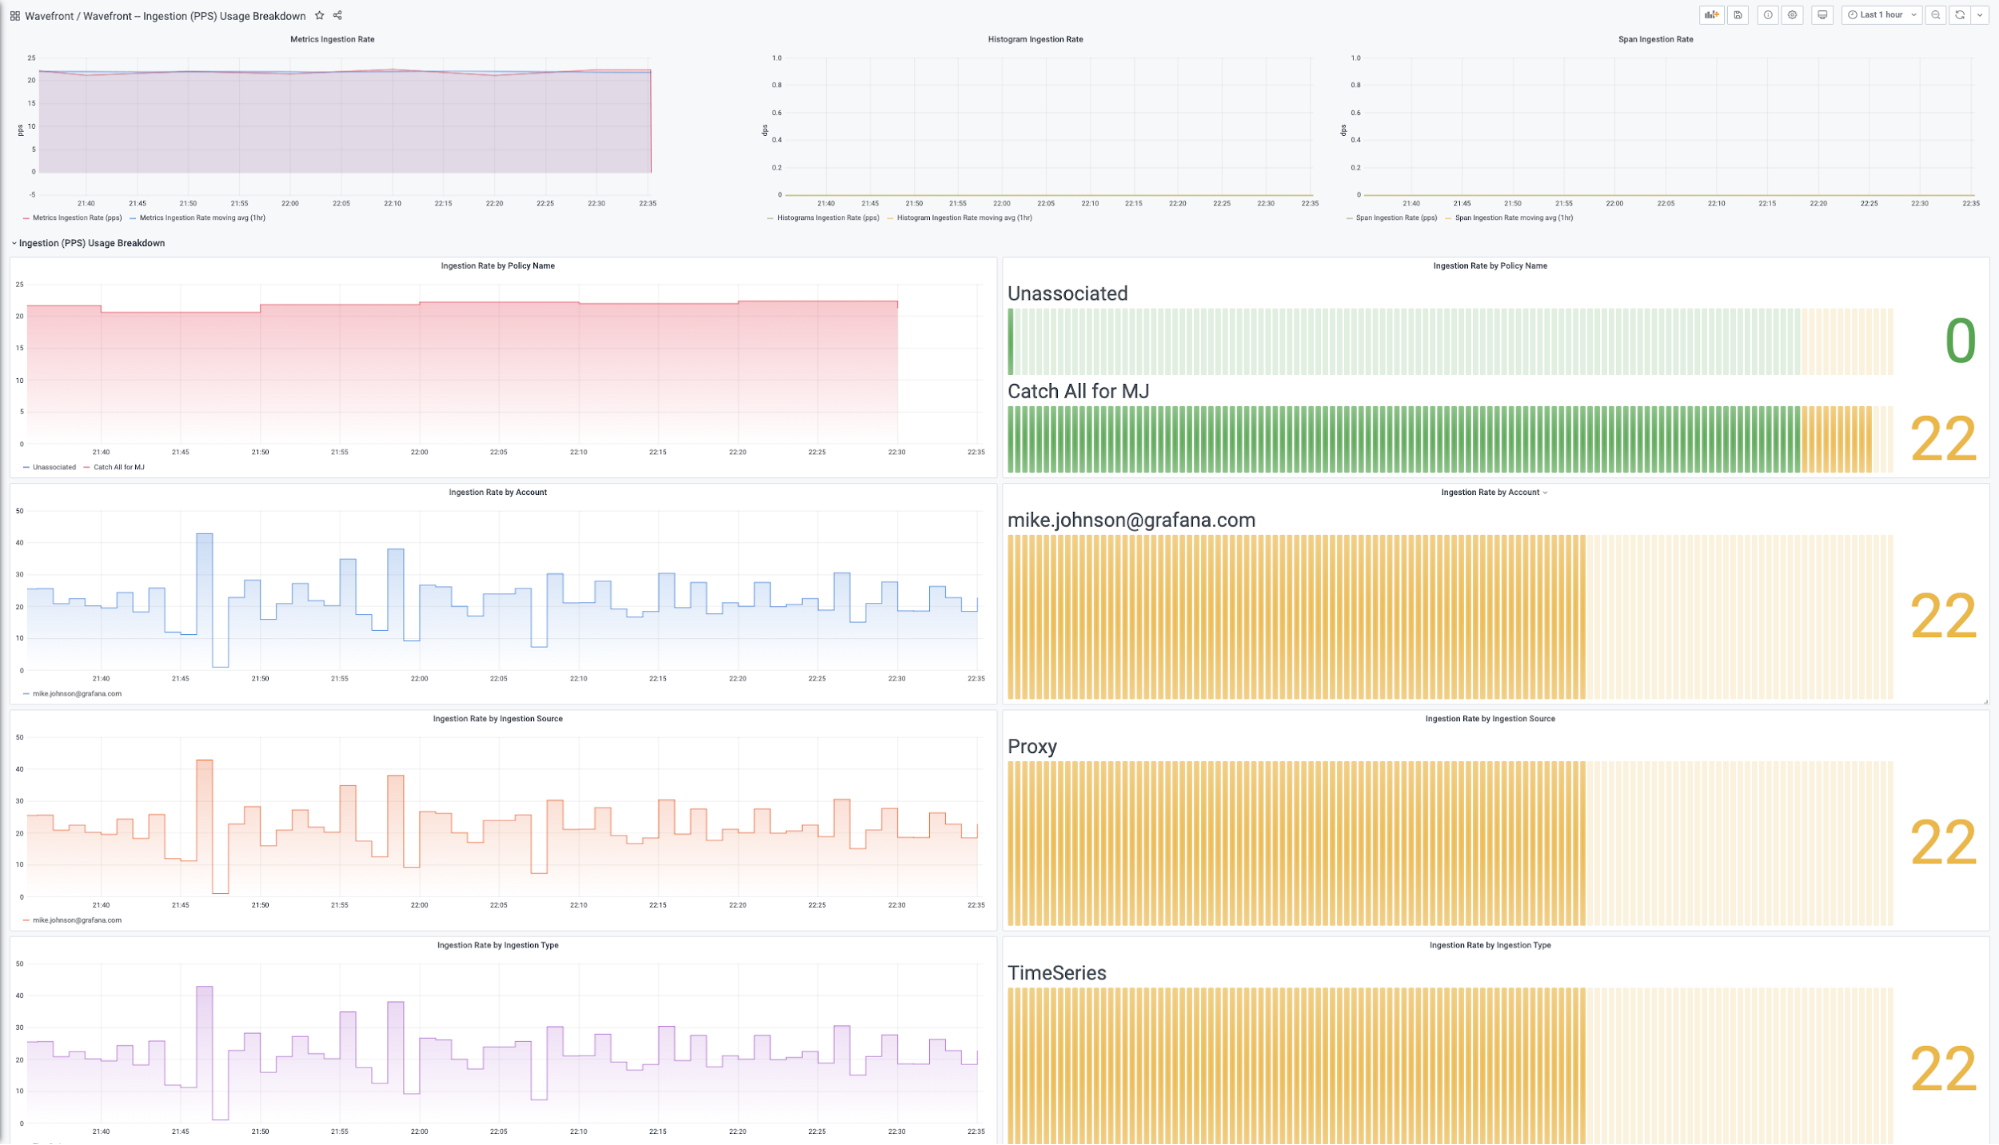
The second dashboard tracks specific ingest by type, source, account, and perhaps most importantly, policy. You’ll find it helpful if you have that one certain team that loves to run “hog wild” and wants to observe everything that emits metrics within their fiefdom.
Use case: Mixed estate
For those Wavefront+Grafana customers who love both: Perhaps Wavefront is not covering your entire estate, but you would still like a unified view. Then this use case is for you.
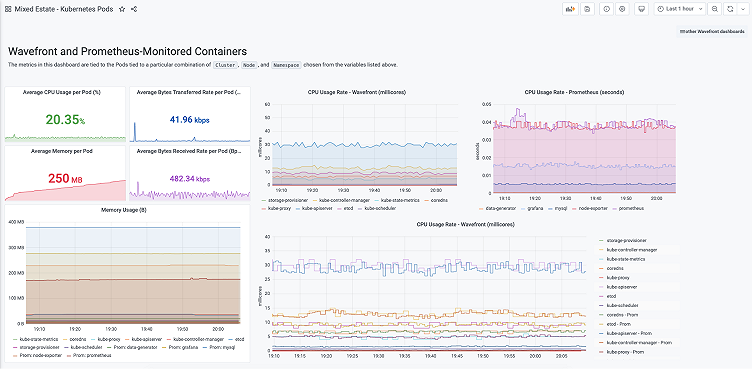
Below, I show a “mixed estate” view of both Wavefront and open source Prometheus. In this view, I show the same Kubernetes cluster (since I only have one), but let’s say the data is coming from two different clusters.
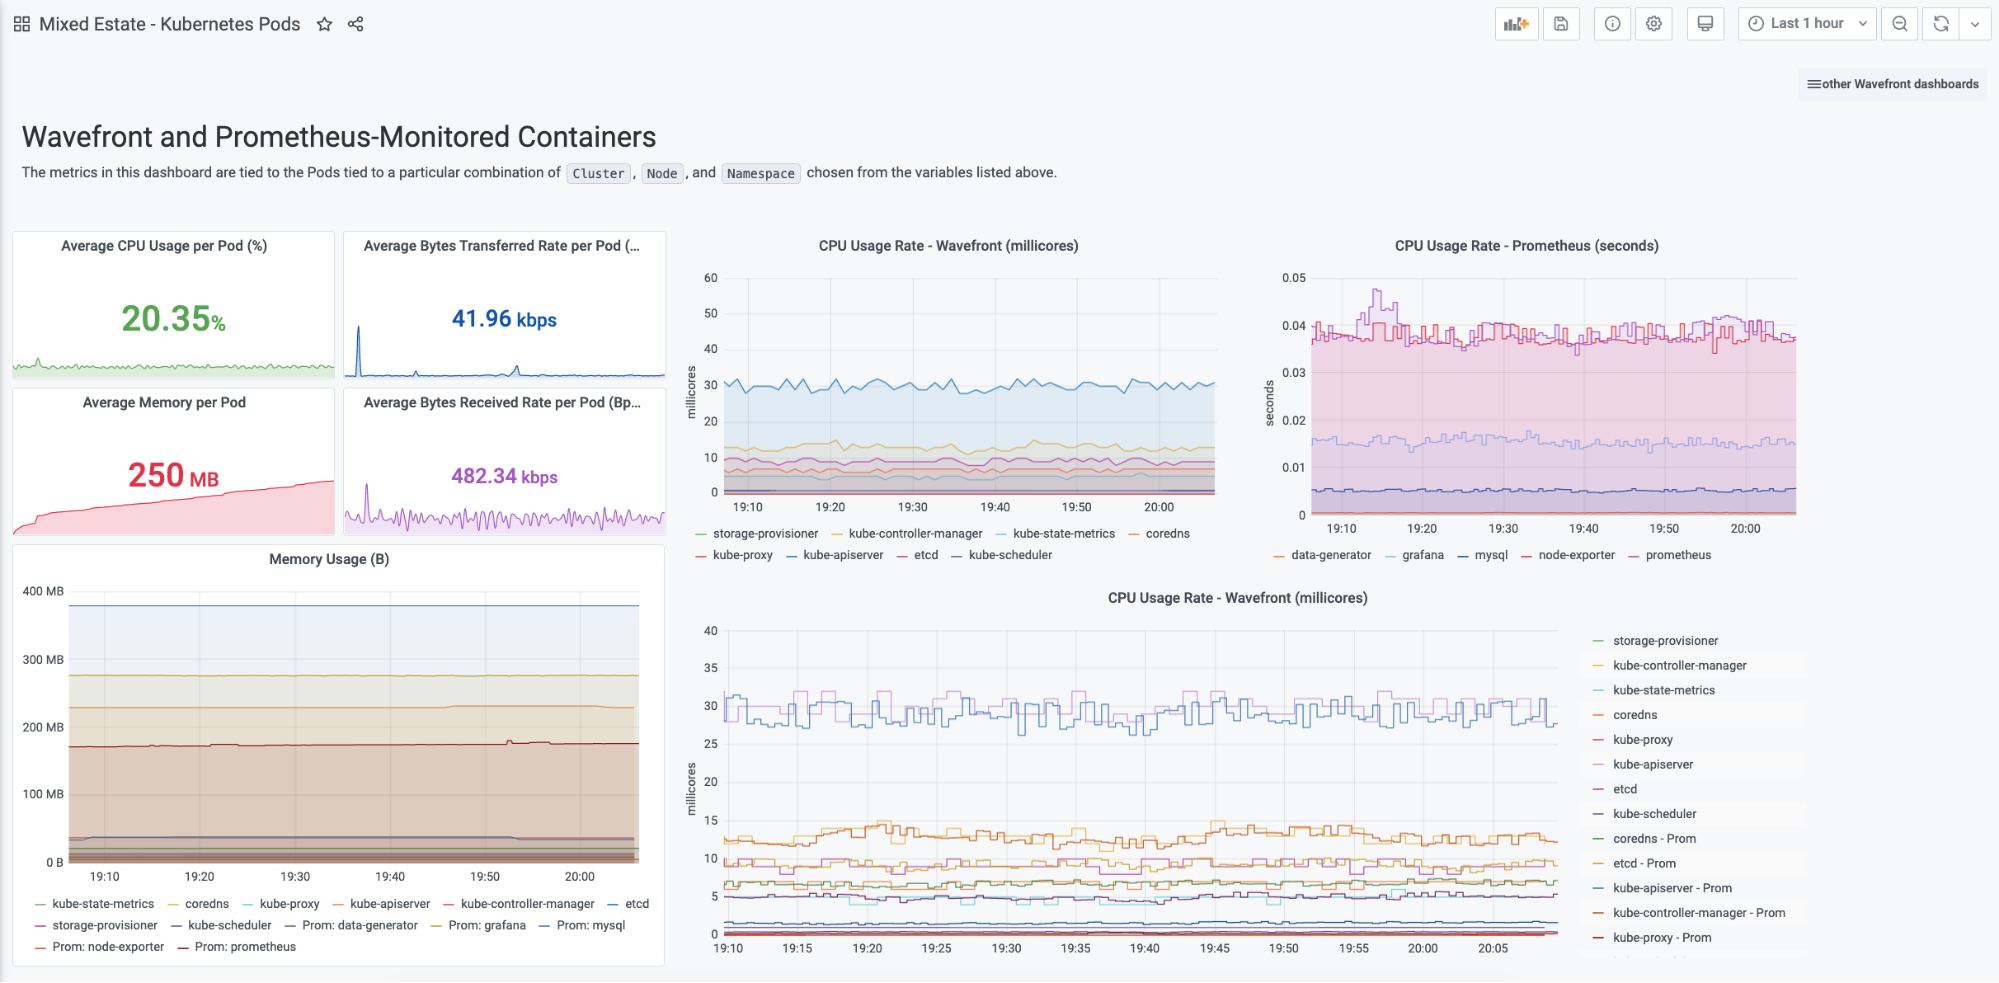
In the dashboard on the right, I have three different CPU graphs for our containers: one from a Wavefront data source, one from a Prometheus data source, and one that combines the two on the same time series graph. While data collection capture rates are different between the two out-of-the-box, you can see the values track each other very closely.
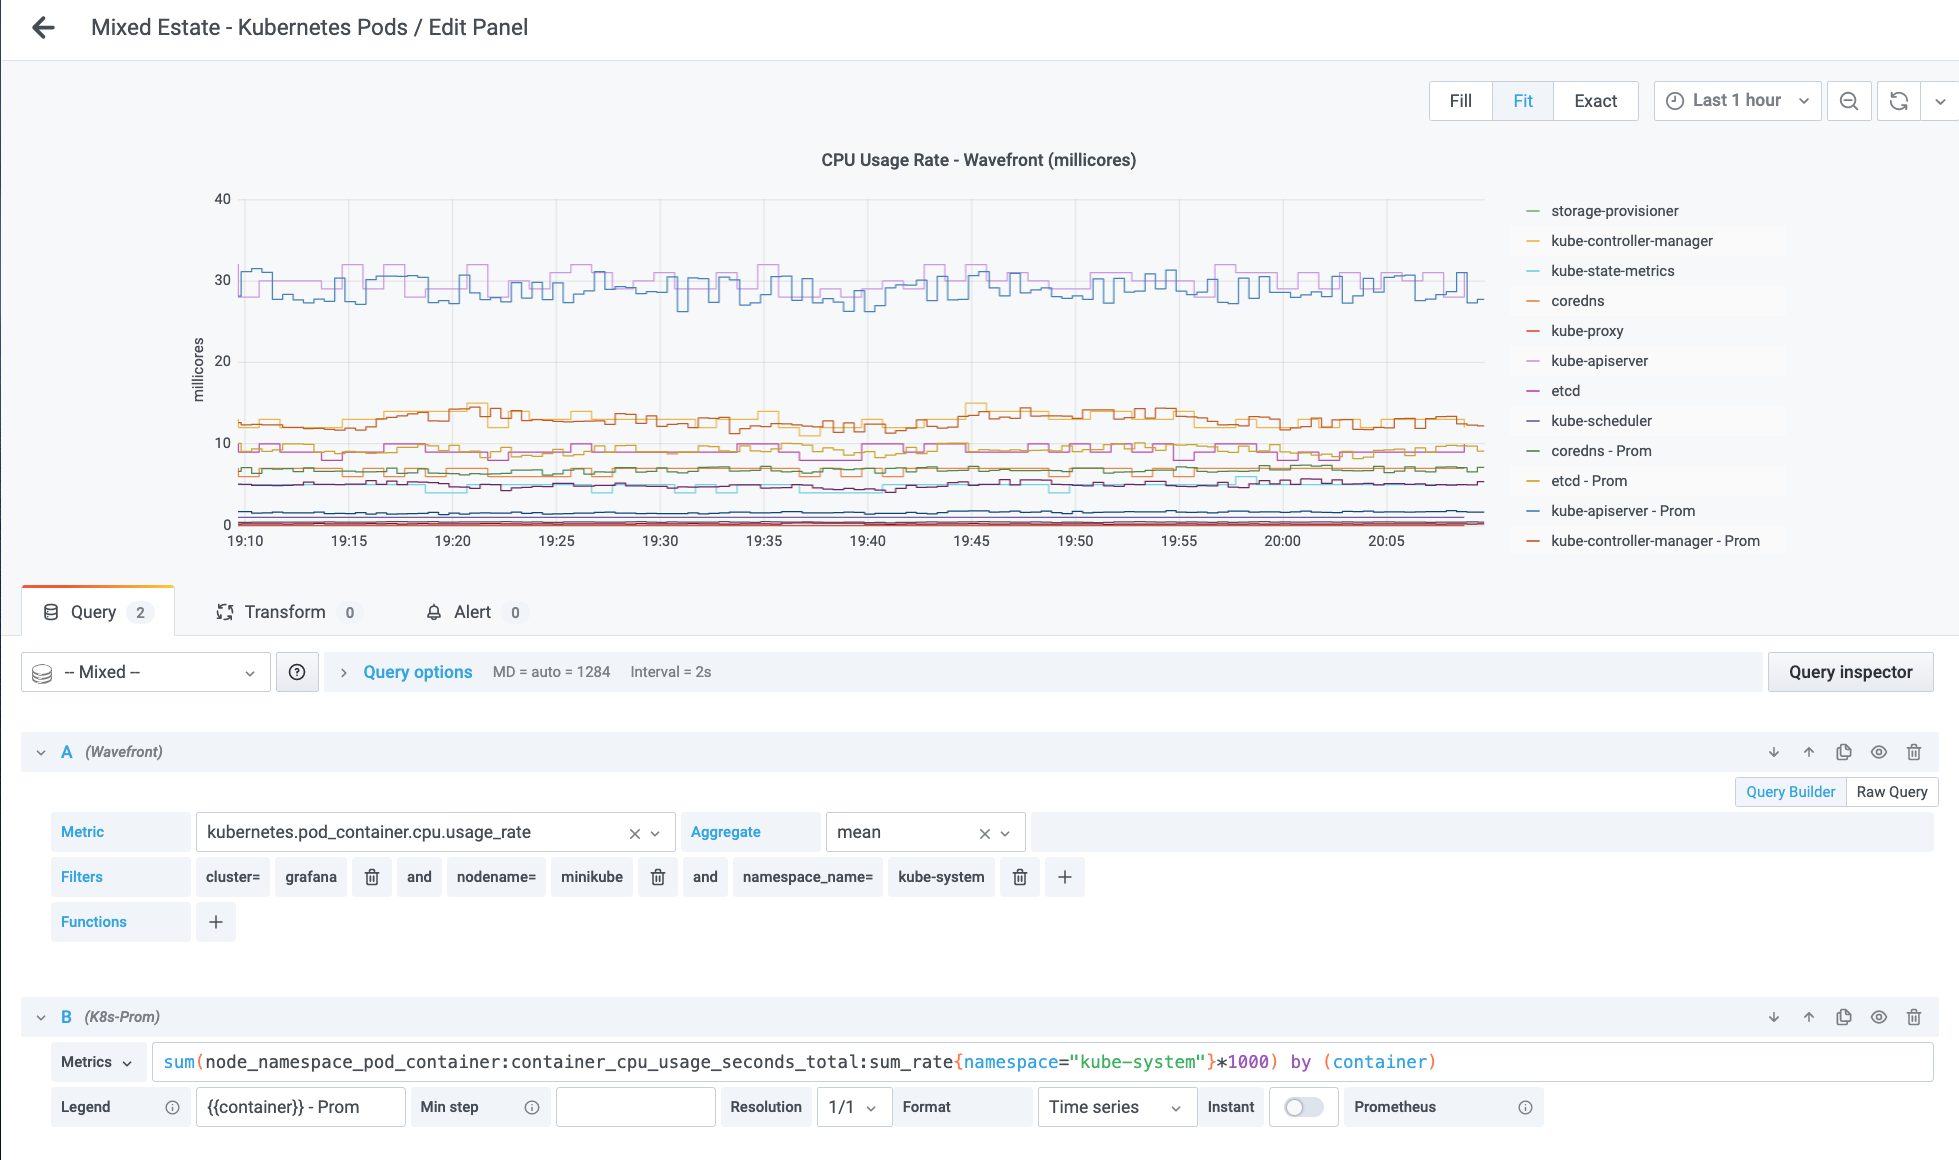
Next is a picture of how to configure two different formulas from two different data sources: First, choose “–Mixed–” in your Query dropdown. Then, we have a Wavefront formula in query A using the Query Builder; and a Prometheus formula in query B.
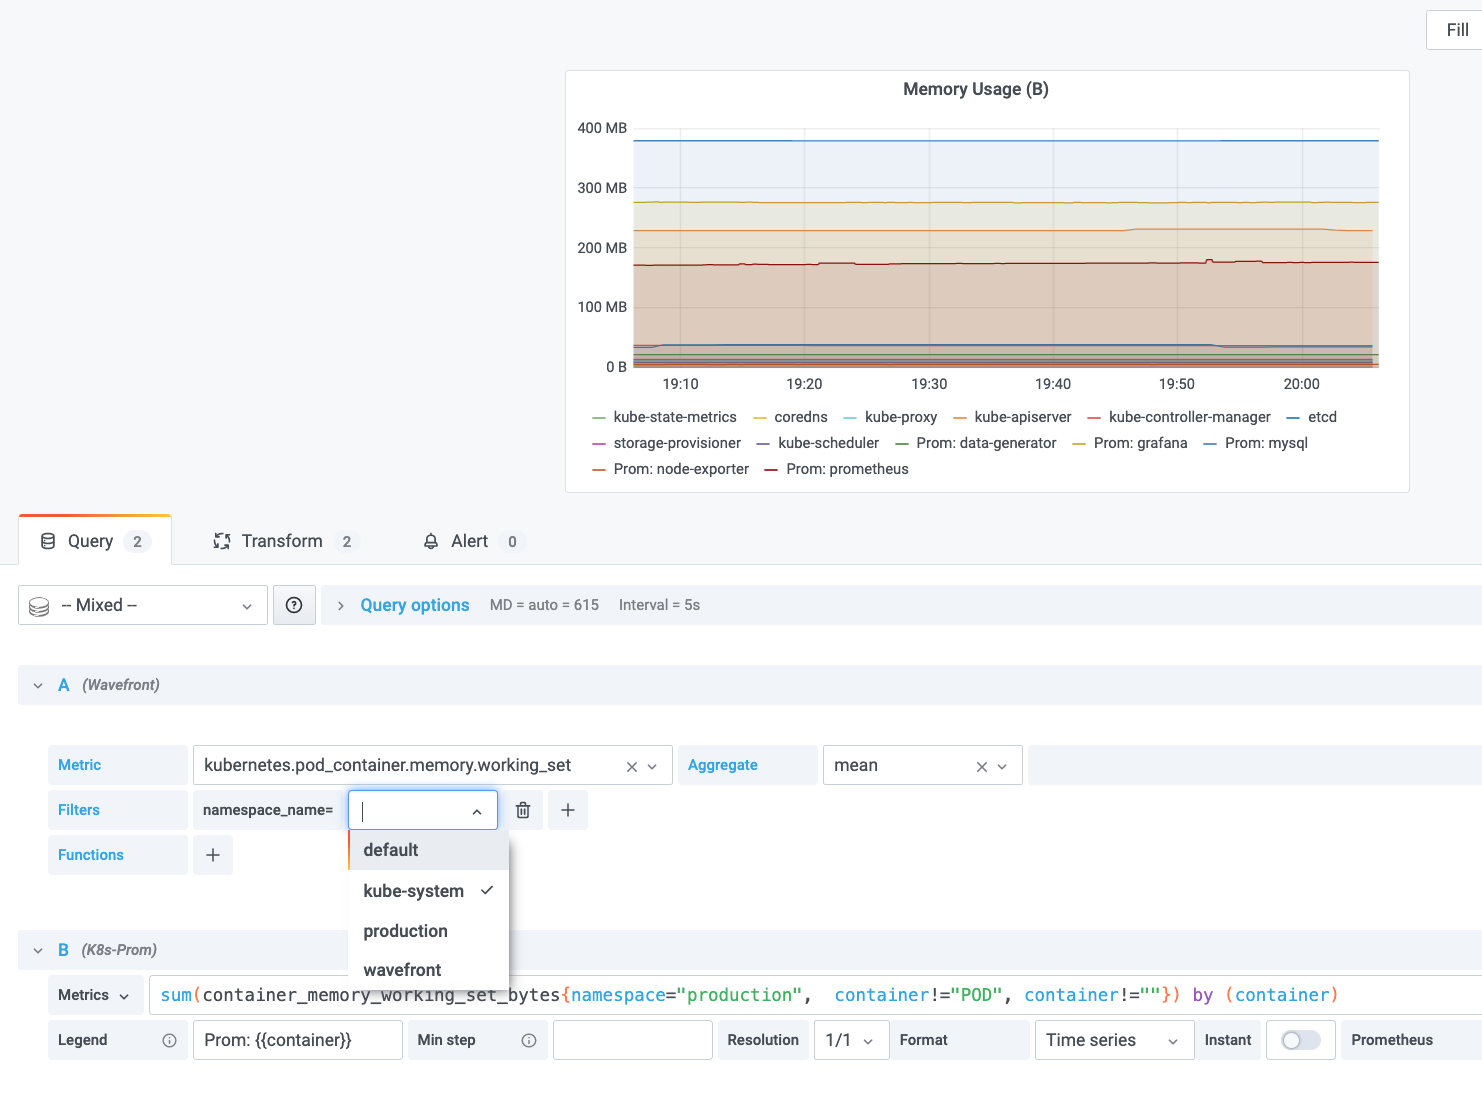
Finally, here is a picture where we show our containers’ memory working set from both data sources. Since the data returns with identical values, I am collecting data for namespace kube-system with Wavefront and namespace production with Prometheus.
Getting started
It is easy to get started. Once you’ve installed the Wavefront plugin into Grafana, configure Wavefront as a data source by going to Configuration > Data Sources > Add data source. Add your authentication details, and the data source is ready to query!
Much like Wavefront itself, Grafana’s query editor supports two modes: Raw Queries and a point-and-click Query Builder. If you are not familiar with Wavefront, the Query Builder is definitely the way to go. If you are a Wavefront veteran, raw mode queries will make you feel right at home as they provide the same syntax to which you are accustomed.
Dashboard variables
Template variable setup with the Wavefront plugin is super powerful. Using variables enables a dynamic navigation experience for your end users. The Wavefront plugin supports a number of different types of variables, including metrics, data sources, sourceTags, matching sourceTags, tagNames, and tagValues. In the Kubernetes dashboards, variable type tagValues is used to allow the user to choose a combination of cluster, node, namespace, and pod, depending upon the specific Kubernetes dashboard.
To set up a dashboard variable, the process is simple as well. The syntax used for tagValue is tagValues(<your_tag_name>): ts("<your_timeseries_of_interest>"). In the Kubernetes example for adding a nodename as a variable the syntax would be: tagValues(nodename): ts("kubernetes.pod.filesystem.usage").
Some quick tips
- Click on the Permissions tab to enable data source permissions, an Enterprise feature that allows you to control who can see and query your specific Wavefront data sources.
- If you need some help with remembering the names and branches of your metrics when forming a Wavefront query, use the plugin’s autocomplete support.
- Definitely take advantage of the plugin’s support for annotations. Annotations are alert overlays on a time series graph. Annotations are displayed in a pop-up window, showing the alert name and a direct link to the alert in Wavefront.
The Wavefront Enterprise plugin is available for users with a Grafana Cloud account or with a Grafana Enterprise license. For more information and to get started, check out the Wavefront solutions page or contact our team.
If you’re not already using Grafana Cloud — the easiest way to get started with observability — sign up now for a free 14-day trial of Grafana Cloud Pro, with unlimited metrics, logs, traces, and users, long-term retention, and access to one Enterprise plugin.

