Introducing the AWS X-Ray integration with Grafana
In collaboration with the AWS team, we have just launched another AWS integration, the X-ray data source. Combined with the CloudWatch and Timestream integrations, the AWS X-Ray data source simplifies monitoring and triaging with one Grafana console.
The addition of the AWS X-ray data source reflects Grafana’s commitment to becoming a full observability platform that supports distributed tracing as well as metrics and logs. This is our third tracing integration, after Jaeger and Zipkin, which have had native support since Grafana 7.0.
For those who don’t know about AWS X-Ray, it is a service that helps you analyze and debug distributed applications, such as those built using a microservices architecture. AWS X-Ray can be used to identify causes of performance issues and errors, debug and triage distributed applications, and better understand how your applications and services work.
For more information about AWS X-Ray and how you can leverage it for your use case, see the announcement blog post or the official documentation. Read more about the collaboration with Grafana Labs here.
How to get started
The X-Ray data source is compatible with Grafana version 7.2+ in open source or Enterprise.
You can visit our plugins page to download the X-Ray data source plugin or install it on your Grafana Cloud instance.
Features
To understand how the X-Ray plugin works, it is important to know that the AWS X-Ray service isn’t just a simple store for traces. It also enables searching and running more advanced analytical queries on top of your traces. With the X-Ray data source plugin, we tried to leverage all those features in a way that gives the most value while at the same time still being familiar to Grafana users.
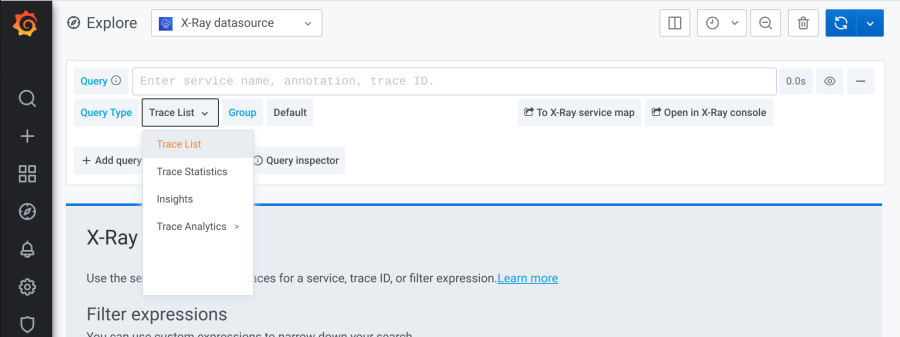
With the X-Ray query editor, you can choose what kind of query you want to run. Each query type gives you different capabilities and outputs and maps to some subset of the AWS X-Ray console UI, so you are able to access all of your AWS X-Ray data within Grafana for exploration, dashboarding, and alerting.
Trace list
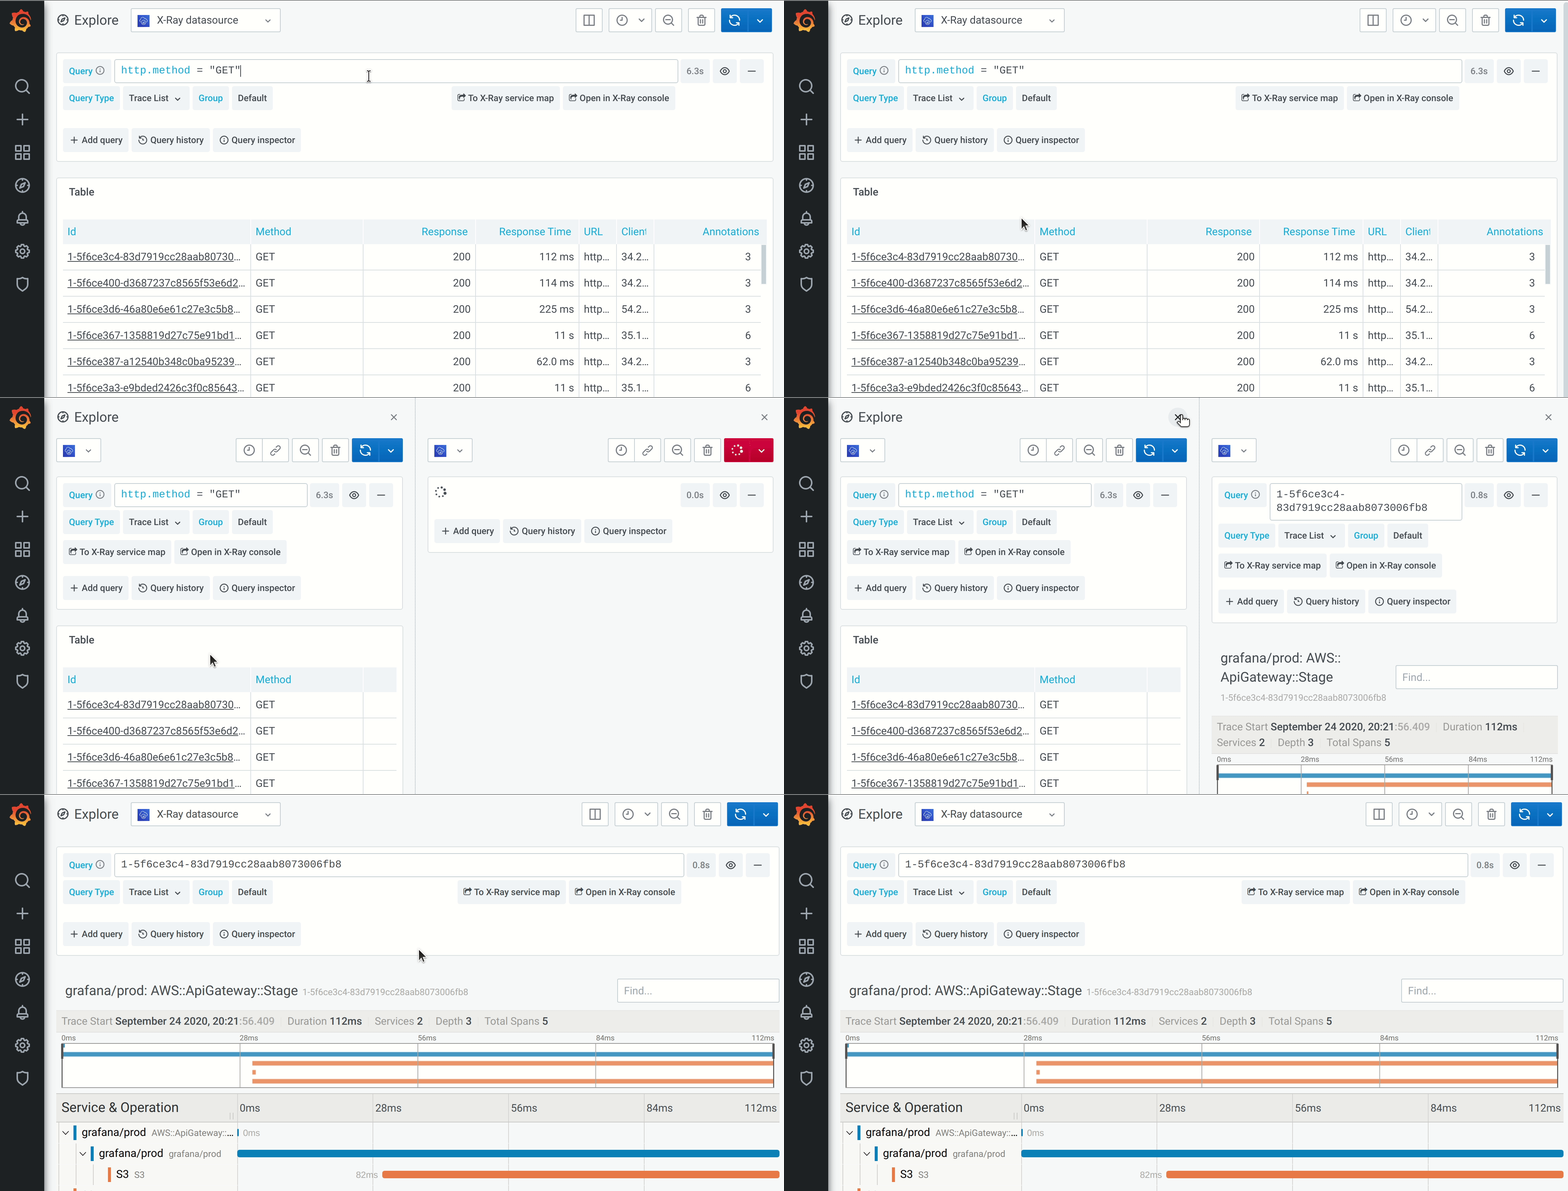
This query type is the main way to access your traces from AWS X-Ray, and it will give you a list of traces based on the query and selected group. This list of traces is linked to our Trace View, which we introduced in Grafana 7.0 to make navigation much more intuitive. At the same time, if you already have a trace ID at hand, you can search it directly by inserting it into the Query field. This Query type corresponds to the Traces and Trace detail view in the AWS X-Ray console. See the AWS X-Ray documentation for more information about how to use its query language to get exactly the traces you want.
Trace statistics
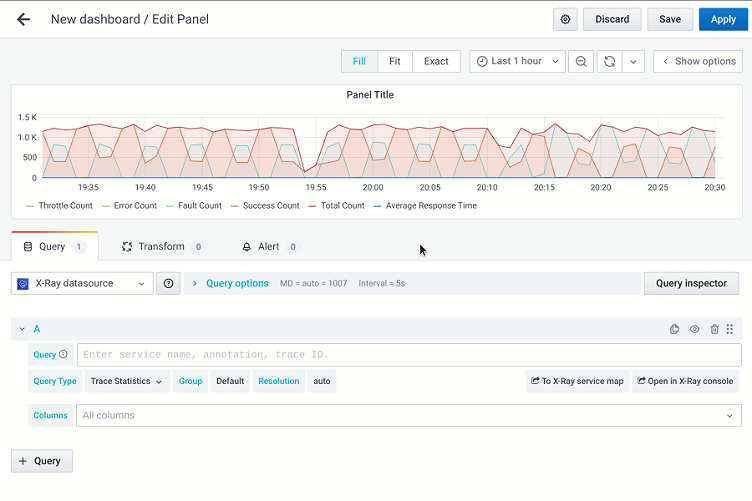
Now we are getting into the more advanced capabilities of AWS X-Ray. In addition to search and list traces, we can actually show you time series data about your traces, which can then be used in graphs and alerts. This way you can visualize things like error count, throttles, or average response time of your traces over time. This is a powerful feature that works well with Grafana, enabling users to visualize specific trace metrics and alarm on application performance.
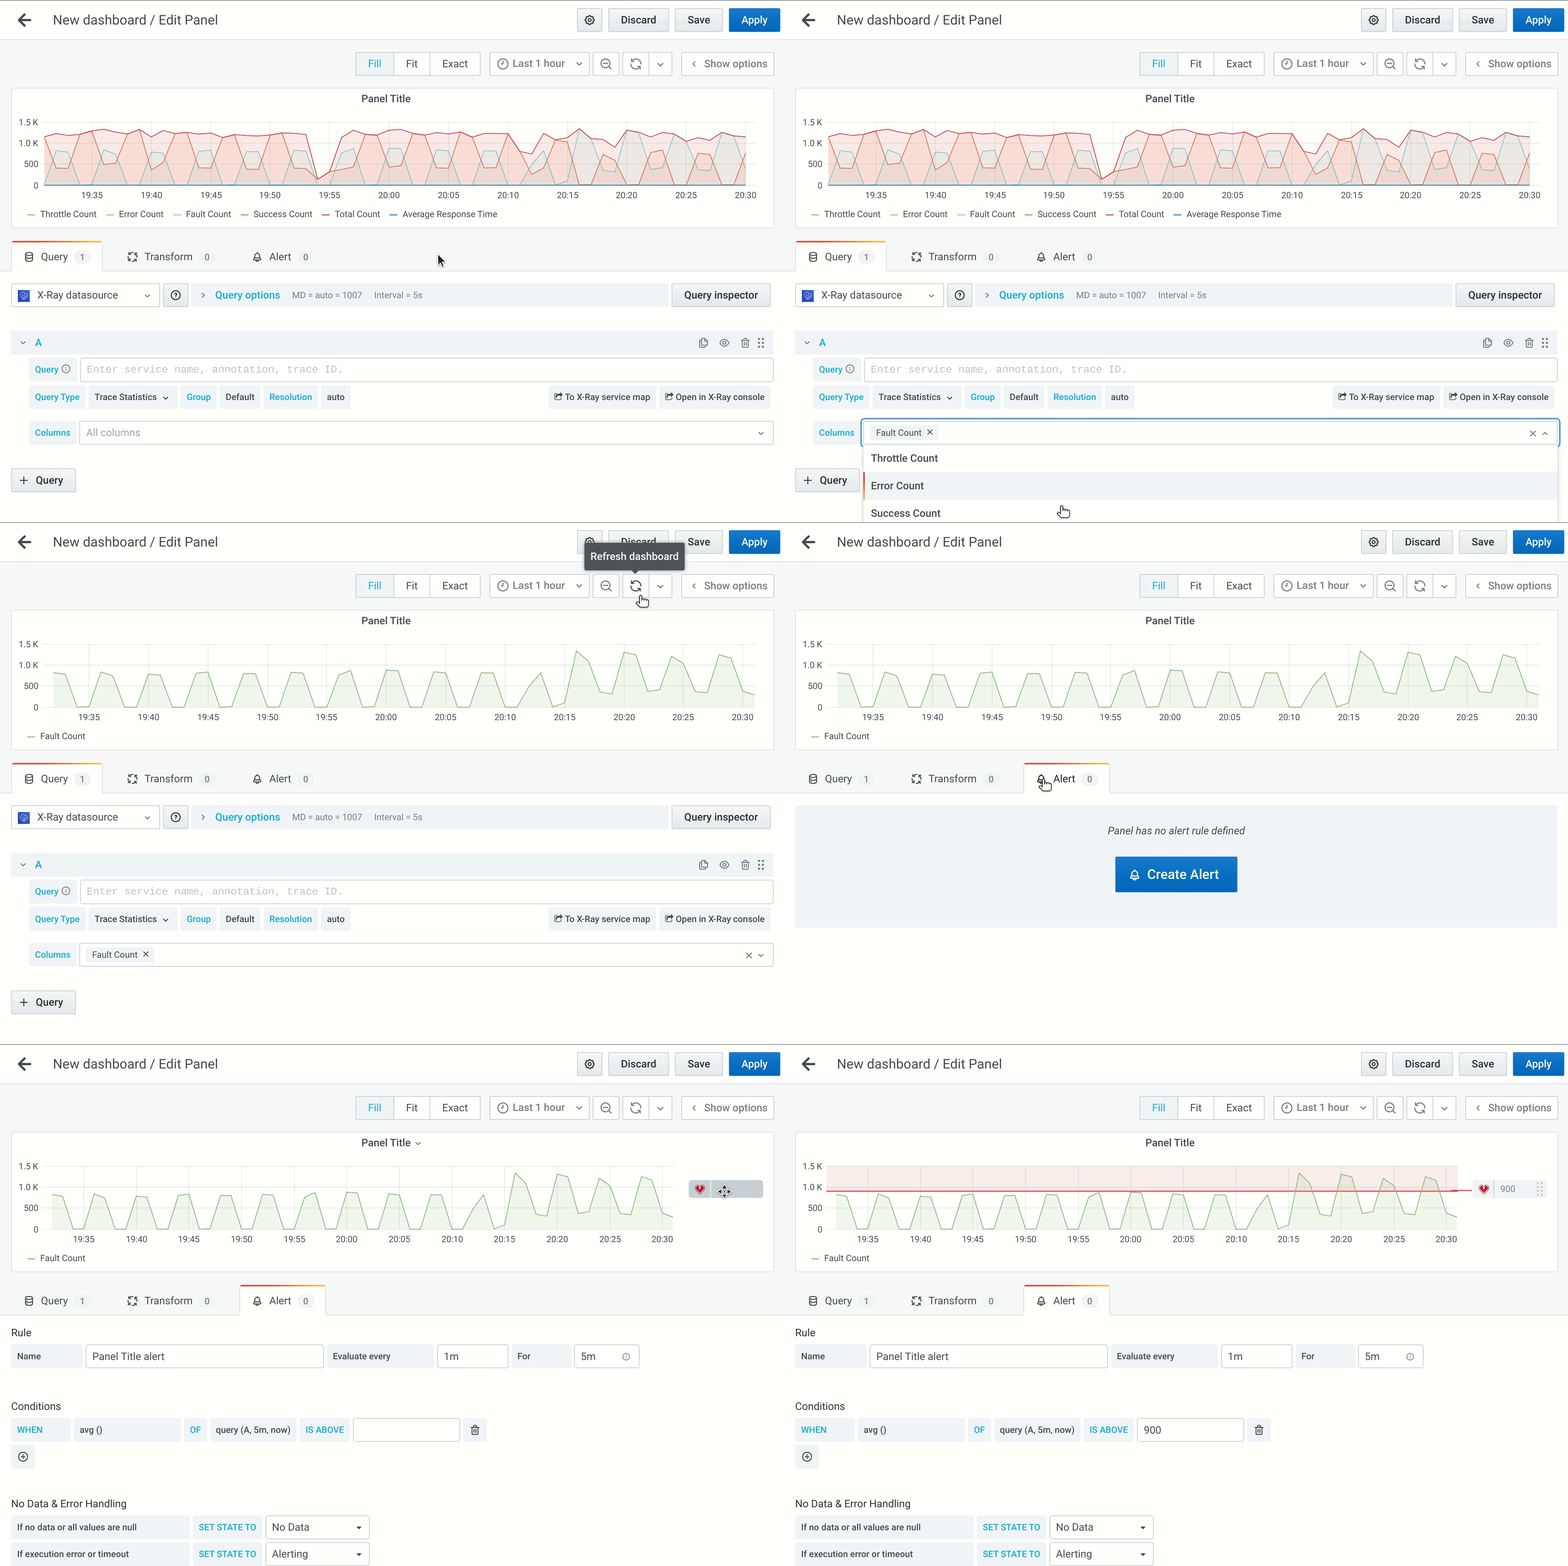
In addition to Query and Group for filtering which traces will be used for the aggregations, you can choose between 60s, 300s, and Auto Resolution to customize how it will be aggregated and which columns should be returned.
Insights
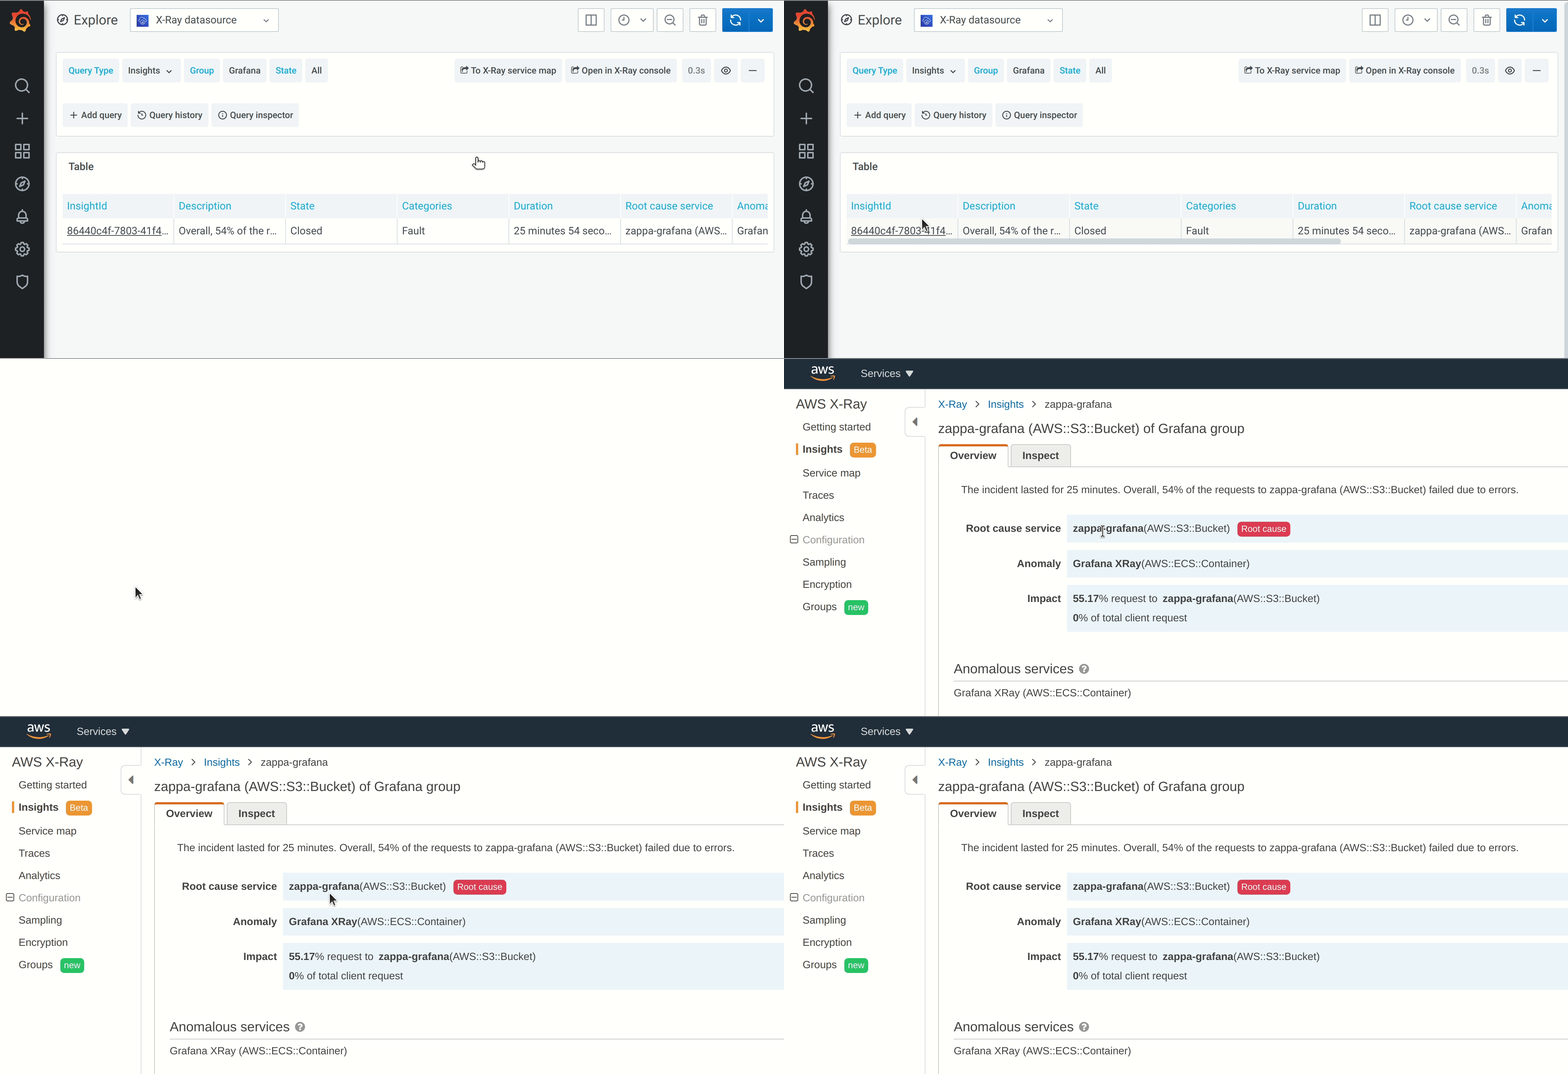
Insights is a new feature in AWS X-Ray that leverages machine learning to help you find issues and resolve incidents even faster. You can search for X-Ray insights and show them in a dashboard for quick access. Each insight in Grafana also provides a deep link to the AWS X-Ray console so you can quickly get to the details.
Trace analytics
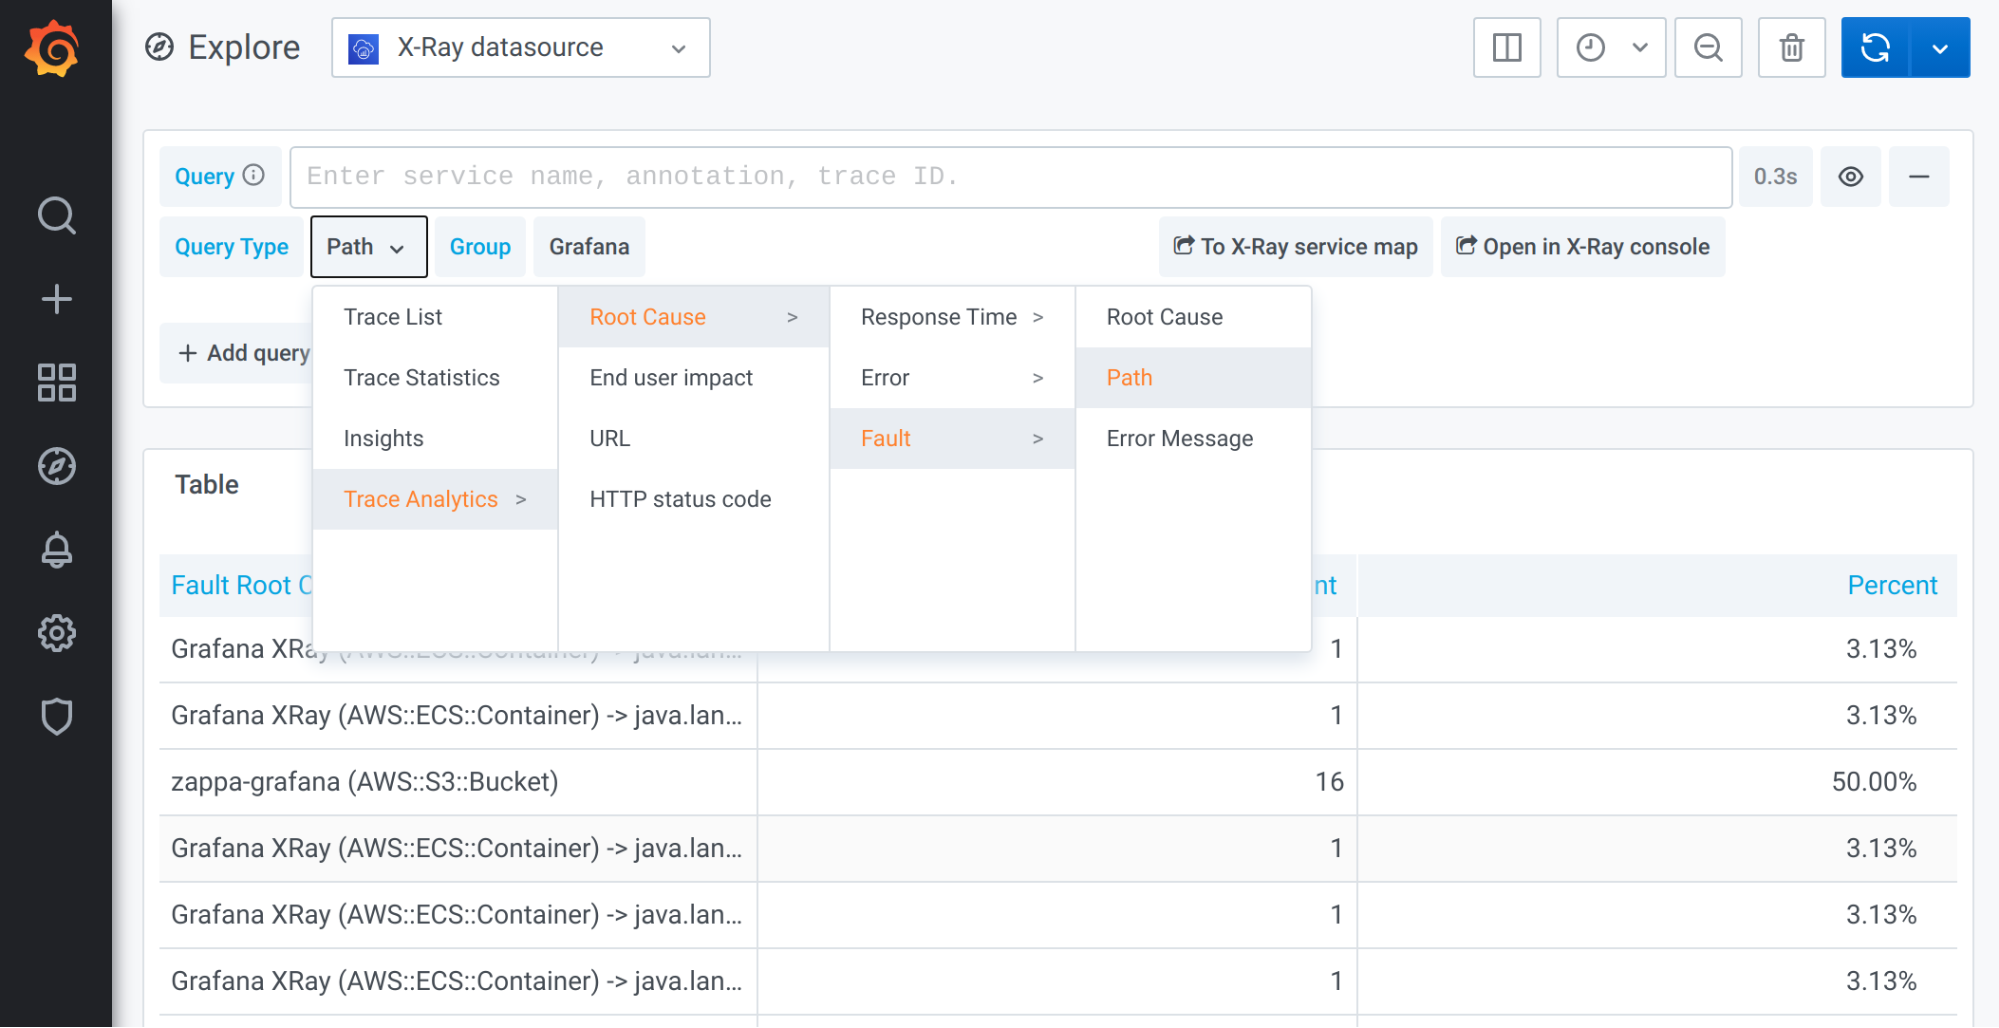
This query type maps to the X-Ray analytics view, giving you additional aggregated information about your traces. It is split into multiple sections, each of which gives you valuable high-level information about what is going on with your services, such as counts of traces per user impact, URL, status code, and various views about root causes of your errors, faults, and elevated response times.
Let us know what you think
We’re excited to have you try out the AWS X-Ray plugin for Grafana. Using the plugin, you can now visualize, analyze, and alert on your AWS X-Ray trace data in the same dashboard as your CloudWatch metric, log, and other observability data, simplifying monitoring and incident triaging in your Grafana console. Please let us know what you think!

