New features in the ServiceNow plugin for Grafana: table query, annotations, and more!
This post has been updated to reflect changes in the availability of the ServiceNow data source plugin for Grafana Cloud users.
Greetings! This is Eldin Nikocevic reporting from the Solutions Engineering team at Grafana Labs. In previous posts, you might have read about ObservabilityCON 2020 or our release of Grafana 7.2. In this week’s post, I am introducing Dave Frankel, who will be covering our updated ServiceNow plugin. – Eldin
In a previous post, we announced the release of our ServiceNow data source plugin. Our first release was focused on incident and change management based on the feedback we received.
Since then, we have been heads down revamping the plugin, and now we’re ready to resurface to announce some major updates.
Querying tables
First thing we have is the ability to query any table!
What does that mean? Let us show you:
There are a couple things to note. Most obviously, we can easily query any table in ServiceNow to show additional insights from your ServiceNow instance. In this example, we’re gathering records from the Problems table. As you would expect, table-specific fields are available in the query editor dropdowns for field selection and filters. Additionally, when the selected table was changed from Incidents to Custom table, the query editor was cleared. This new functionality extends to changes to the Query type field as well.
Annotations
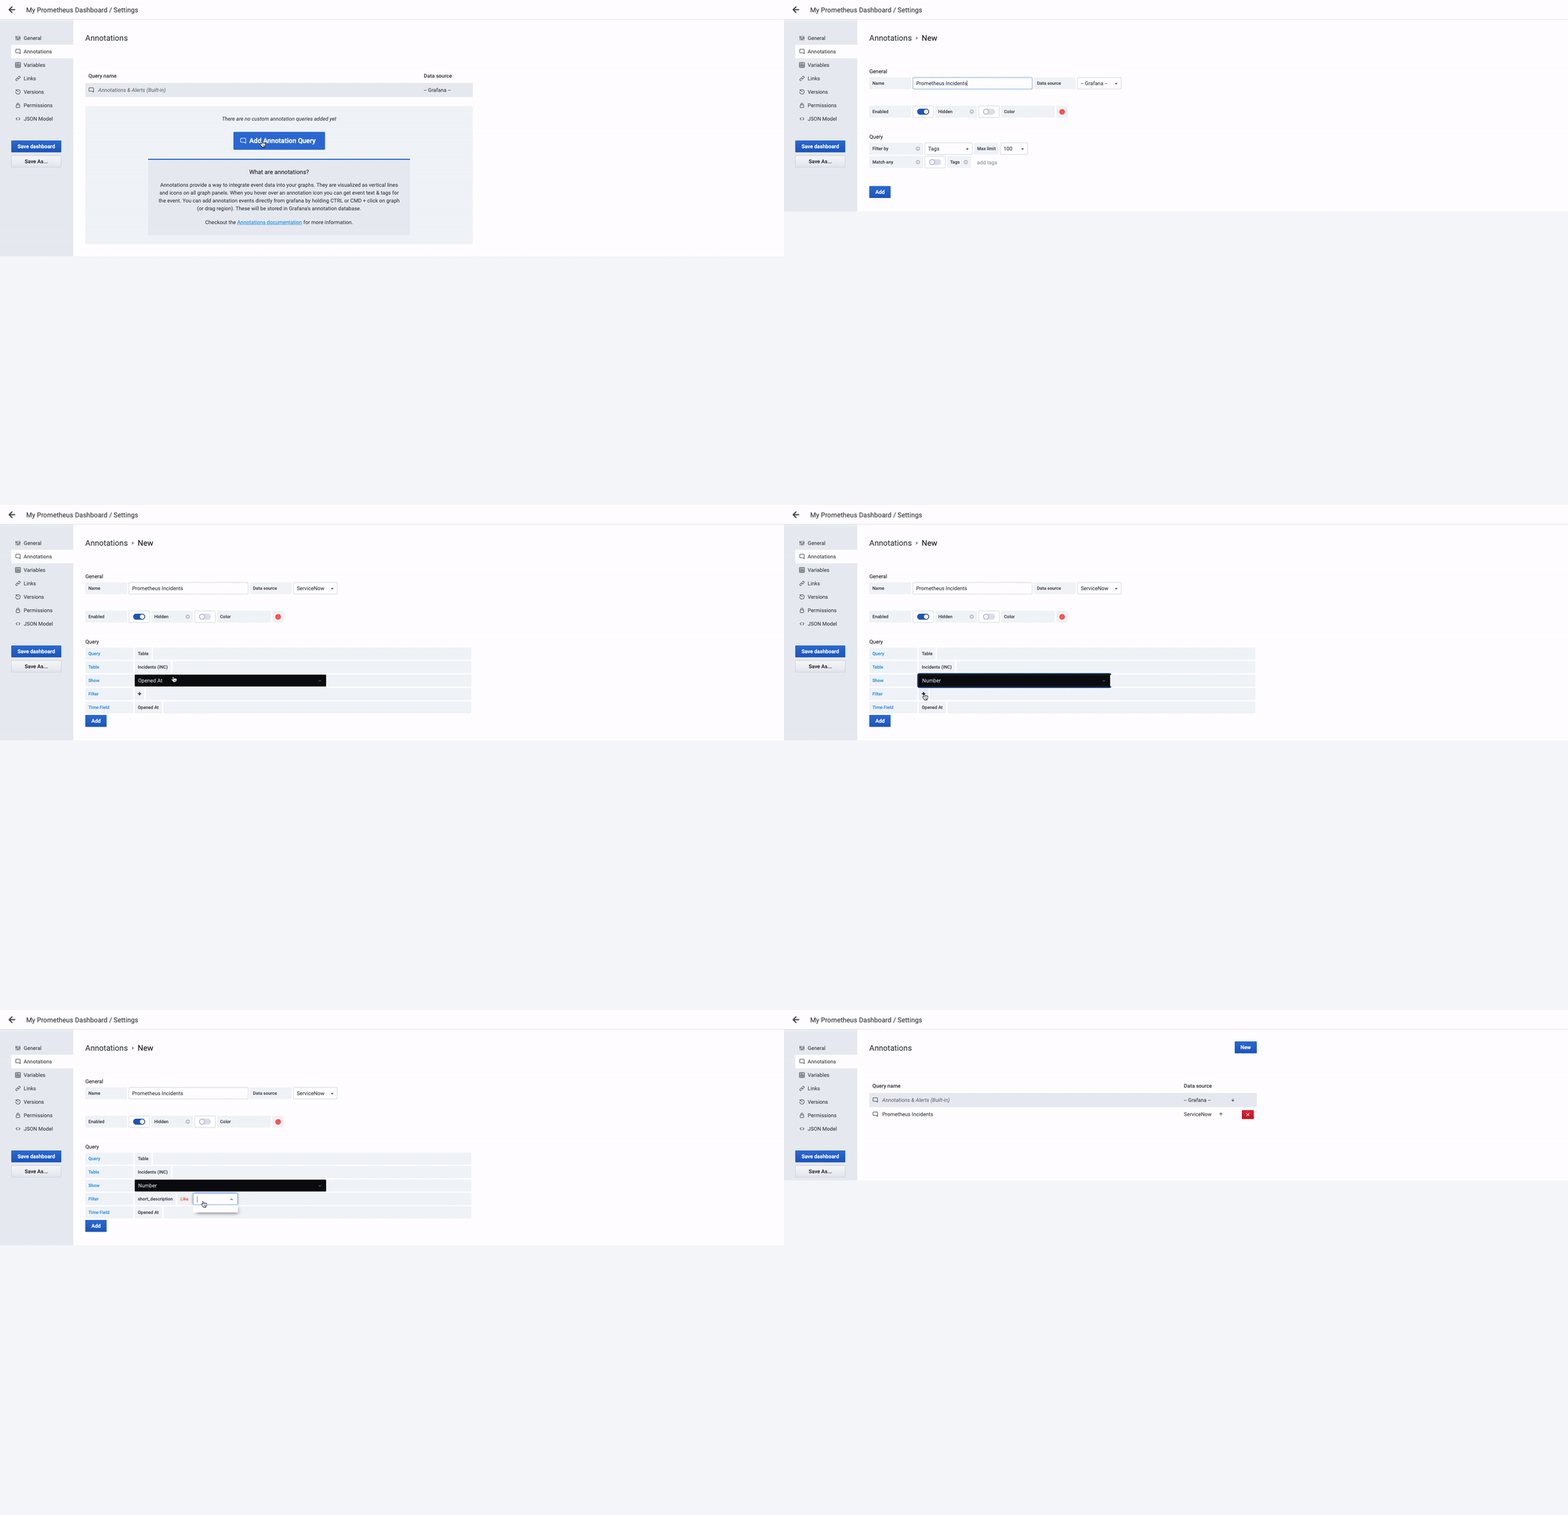
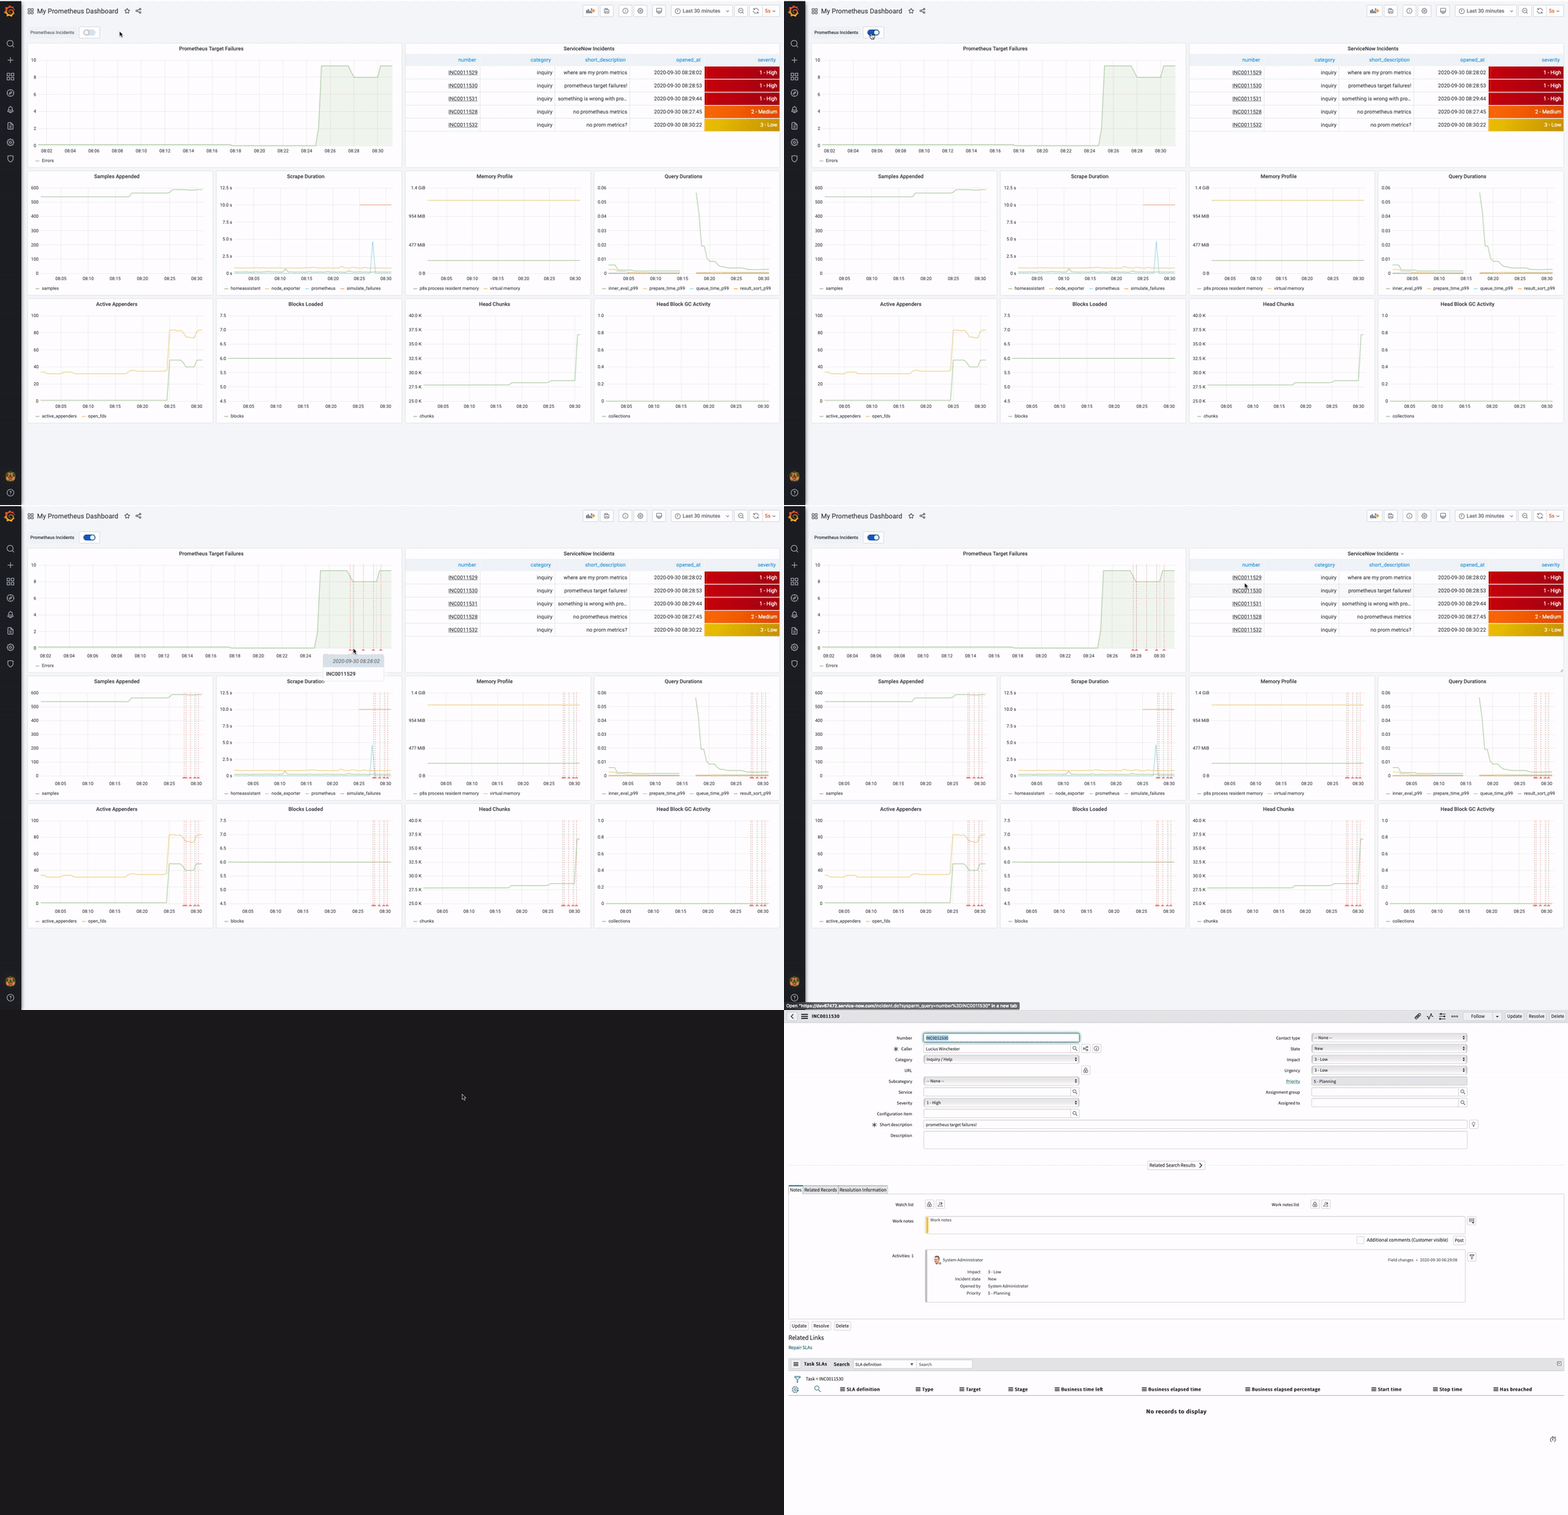
Next up, annotations! Visualize your incidents, changes, or data from any other table as annotations in your panels.


*Note the URL links in the ServiceNow Incidents table. Pro tip: You can use the following data link override to redirect to individual ServiceNow incidents: https://.service-now.com/incident.do?sysparm_query=number%3D${__data.fields[number]}*
Alerting with ServiceNow
Lastly, you can now leverage ServiceNow as an alert notification channel.
From your ServiceNow Data Source config, simply supply a Grafana username and password under the Alert (Beta) header. This will create a notification channel to be used in Alert configs to seamlessly create incidents in ServiceNow as a result of a Grafana Alert triggering.


Learn more
Install the ServiceNow plugin today!
The ServiceNow Enterprise plugin is available for users with a Grafana Cloud account or with a Grafana Enterprise license. For more information and to get started, check out the ServiceNow solutions page or contact our team.
If you’re more of a ditch-the-UI kind of user, here is how you would provision the ServiceNow plugin with a config file:
datasources:
  - name: servicenow
    type: grafana-servicenow-datasource
    access: proxy
    editable: true
    enabled: true
    url: https://.service-now.com
    basicAuth: true
    basicAuthUser:
    jsonData:
      advancedOptions: true
      basicAuthUser:
      fieldSearchType: quick
      internalFieldsFiltration: true
      tlsSkipVerify: true
    secureJsonData:
      basicAuthPassword:
    version: 1
    isDefault: false
We hope you enjoyed today’s post. Keep an eye out for some great new updates coming soon to our plugins — you won’t want to miss it!
If you’re not already using Grafana Cloud — the easiest way to get started with observability — sign up now for a free 14-day trial of Grafana Cloud Pro, with unlimited metrics, logs, traces, and users, long-term retention, and access to one Enterprise plugin.


