Popular community plugins that can improve your Grafana dashboards
One thing we believe at Grafana Labs is that your data should be presented in a way that makes sense to you.
Since the release of Grafana v7.0, we’ve seen a lot more developers taking advantage of the new plugins platform, which helps them build high-quality custom plugins faster than ever.
Not only does this allow them to create their own custom visualizations and data source integrations—taking the Grafana experience to the next-level—but by sharing them with the community, they’re able to help others do the same.
As solutions engineer Christine Wang and I begin prepping for our Sept. 2nd webinar, “All about plugins: Building your first panel plugin” (we’ll be talking about everything from setup to working plugin), I wanted to highlight some of the awesome plugins that have been created by members of the Grafana community already.
Panel plugins
These are the building blocks of Grafana, and allow you to visualize data in different ways.
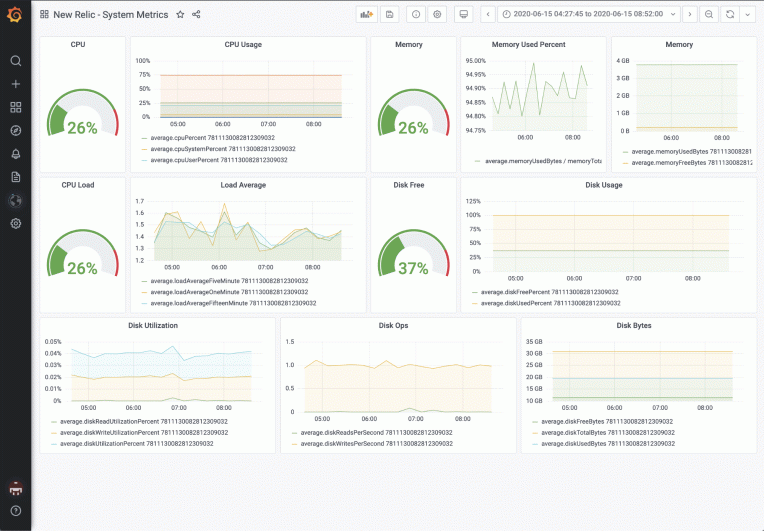
Boom Table
This table/multistat plugin features multiple columns for Graphite, InfluxDB, Prometheus, Azure Monitor. Additional features include: individual thresholds for cells based on pattern; multi-level thresholds; time-based thresholds; and icons in metrics. Also, individual cell values can be transformed to helpful texts, based on pattern, and transformed texts can also contain actual metrics.

FlowCharting
Want to visualize complex diagrams? This plugin uses the online graphing library draw.io to create technical architecture schema (Legacy, Cloud, Azure, AWS, GCP, Kubernetes, Terraform), workflow charts, floor plans, and more.

Diagram
This plugin provides a way to create flow-charts, sequence diagrams, and gantt charts by leveraging the mermaid.js library.

Status Panel
If you’re monitoring several servers and want to keep track of multiple stats for each of them with just a glance, this plugin will come in handy.

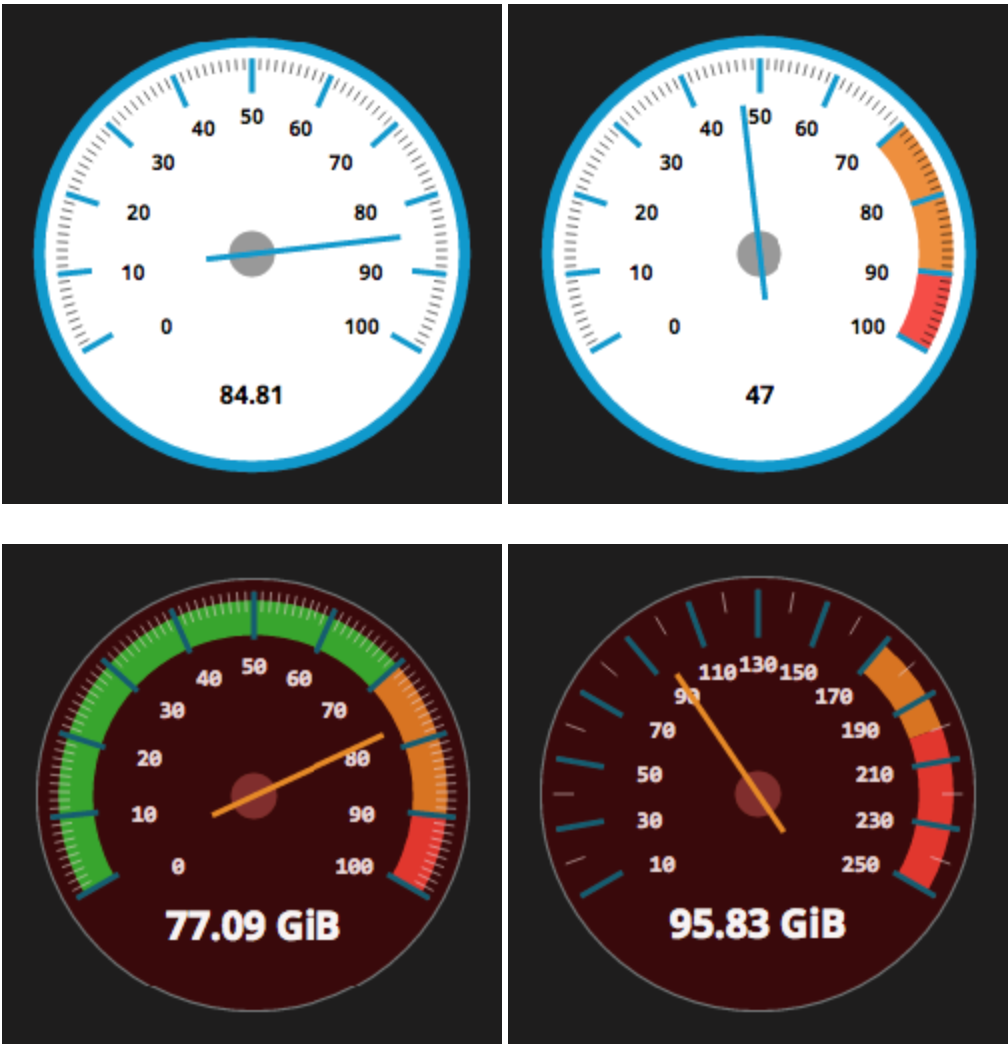
D3 Gauge
Credit for these gauges goes to senior software engineer Brian Gann. The data operator and unit formats are the same as SingleStat panel, and there are many ways to customize and configure the gauges. Gann says he plans to convert it to React, add repeat options and some presets. “I’ve wanted to put together some different ‘styles’ that can be applied.”

Discrete
Ryan McKinley, Grafana Labs’ VP, Applications, built this panel to show discrete values in a horizontal graph. This plugin is great for when you want to visualize the state of a system as it changes over time.


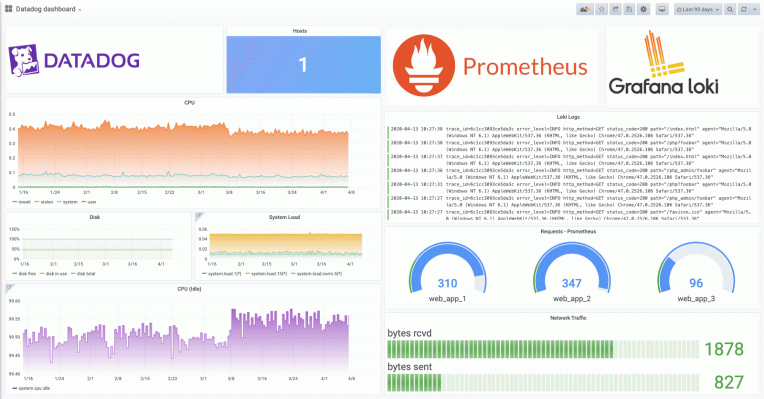
Data source plugins
Grafana supports a wide range of data sources, including Prometheus, MySQL, and even Datadog.
Redis
This plugin lets users easily monitor Redis data. It provides out-of-the box predefined dashboards but is also entirely customizable.

Google BigQuery
This one provides support for BigQuery as a backend database, with features that include sharded tables, partitioned tables, and granular slot allocation (for running queries in a project with flat-rate pricing).