![[KubeCon + CloudNativeCon EU recap] Getting some Thanos into Cortex while scaling Prometheus](/static/assets/img/blog/kubeconeucortexblocksstorage6.jpg?w=1504)
[KubeCon + CloudNativeCon EU recap] Getting some Thanos into Cortex while scaling Prometheus
Yesterday at KubeCon + CloudNativeCon EU, Grafana Labs software engineer Marco Pracucci, a Cortex and Thanos maintainer, teamed up with Thor Hansen, a software engineer at Hashicorp, to give a presentation called “Scaling Prometheus: How we got some Thanos into Cortex.”
In their talk, the pair discussed a new storage engine they have built into Cortex, how it can reduce the Cortex operational cost without compromising scalability and performance, and lessons learned from running Cortex at scale.
(Find out about other Grafana Labs team members’ presentations here.)
Before they began, Pracucci gave a brief introduction to Cortex, a distributed time series database built on top of Prometheus. “It’s horizontally scalable and highly available and offers a durable long term storage for your time series data,” he said.
“Cortex supports multi-tenancy and the typical use case is to have a global view across multiple Prometheus servers. Over the years,” he added, “Cortex also spent a lot of effort in order to optimize the read path, and today, Cortex offers very good query performances.”
Typical Use

A typical Cortex use case has multiple Prometheus servers, usually configured in HA pairs. Prometheus is configured to remote write to a central Cortex cluster, where all the time series are written, “and then you configure Grafana, or the querying tool of your choice, to query back those metrics from Cortex,” Pracucci said.
Cortex internally vendors Prometheus, and uses the same exact Prometheus PromQL engine. “This guarantees a hundred percent compatibility on your queries,” he noted.
Cortex microservices architecture
Cortex is composed of different services interacting together, which you can independently horizontally scale up and down.

On the write path, Prometheus is configured to remote write to the distributor. “The distributor is the ingress for the right path and is responsible to shard and replicate your series across a pool of ingesters,” he said. “Ingesters keep the received series samples in memory and periodically flush those series to the long term storage.”
The long-term storage is composed of two different data stores: an object store and an index store.
“The object store, which is like GCS or S3, is used to store chunks of compressed, timestamp value pairs, which we call chunks,” Pracucci said. “And the index store, like Big Table, DynamoDB, or Cassandra, is used to store an inverted index, which we use to look up the chunks by the query label matchers, and the query time range.”
On the read path, you configure Grafana (or your querying tool) to send the query requests to the query frontend, which is the ingress for the read path in a Cortex cluster. “The main purpose of the query frontend is to offer result caching and also employ some optimization techniques – which we will see in details later on – which allow to parallelize the query execution across multiple query nodes,” he said. “So the query – or, splitted query – that can be splitted by the query frontend, is executed by a pool of queriers, which will fetch the most recent samples from the ingesters and older data from the long term storage, and then we’ll run the PromQL engine on top of this.”
Cortex Single Binary Mode
Deploying Cortex in microservices architecture, however, is not required. Cortex actually supports a second operational mode – the single binary mode – which Pracucci said is the easiest way to deploy Cortex clusters today.

“When you deploy Cortex in single binary mode, Cortex is running as a single binary with a single configuration,” he explained. “If you deploy inside Kubernetes, it will just be a single deployment. And what we actually do is that internally, within one single Cortex process, we run all the Cortex microservices.”
The microservices are hidden when Cortex is deployed in single binary mode, but it’s still possible to horizontally scale Cortex running multiple replicas of the single binary. And all the Cortex properties – like horizontal scalability, high availability, or query performances – are preserved in single binary mode as well.
“This architecture, over time, proved to work and scale very well,” he said. “We have seen Cortex clusters ranging from 10s to 100s million active series. And in the typical use case, we see the 99.5th percentile query latency below 2.5 seconds.”
However, requiring both an object store and an index store introduces extra operational complexity for many users. And running in a cloud like BigTable or DynamoDB, also adds to the cost of running a Cortex cluster.
Can the index store be removed at all?
Almost a year ago, Pracucci said, they started brainstorming.
The big question: Are we able to remove the index store dependency at all and store all the data only in the object store?
That led to the creation of Cortex blocks storage, an alternative storage engine that is currently in the experimental phase.
So now, Cortex can be deployed with chunk storage – the architecture described above – or it can be deployed using the new and experimental blocks storage.
Cortex blocks storage basics
The talk then transitioned to how the blocks storage works under the hood, and Hansen began his portion of the presentation.
His involvement in Cortex blocks storage started when he was working in a role that involved serving metrics and alerts for many customers. His small team needed the scalability of Cortex as well as the multi-tenancy, but didn’t want to have to manage a separate index store.

“The main idea behind the blocks storage solution,” he explained, “is to open up a Prometheus TSDB per tenant, per ingester, and upload these blocks to long-term storage. A TSDB block contains the chunks of compressed data points and, importantly, also contains the index. The entire block can easily be stored in an object store, basically removing the need to run a dedicated index store.”
But isn’t this what Thanos was already doing?
“Instead of trying to reinvent the wheel,” he said, “we can leverage the lessons learned from Thanos and grow on that.”

Hansen built the initial version of this idea, which contained the following elements:
- It would open a TSDB for each tenant on every ingester to store incoming writes. These TSDB’s would periodically write a block to the ingesters local disk under a tenant prefixed directory.
- Ingesters started a Thanos shipper per tenant to scan each of these TSDB directories and upload newly written blocks to long term storage.
- Ingesters would now serve queries straight from the local TSDB.
- Ingester TSDBs had a given retention period, where blocks that had been shipped to storage but exceeded the retention period were deleted from local storage.
- It also modified the querier to use the Thanos querier, which would download and cache the index and blocks found in long-term storage for each tenant prefix. Querier could then serve requests by either using the cached blocks, or downloading blocks on-demand from blocks storage.
Hansen gave a special thanks to Peter Stibrany and Ganesh Vernekar for their contributions to this community effort, as well as others who put in time and effort into making this idea a real solution.
“It took us nine more months of hard work to stabilize and scale out the blocks storage,” he said.
What’s new:
- Two new Cortex services: the compactor and store-gateway
- Three added layers of caching: index, chunks, and metadata
- Implementation of most of the existing Cortex features like rate limits and operational tooling
- Many optimizations and bug fixes
“Today, the Cortex blocks storage is still marked experimental, but at Grafana labs, they’re already running it at scale in a few of their clusters, and we expect to mark this feature as stable soon,” he said.
Cortex blocks storage architecture
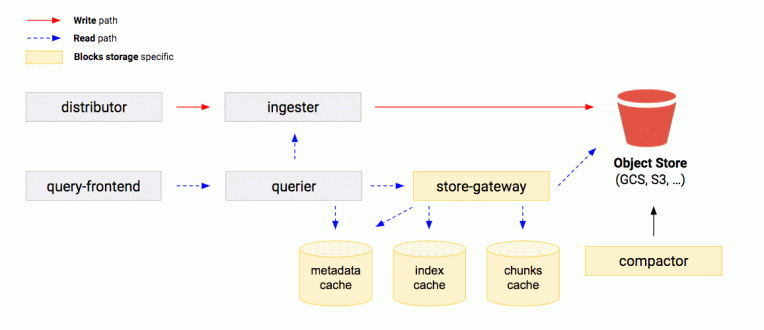
This is the current state of the architecture:

“The Cortex architecture doesn’t change much between the original chunks storage, which we’ll still continue to support, and the new blocks storage,” Hansen said. “Writes still are distributed and replicated to ingesters and then uploaded to object storage. Reads still go through the queriers, which read from the ingesters to get recent metrics. The bigger changes come with two additions to querying from long-term storage. We added the store-gateway and the compactor.”

Store-gateway: This is responsible for the discovery of newly uploaded blocks. “It will scan for newly uploaded blocks and download a subset of the index in each block (called “index-header”) and cache them locally,” he said. “With these stored index-headers, it acts as a queryable interface from long-term storage and can query blocks on demand.”
Compactor: This is responsible for reducing the number of blocks in long-term storage by combining and deduplicating blocks. “It will periodically scan the object storage to locate blocks that are eligible for compaction,” he said. “It will download the compaction candidate blocks and create a new, larger block out of the data. We will then upload that new block and mark the compacted blocks for deletion.”
Hansen added that the compactor and store-gateway leverage the same sharding ring code that Cortex ingesters use to distribute tenants. “So as their scale increases,” he said, “the number of tenants they need to perform work on decreases. However, at this time there’s still no way to scale compaction for a single tenant.”
A closer look at the write path

A given metric is replicated to multiple ingesters for each user (typically with a replication factor of 3).
“So you can see here, the same metric is written to three separate blocks and three separate ingesters,” Hansen said. “These blocks are written to an ingester’s local storage every two hours, and a long running process, called the shipper, will discover newly-written blocks and upload them to long-term storage.”
The write path: scalability issues
“This poses an interesting scaling problem in regards to how many blocks are created,” Hansen said.
“The number of blocks grows quickly with the number of tenants a cluster has,” he explained. “With a 1,000 tenants and a small scale of 50 ingesters, we’ll be creating 600,000 blocks a day, which equates to 200 million blocks a year.”
Another issue: Given that Cortex replicates series 3x across ingesters, samples are duplicated 3x in the storage.

“Since we replicate data in ingesters, typically recommended to be 3x, the issue is we’re storing a large number of identical metrics in storage when we really only need to be storing a single copy of each data point in storage,” Hansen said.
The solution is the compactor.

The compactor performs horizontal compaction, creating fewer larger blocks over a greater time period than the two hours that was uploaded. It also performs vertical compaction, which deduplicates the overlapping blocks from the ingester replication.
This results in one block per day, per tenant, when originally there was 12x the number of ingesters per tenant. What’s also important is that the compactor can horizontally scale to support a large number of tenants.
That solution reduces the footprint after compaction in the object storage, but an issue remains, he noted. “We’re still shipping one block per ingester, per tenant, every two hours, as well as opening a TSDB on every ingester for every tenant – which meant the memory footprint did not scale with the number of notes.”

The solution: shuffle sharding. So for any given tenant, that user’s blocks would only end up on a subset of ingesters.

For example, tenants may be shuffle sharded to four ingesters. “So for every user, only four blocks per tenant, per two hours are uploaded to object storage, and each tenant uses a static amount of memory overhead for the TSDBs,” he said. “This also has the benefit that the compactor no longer needs to perform as much work compacting blocks as we’ve reduced the number of blocks that are uploaded.”

This shows write performance, courtesy of Grafana Labs and the environment we’re running. You can see very low 99th percentile latencies with 2.5M samples per second ingested.
Querying back the data
It’s clearly possible to efficiently ingest a large amount of samples per second with a pretty low latency.
But Pracucci returned with another question: How do we query back this data?
“In one of our clusters we are running at Grafana Labs,” he said, “we have a tenant with 30 million active series running on the blocks storage, which means that we store about 200GB of blocks per day after compaction. If you project this to one year retention, it means that we need to be ready to query back this data across a storage of about 70TB.”
The query-frontend
To understand how the read path works for the blocks storage, Pracucci said, it’s necessary to take a small step back and focus on query-frontend, which is the ingress on the read path.

As a reminder, the query frontend provides two main features: query execution parallelization and results caching.
“The basic form of the query execution parallelization is based on time splitting,” Pracucci said. “When the query-frontend receives a query spanning over a large time range – a time range which covers more than one day – the query frontend splits this query into multiple queries, each one covering one single day, aligning the timestamp of the splitted query to midnight UTC.”
So a query spanning over the last three days will be actually split into three different queries. “Each query will cover a different day, and those three splitted queries will be executed concurrently by the queriers,” he explained. “Their results will be then merged by the query frontend before sending back the response to Grafana or your querying tool.”
Internally, a single query executed by the querier will cover only one day (in most cases).
Pracucci said that’s the primary reason why, by default, we compact the blocks up to one day period. “Doing tests in our clusters, we have seen that this allows for a better parallelization when you run queries over a large time range.”
Querier and store-gateway
The querier executes these one-day queries.
The querier periodically discovers new blocks uploaded to the storage, running a scan over the bucket, and it keeps in memory – a map – of all the known blocks in the storage.

Each block requires a little information: the tenant ID, the block ID, and the minimum and maximum timestamp of samples within the block.
“When the querier receives a query,” Pracucci said, “it looks for all the block IDs containing at least one sample within the query start and end time. And based on the filtered block IDs, it computes the set of store-gateways that should be queried, in order to query back the data from those blocks. The querier will fetch the most recent data, which has not been flushed to the storage yet, from the ingesters and will query the blocks stored in the object store through the store-gateways.”

“Blocks are sharded and – optionally – replicated across the store-gateways,” Pracucci said. “This means that we can horizontally shard the blocks across the pool of store-gateways. And for each block belonging to the shard of one specific store-gateway, the store-gateway loads the index-header.”
The index-header is a small subset of the entire block index.
“In our clusters, we see that the index-header is in the order of 2 percent of the index,” he added, “so it’s a little part of the index, and it’s used to speed up the index lookup at query time.”
The querier queries the blocks through the minimum set of store-gateways holding the required blocks.
When it receives a query, it computes the least block IDs which should be queried. Then, it looks up the hash ring, which is used as the baseline technology to implement the sharding and the replication. This is done to find the minimum set of store-gateways holding the blocks that need to be queried, and concurrently queries those blocks through the store-gateways.
Inside the store-gateway
“If we look inside a single store-gateway,” Pracucci said, “it only fully downloads the index-headers to the local disk and then loads them in memory. But the entire index – or the chunks files, which are even bigger – are never entirely downloaded to the store-gateway.”
“The full index and the chunks are lazily fetched at query time through multiple GET byte-range requests, so we load the minimum data as possible at query time,” he said.

A single query received in the store-gateway typically contains four pieces of information:
- The set of series label matchers for which the samples should be fetched
- A start timestamp
- An end timestamp
- The list of block IDs, which has been previously computed by the querier
Then, the store-gateway runs a local lookup on the symbols and posting offsets table, which are stored in the previously downloaded index-header. The result of this lookup is the input for the remote lookup.
Next, the store-gateway fetches the postings and the series, and then the chunks, which are the segments of compressed timestamp value pairs of the samples for the matching series. This remote lookup is done through GET byte-range requests.
The goal is to lower the number of calls to the object store, both for performance reasons and also because of costs. “Most object store pricing is based on a mix of data stored in terms of gigabyte and the number of API calls you run,” Pracucci said.
As a result, they introduced three layers of caching.

The metadata cache is used by the blocks discovery mechanism, which is running inside both the querier and the store-gateway.
The index cache is a caching layer in front of the posting and series lookup.
The chunks cache is a cache in front of the fetching of the chunks containing the compressed samples.
The index cache and the chunks cache are only used by the store-gateway.
“Since the chunks files are up to 512MB each, we never fully download the entire object or the entire file, and we never fully cache a single entry with 512MB,” Pracucci said. “But what we do is sub-object caching, aligning the offset to 16KB. Caching is *not* mandatory, so it’s an optional component, but it’s recommended in production.”
This work was done as a necessity in Cortex, but all of the improvements have been backported to Thanos as well.
Performances
Grafana labs is currently running a few clusters, and one of the test clusters – a staging cluster – has an atypical setup, Pracucci said.
Two identical clusters have been running for a few months. They are identical in terms of the version of Cortex being run and the scale – they have the same number of Cortex nodes ingesting the same active series, roughly 10M active series.
They introduced a proxy, called query-tee (it’s open source), which mirrors every single query they receive to both clusters, and they make the two backend clusters – one running the blocks storage and another running the chunks storage – compete in terms of performances.

“What we have seen is that the blocks storage performances are pretty good and comparable with the chunks storage for most of the use cases,” Pracucci said. “We still have some spikes in the p99 latency – in the blocks storage – mainly due to cold caches. But the progress we have made and measured this way over the past few months is pretty good. I personally believe we are on a good track to run the blocks storage with comparable performances compared to the chunks storage.”
What’s next?
“If you’re running the experimental blocks storage today, or you are interested in giving it a try, please be aware we are very close to mark it stable,” Pracucci said. “It’s something we expect will happen this quarter.”
He added that they are currently working on many things, the most important being continuous work to improve the query performances. “This is an endless work and we are doing many iterations over it,” he said.
There are several ideas they want to experiment with in terms of faster queries, such as:
- Fully load indexes for last few days
- Write-through cache
- 2nd dimension to shard blocks
Another goal is to productionize shuffle sharding. “Basically, we want to be able to scale a Cortex cluster to any size of tenants – 100 tenants, 1,000 tenants, 10,000 tenants,” he said. “And we believe that shuffle sharding is the way to go in this direction.”
In the Thanos community, Pracucci said they recently started the work to introduce the support for deletions – being able to selectively delete series and time series data from Thanos.
“We are very interested in deletions as well in the Cortex community,” he concluded, “and we will work closely with the Thanos community to make it happen and introduce the support for deletions in the Cortex blocks storage as well.”
For more on the topic, check out Pracucci’s recent blog posts, “How blocks storage in Cortex reduces operational complexity for running Prometheus at massive scale” and “Scaling Prometheus: How we’re pushing Cortex blocks storage to its limit and beyond.”