

New in Grafana 7.1: Gain new data insights with InfluxDB and Flux query support
Emily Kurze leads partner marketing at InfluxData. She has worked in open source communities – including Hyperledger and the Cloud Native Computing Foundation – since 2014.
The audience was buzzing when Ryan McKinley, VP of Innovation at Grafana Labs, demoed the new native support for InfluxDB Flux queries in his talk at the InfluxDays virtual conference in late June. Whether the goal is to build IoT applications, or monitor DevOps infrastructure or another application or system, it’s important to move beyond just visualizing the data. This new integration between InfluxData and Grafana, available in Grafana 7.1, makes it easier to combine data sources to enrich time series datasets and gain powerful insights.
Observability matters
Visibility is seeing into a data source, whereas observability is the ability to see across data sources and systems. Observability across stacks and data sources makes it easier to see patterns and add context to time series data from other sources like relational or log databases. This context is key to correctly interpreting data patterns and gaining insights that can then inform process improvements, increase efficiencies, identify anomalies, and help determine the underlying causes of service disruptions.
Flux, a query language created by InfluxData, can be used to create more complex queries to help focus on the data that matters most, in one place. Each panel of a dashboard in Grafana is driven by a query. By combining data sources, it becomes possible to overlay metrics together in real time, making correlation between the sources even easier. To use a very simple example, the time series data of website traffic could be correlated to increases in order volume.
As the world becomes increasingly digital and instrumented, it can be easy to miss patterns when data is separate and siloed. Dashboards pulling in advanced metrics from multiple data sources can eliminate the inefficiencies of siloed data.
The power of Flux in Grafana
InfluxData has updated the InfluxDB data source for Grafana, allowing users to query InfluxDB using the Flux query language. This capability is now native in Grafana 7.1; users don’t have to install or manage any additional plugins. With its minimal learning curve, Flux enables users to take advantage of powerful features such as joins, math across measurements, multiple datasources, and to create more sophisticated queries than before.
For those who are familiar with InfluxQL, the original query language for InfluxDB, those queries are still supported and can run side-by-side with new Flux queries. This allows slowly transitioning InfluxQL queries over to Flux as time allows, easing the migration to using Flux. With Grafana 7.1, the built-in Flux query builder makes it easy to create more powerful queries to populate dashboard charts using Flux queries to do things that aren’t possible in InfluxQL.
Flux features
Joins allow users to create graphs that span multiple data buckets. An example is a Grafana chart that displays both bytes transferred and requests per second; Flux allows these two measurements to be queried and joined into a single table.
Math across measurements goes beyond simple joins to allow math functions to be performed on columns in the joined table. For example, you can divide an error rate by a request rate to get an error rate percentage.
Grafana makes it easy to visualize data from multiple data sources. Now with the support of Flux queries, it’s possible to take data enrichment to the next level by merging different types of data together in a single query. Flux queries allow time series data to be enriched with metadata from relational databases such as MySQL, Postgres, Microsoft SQL Server, Snowflake, AWS Athena, and Google BigTable – or even from CSV files. For example, if time series data includes customer number fields but not customer names, Flux makes it possible to pull in the customer names from another database type so that they can be displayed in Grafana dashboards.
Flux has a wide range of functionality beyond what is covered here. A few more common features include query support for sorting by tag, grouping by columns, window by calendar months, and datepart-like queries. It also supports features like pivot, histograms, and covariance queries. View all the Flux features in the detailed docs.
Improving production workloads
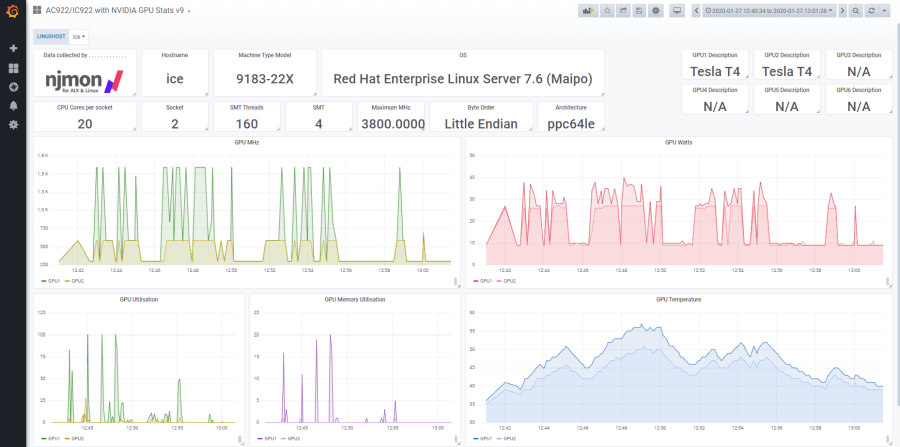
Enterprises like IBM are already using a joint Grafana-InfluxDB solution to visualize their time series data. As part of its sales process, IBM benchmarks new hardware and software for clients to monitor their systems. Customers looking to IBM to address their hybrid multi-cloud infrastructure needs often run POWER9 servers, which can have up to 192 CPU cores, 64 TB of memory, dozens of PB of SAN storage, and typically run a mixture of AIX (UNIX) and Enterprise Linux (RHEL or SLES) workloads. These workloads can result in a lot of metrics. IBM and its clients are using InfluxDB and Grafana to collect, store, and visualize performance data, which is used to monitor and tune for peak performance in ever-changing workload environments.
Join us on August 13 at 8:00 a.m. (Pacific Time) for “Discovering How IBM Uses InfluxDB and Grafana to Help Clients Monitor Large Production Servers and IBM Benchmark Centers.” This live webinar will feature Nigel Griffiths from IBM, Ronald McCollam from Grafana Labs, and Russ Savage from InfluxData, who will share how InfluxDB and Grafana can be used together to improve large production workloads. They will also cover the latest product updates from InfluxData and Grafana Labs. Claim your spot to attend the upcoming webinar.
Get started with InfluxDB, Flux, and Grafana
To get started using Flux with Grafana, download or try Grafana 7.1 in the cloud today, visit the InfluxDB and Grafana documentation, and learn more about how InfluxDB integrates with Grafana.