Is your Grafana dashboard ready to spot chaos?
When it comes to systems reliability, you wouldn’t normally think that unleashing additional chaos would actually be helpful, would you? As more engineering teams moved toward microservice-based architectures for cloud applications over the course of this past decade, many of them didn’t change their testing strategies. Some have found out the hard way – through sleepless nights of incident response work or from writing up postmortems – that traditional automated QA testing doesn’t account for the rapidly changing environments of distributed systems.
In 2010, when Netflix made their big move to the cloud, they decided to take a much different approach by developing a new testing tool called Chaos Monkey. With Chaos Monkey, Netflix engineers created pseudo-random terminations of instances and services. These intentional system failures allowed them to pinpoint the weaknesses within their architecture and come up with new ways to prevent potential outages in the future.
Chaos Monkey led to the creation of a new methodology called Chaos Engineering, and along with it came a whole new set of tools SRE and DevOps teams rely on to minimize downtime by introducing all different kinds of failures.
Not surprisingly, engineers who care deeply about the reliability of their systems tend to care an awful lot about their monitoring stacks as well. One of the most popular tools in the Chaos Engineering space is Gremlin, which offers a fully hosted solution to safely experiment on complex systems and is used by engineering teams at companies like Expedia, Mailchimp, and Target. And Grafana just happens to be one of the top three monitoring tools used by the Gremlin community.
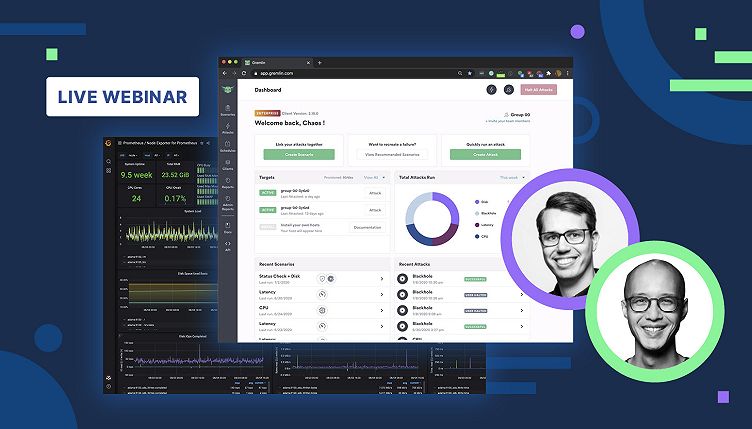
After all, what good is a Chaos Engineering experiment if you can’t visualize what it’s actually doing to your systems? On the flip side, how do you know if your current monitoring setup can even help you spot a failure? In the spirit of knowledge sharing between our communities, we’ve decided to join forces for a special live webinar, “Running Chaos Engineering experiments with Gremlin and Grafana,” on August 12.

Join Gremlin’s Director of Advocacy Jason Yee and Grafana Labs Developer Advocate Marcus Olsson for a beginner-friendly overview of how Chaos Engineering can help improve your incident response approach through better monitoring and testing. Are you ready to unleash some chaos on your Grafana dashboards? Register here.
