Grafana v7.1 released: New features for InfluxDB and Elasticsearch data sources, table panel transformations, and more
The 7.1 stable release builds on the major developments in Grafana 7.0.
Interested in getting started with Grafana? Watch this webinar for a demo of the user interface and setup.
Highlights
Here are some features we’re excited about in Grafana 7.1:
- Influx/Flux: Support for the Flux query language in the InfluxDB data source for InfluxDB 1.8+ and support for InfluxDB 2.0 beta.
- Table panel: The new table panel introduced in 7.0 achieves feature parity with the old table panel with the introduction of the merge on time transformation and ad hoc filtering.
- Explore: The query mode selector has been removed from Explore. You no longer have to manually choose between the metrics and logs modes when using a data source that supports both (such as Loki or Elasticsearch).
- Explore: Query history search allows you to search for queries and comments.
- Explore/Elasticsearch: The new internal linking feature for Elasticsearch allows you to link to other data sources from your logs.
- Plugins: Provisioning of app plugins enabled.
- Enterprise: Support for HashiCorp Vault to manage secrets in the Grafana config file and help with provisioning.
- Enterprise: Support for monthly schedules for reports.
- Azure Monitor data source: Support for multiple dimensions added to all services.
- Google Cloud Monitoring data source: Deep linking from Grafana panels to the Metrics Explorer in Google Cloud Console.
- Time range picker: Added ability to select a time zone.
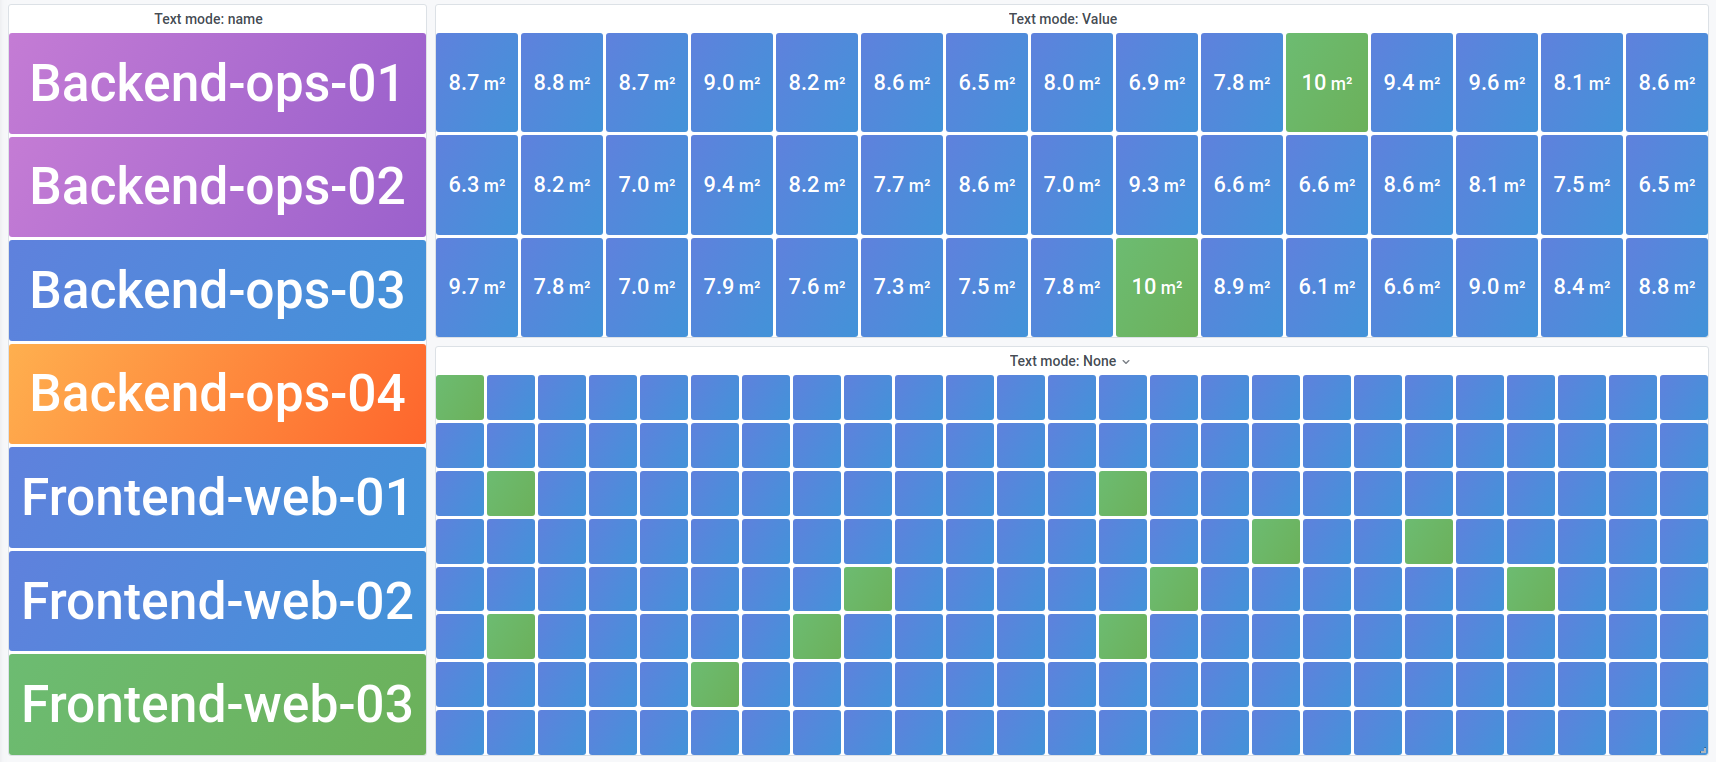
- Stat panel: New text mode added.
Influx data source
The InfluxDB data source now supports both InfluxQL and the Flux query language – as well as InfluxDB 2.0 beta.
Table panel feature parity
The new table panel introduced in 7.0 was missing a few features that the old table panel had. This release introduces the new merge on time transformation, which allows you to combine many time series or table results, enabling the visualization of multiple series in the new table panel. This feature, along with ad hoc filtering, gives the new table panel feature parity with the old table panel. For 7.0 users, this is reason enough to upgrade immediately!
Unified querying experience in Explore
In 7.1, we removed the query mode selector from Explore. You no longer have to manually choose between the metrics and logs modes when using a data source that supports both (such as Loki or Elasticsearch). Explore will now detect which type of data is being returned automatically and choose the correct visualization.
Query history search
In Grafana v7.1 we are introducing search functionality in Query history. You can search across queries and your comments. It is especially useful in combination with a time filter and data source filter. Read more about Query history here.

Internal links for Elasticsearch
The new internal linking feature for Elasticsearch allows you to link to other data sources from your logs. You can now create links in Elastic configuration that point to another data source (similar to an existing feature in Loki). An example would be using a traceID field from your logs to be able to link to traces in a tracing data source like Jaeger.
Provisioning app plugins
Grafana v7.1 adds support for the provisioning of app plugins. This allows app plugins to be configured and enabled/disabled using configuration files. Read more about this feature here.
Azure Monitor data source
Support for multiple dimensions has been added to all services in the Azure Monitor data source. This means you can now group by more than one dimension with time series queries. With the Kusto-based services, Log Analytics and Application Insights Analytics, you can select multiple metrics as well as multiple dimensions.
Additionally, the “Raw Edit” mode for Application Insights Analytics has been replaced with a new service in the dropdown for the data source and is called “Insights Analytics.” The new query editor behaves in the same way as Log Analytics.
Deep linking for Google Cloud Monitoring
A new feature for the Google Cloud Monitoring (formerly Google Stackdriver) data source is deep linking from Grafana panels to the Metrics Explorer in Google Cloud Console. Click on a time series in the panel to see a context menu with a link to View in Metrics explorer in Google Cloud Console. Clicking that link opens the Metrics explorer in the Monitoring Google Cloud Console and runs the query from the Grafana panel there.
Time range picker
The dashboard’s time range picker now allows you to select a time zone. You no longer need to go to dashboard settings to change the dashboard’s time zone. Another improvement is that you can search for the time zone using country or city name, time zone abbreviations, or UTC offsets.
Stat panel
The stat panel has a new Text mode option to control what text to show.
By default, the stat panel displays:
- Just the value for a single series or field.
- Both the value and name for multiple series or fields.
You can use the Text mode option to control what text the panel renders. If the value is not important – only name and color are – then change the Text mode to Name. The value will still be used to determine color and is displayed in a tooltip.

Grafana Enterprise features
General features are included in the Grafana Enterprise edition software.
Support for secret management in config files with HashiCorp Vault
With support for HashiCorp Vault recently added to Grafana Enterprise, you can secure access to passwords and tokens in the Grafana config file and in provisioning files.
Here is an example of using Vault to fetch secrets securely when configuring the Grafana database in the config file:
[database]
type = mysql
host = mysqlhost:3306
name = grafana
user = $__vault{database:database/creds/grafana:username}
password = $__vault{database:database/creds/grafana:password}
Learn more about the Vault feature in our documentation.
Support for monthly schedules for reports
In Grafana Enterprise, the reporting feature has been extended so you can schedule reports to be sent on a particular day of the month. You pick a day of the month (1-31 or last) and a time of the day to send the report, and at the designated time every month, Grafana will send an email with your dashboard attached as a PDF.
Learn more about monthly scheduling of reports here.
Upgrade Grafana
Download or try Grafana 7.1 in the cloud today.
Refer to Upgrading for more information about upgrading your Grafana installation.
Interested in getting started with Grafana? Watch this webinar for a demo of the user interface and setup.
Thank you
A big thanks to all the Grafana users who contributed by submitting PRs, bug reports, and feedback!


