
Monitoring Java applications with the Prometheus JMX exporter and Grafana
We all know that Prometheus is a popular system for collecting and querying metrics, especially in the cloud native world of Kubernetes and ephemeral instances.
But people forget that Java has been running enterprise software since 1995, while Prometheus is a relative newcomer to the scene. It was only created in 2012! Even though Java has had its own metric collectors since before Prometheus was born, none of our new environments speak its (metric) language.
How can you bridge that gap?
That’s the job of the Prometheus JMX Exporter. The exporter connects to Java’s native metric collection system, Java Management Extensions (JMX), and converts the metrics into a format that Prometheus can understand.
In this post, I’ll use Kafka as an example of a Java application that you want to monitor. I’ll build the JMX exporter, deploy Kafka, and bring its metrics into Grafana for monitoring.
Note: This tutorial assumes that you have a Java development environment that includes maven and that you have a Grafana instance already deployed.
You’ll also need to download a copy of Kafka. Kafka binaries are prebuilt for many environments. Use the download link on the Kafka quickstart page to download Kafka, but don’t start it yet.
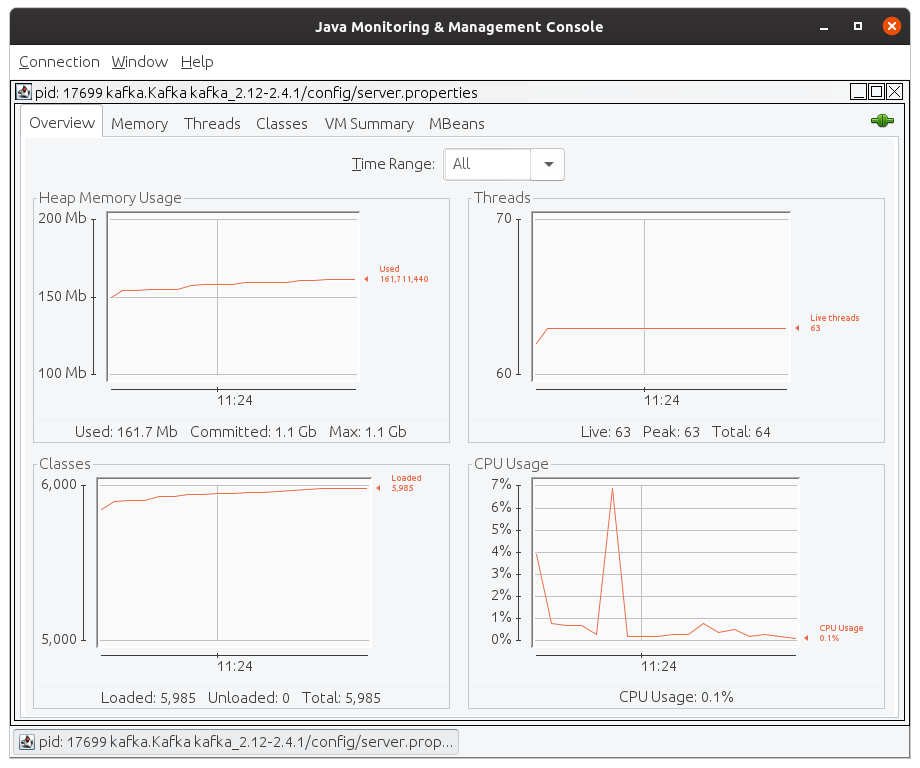
If you want to compare Java’s native JMX output to the data captured by the Prometheus exporter, install jconsole.
Building the JMX exporter
The JMX exporter is available on Github. In order to build it, you’ll need to clone the repository and build with maven:
git clone https://github.com/prometheus/jmx_exporter.git
cd jmx_exporter
mvn package
Once this is done, you’ll need to get the name of the binary that’s built, since it will be used later when starting Kafka:
ls jmx_prometheus_javaagent/target/jmx*jar
Running Kafka
Now that the JMX exporter is built, you can add it to the Java environment that Kafka will run in.
Kafka requires Zookeeper, so you’ll need to start that up first. (It should be included in the Kafka download. Your path might look slightly different depending on the version of Kafka you downloaded.)
kafka_2.12-2.4.1/bin/zookeeper-server-start.sh kafka_2.12-2.4.1/config/zookeeper.properties &
(Be sure to get the “&” at the end so that Zookeeper runs in the background! Otherwise, you’ll need to open another terminal to run Kafka.)
OPTIONAL: Start jconsole
If you want to compare Java’s native jconsole metric view against the Prometheus/Grafana view, you can start jconsole. When you run Kafka, it will automatically populate in the jconsole window.

Set up your Java environment
The JMX Exporter is built as a JAR file that needs to be loaded into your Java environment in order to function. Fortunately, Java makes this easy (if not obvious) by allowing you to add dependencies into your environment before running a Java application.
You’ll include the native JMX libraries as well as the JMX Exporter and use the full name of the binary from above. (Mine is “jmx_exporter/jmx_prometheus_javaagent/target/jmx_prometheus_javaagent-0.12.1” but yours may be different if you downloaded a different version of the agent code.)
You can also change the port that the metrics will be exposed on. I’m using 8080 in this example, but feel free to change that if 8080 is in use in your environment.
export EXTRA_ARGS="-Dcom.sun.management.jmxremote \
    -Dcom.sun.management.jmxremote.authenticate=false \
    -Dcom.sun.management.jmxremote.ssl=false \
    -Djava.util.logging.config.file=logging.properties \
    -javaagent:./jmx_exporter/jmx_prometheus_javaagent/target/jmx_prometheus_javaagent-0.12.1-SNAPSHOT.jar=8080:jmx_exporter/example_configs/kafka-2_0_0.yml
Start Kafka
Now we can actually run Kafka itself. This will automatically pull in the extra libraries we specified above.
kafka_2.12-2.4.1/bin/kafka-server-start.sh kafka_2.12-2.4.1/config/server.properties &
Assuming you did everything correctly, you should see Kafka start up!

If you get errors, double check the paths for your JMX exporter and Kafka config.
Viewing metrics
Now you should be able to view the metrics by visiting http://localhost:8080 (or whatever port you used):

And there you have it!
Want to monitor other Java applications that expose metrics via JMX? You can use the same process. And of course, once the metrics are in Prometheus, it’s easy to pull them into Grafana for visualization and alerting with one of the JMX dashboards available on Grafana.com.