Plugin showcase: The hourly heatmap panel, built on Grafana's new plugin platform
Since Petr Slavotinek created the Carpet plot plugin in 2017, it’s been one of the most popular community plugins for Grafana. Unfortunately, even though the Carpet plot plugin continues to be useful to many users, it’s no longer being maintained.
Grafana 7.0 introduced a brand new React-based platform, along with a set of improved APIs for building plugins. Since I knew some React from previous projects, I wrote my first Grafana plugin that would adapt the original Carpet plot to the new plugin platform.
I’ve called it Hourly heatmap, and in this blog post, I’d like to quickly introduce what it does and how it can be helpful.
The features
If you haven’t yet used the Carpet plot plugin, you might ask yourself: “Doesn’t Grafana already have a built-in heatmap panel?” And the answer is yes.
The main difference is that the Hourly heatmap panel plots the hours of the day along the Y axis, which is currently not possible with the built-in heatmap panel.
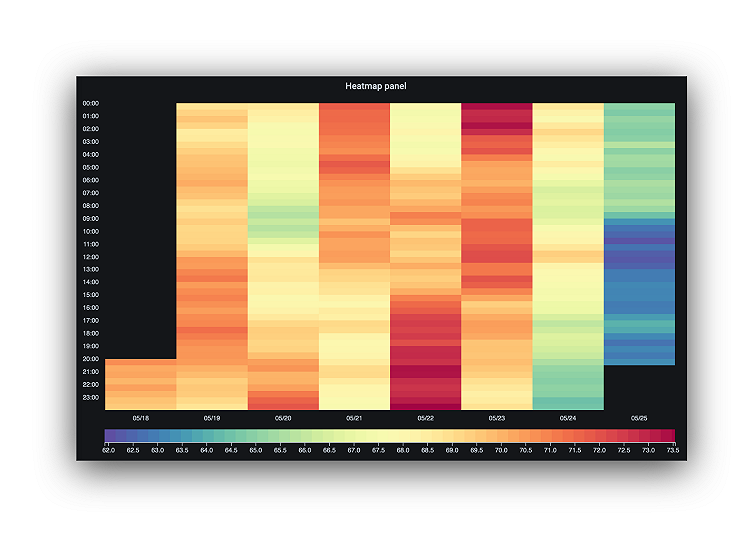
The Hourly heatmap panel is useful when you have a running system with activity throughout the day. The panel groups data into buckets of one hour (or less) and maps the bucket to a color along a spectrum. The color tells you during which hours the application is experiencing high or low traffic.
Let me show you what I mean. Here’s an example of an hourly heatmap with data from the last seven days. The warmer colors indicate higher traffic, whereas colder colors indicate low traffic.

Not only does the Hourly Heatmap plugin contain all of the original functions of Carpet plot, but I’ve also added two additional features that the community requested:
- Time zones: The hourly heatmap now uses the time zone set by the dashboard.
- Working hours: It’s possible to configure the panel to only display data within a certain interval. This comes in handy when you have applications that have little to no activity during the night and you want more efficient use of screen area.
The panel also supports the new field options that were introduced in Grafana 7.0. By adding support for field options, you can now add multiple queries in the same panel. You can also override things like the color palette or the unit used for each query.
Getting started
The Hourly heatmap panel is intended as a drop-in replacement for the Carpet plot plugin. If you’re already using the Carpet plot plugin with Grafana 7.0, then you should be able to replace it with little effort.
That being said, there might still be lingering bugs and issues, so run the Hourly heatmap alongside the Carpet plot for a while to make sure it behaves like you expect it to. If it doesn’t, report your findings to the GitHub project page. Keep in mind that until version 1.0, some features and configuration are subject to change.
I’d like to thank Petr Slavotinek for creating the original plugin. Contributions like the Carpet plot are splendid examples of how the community can extend Grafana with new visualizations and data source integrations.
If you want to get started building your own plugin for Grafana, refer to the Build a plugin page, and also watch Dominik Prokop’s GrafanaCONline talk on Plugins for Grafana 7.0 for a video how-to:
There’s supposed to be a video here, but for some reason there isn’t. Either we entered the id wrong (oops!), or Vimeo is down. If it’s the latter, we’d expect they’ll be back up and running soon. In the meantime, check out our blog!
