GrafanaCONline Day 9 recap: Prometheus rate queries explained, and inside one company's adoption of a central telemetry platform
We’re into the third and last week of GrafanaCONline! We hope you’re able to check out all of our great online sessions.
If you didn’t get a chance to watch yesterday’s sessions (or want to see them again), here’s a recap of day 9 of the conference:
Prometheus rate queries in Grafana
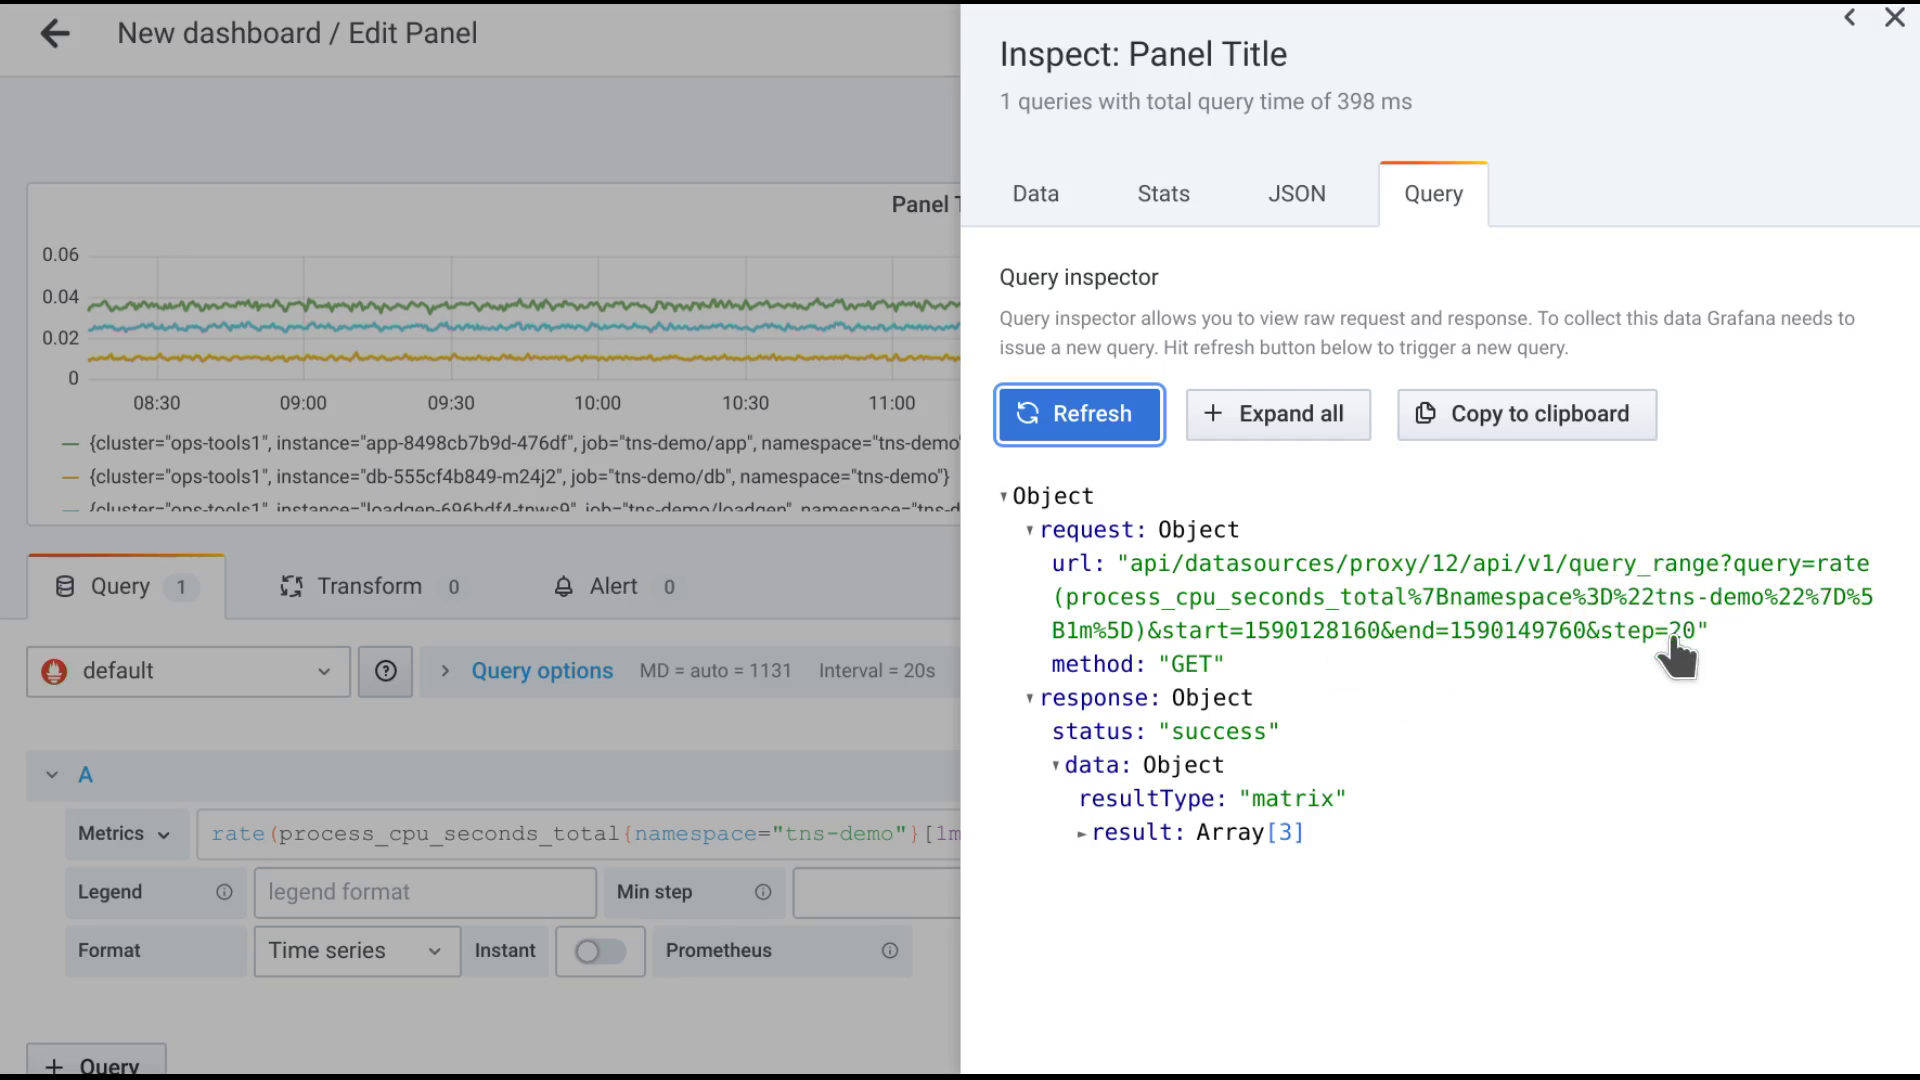
Grafana Labs principal software engineer Björn “Beorn” Rabenstein took to his whiteboard to explain everything you need to know about Prometheus rate queries. He discussed the subtle and not-so-subtle differences between range vectors and instant vectors, and range queries and instant queries, in order to show how Grafana graphs something that comes from Prometheus. He also highlighted Query Inspector, one of the new features of Grafana v7.0.

Watch his full talk here.
How to get an organization to adopt a central telemetry solution
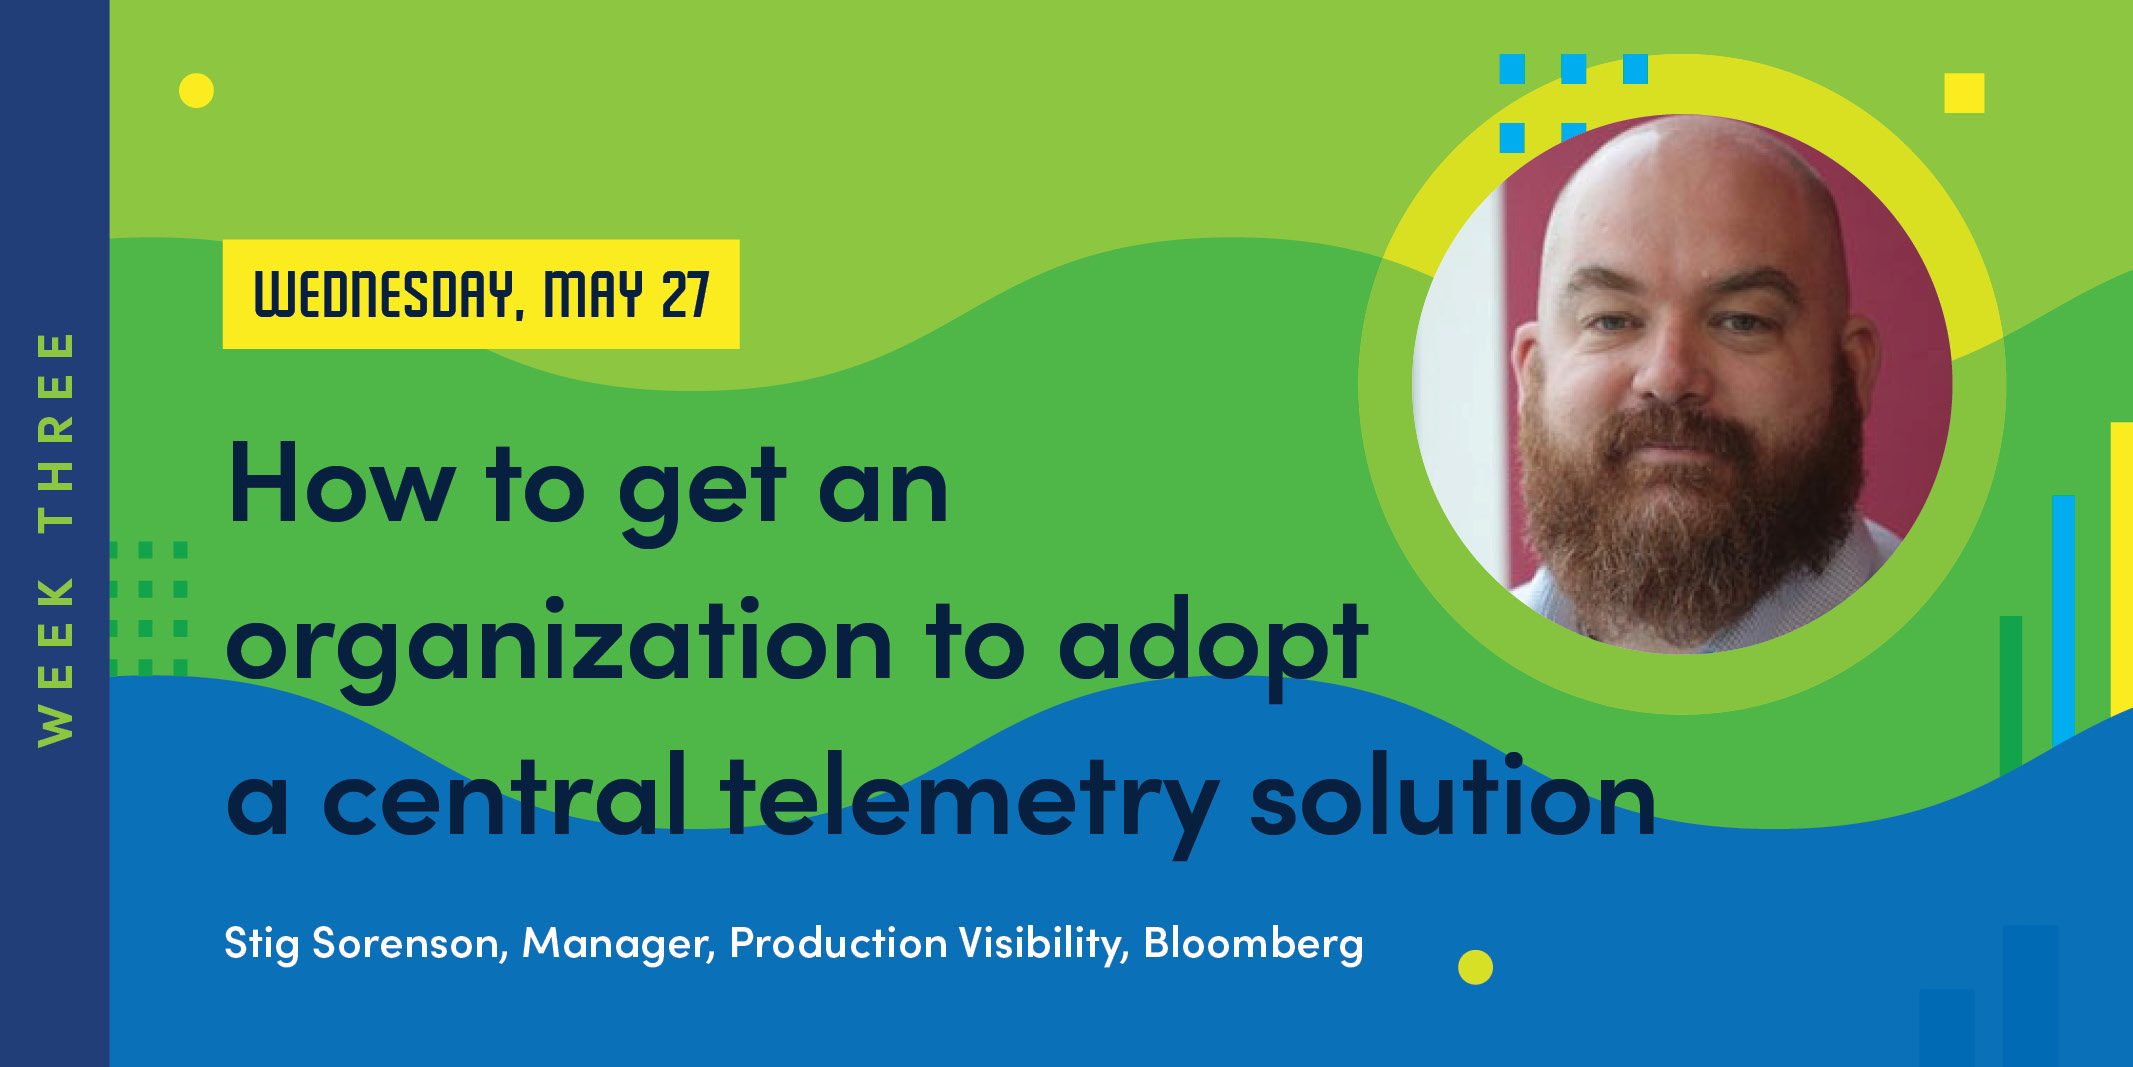
Stig Sorenson, manager for production visibility at Bloomberg LP, explained how more than 6,000 engineers at Bloomberg were convinced to adopt a centralized telemetry solution that was built in-house using open source software. He also revealed some of the key decisions and trade-offs, as well as the lessons learned during their four-year journey.

Check out the presentation here.
Today’s sessions
-What’s new on Grafana Cloud Graphite and Metrictank with Grafana Labs principal software engineer Dieter Plaetinck at 9:30am PT / 12:30pm ET / 16:30 UTC
-Reducing wine waste with Grafana and machine learning with ML6’s Rebecca Brooke and Jeffrey Hagen at 10:30am PT / 1:30pm ET / 17:30 UTC
Don’t forget that you can connect with the Grafana community and get the latest updates from the Grafana Labs team during the event on Slack. Sign up here and join the #grafanaconline channel.
See the full schedule here.
