GrafanaCONline Day 8: Introducing the new plugins platform in Grafana v7.0
Welcome to the third and last week of GrafanaCONline! We hope you’re able to check out all of our great online sessions.
If you didn’t get a chance to watch yesterday’s sessions (or want to see them again), here’s a roundup of day 8 of the conference:
Grafana plugins
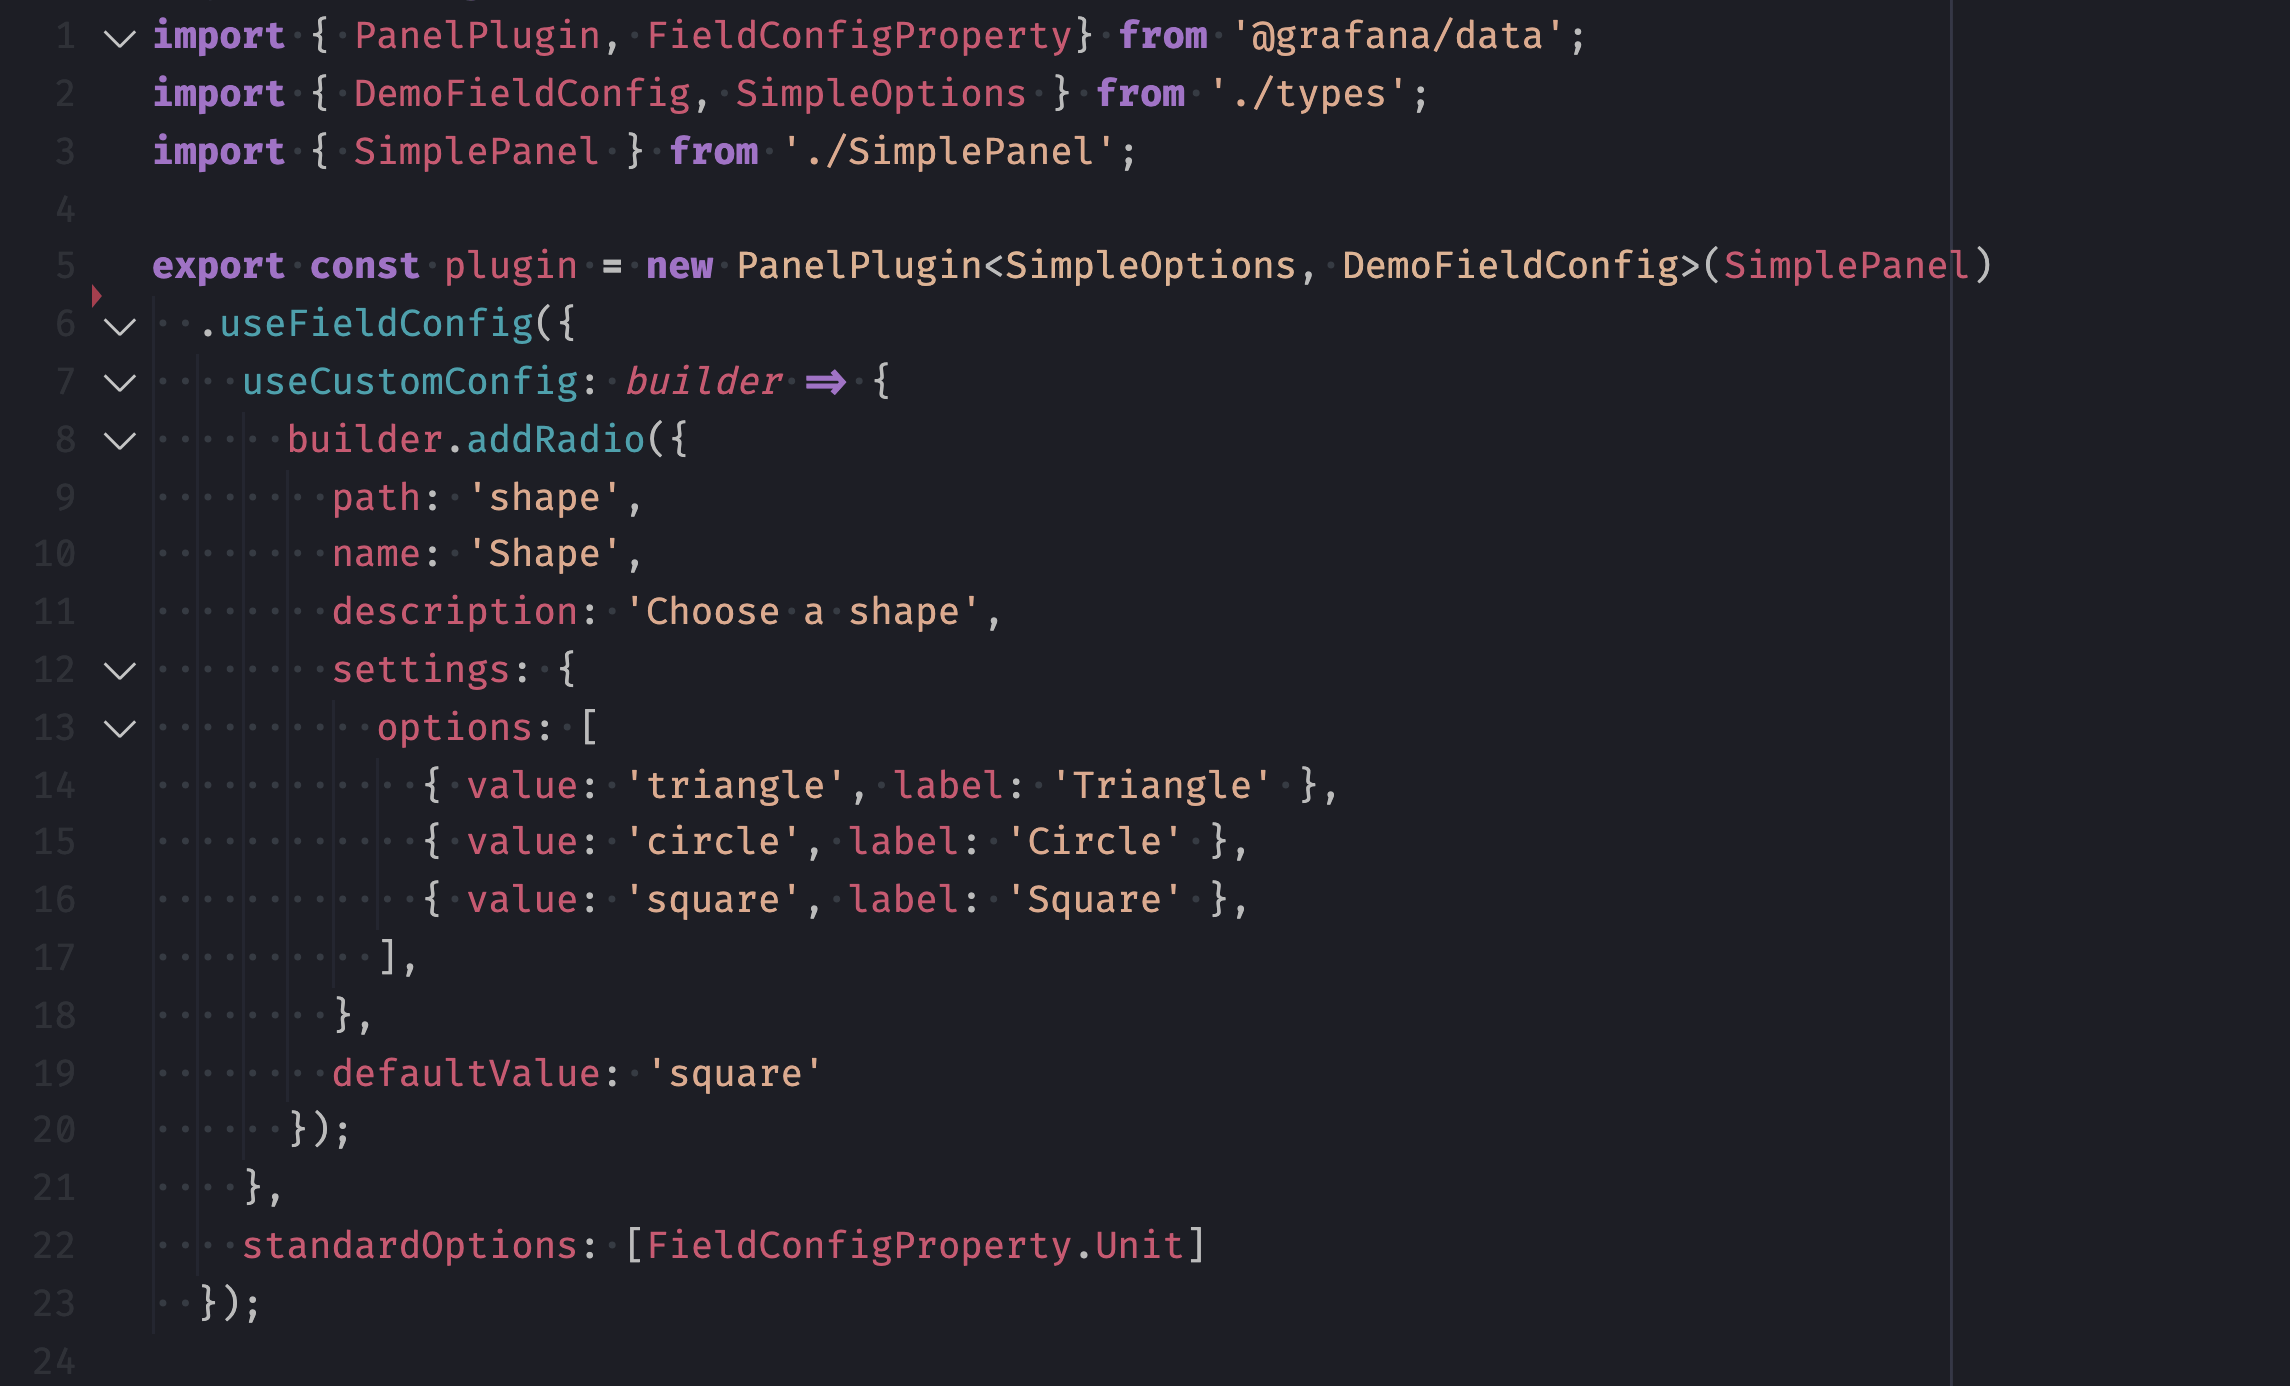
With the release of Grafana v7.0, the team introduced a new plugins platform for developers so they can build high-quality custom plugins exponentially faster. Grafana Labs software engineer Dominik Prokop walked through the new packages (@grafana/ui, @grafana/data, @grafana/runtime, and @grafana/toolkit) and presented a demo of the new declarative options API.
Watch the full webinar here
Chrome browsing data to Grafana – as you browse
Matti Paksula has been using Grafana for the past five years to visualize the data that thousands of browsers produce when they click around websites. Instead of leveraging Chrome Devtools to load test a website, Paksula, the CTO at supervisor.com, showcased how he uses time series data and Grafana to track site performance metrics in near real time. (Only a 1s delay!)

Check out his full talk here
Today’s sessions
Prometheus rate queries in Grafana with Grafana Labs principal software engineer Björn “Beorn” Rabenstein at 9:30am PT / 12:30 ET / 16:30 UTC
How to get an organization to adopt a telemetry solution with Bloomberg LP production visibility manager Stig Sorensen at 10:30am PT / 1:30pm ET / 17:30 UTC
Don’t forget that you can connect with the Grafana community and get the latest updates from the Grafana Labs team during the event on Slack. Sign up here and join the #grafanaconline channel.

