GrafanaCONline Days 3 & 4 recap: All about Grafana v7.0, the future of Prometheus, and the observability tools every company needs
GrafanaCONline is live! We hope you’re able to catch the great online sessions we have planned over the next couple of weeks.
If you haven’t had a chance to tune in lately, here’s what you missed on days 3 and 4 of the conference:
Grafana 7.0 released!
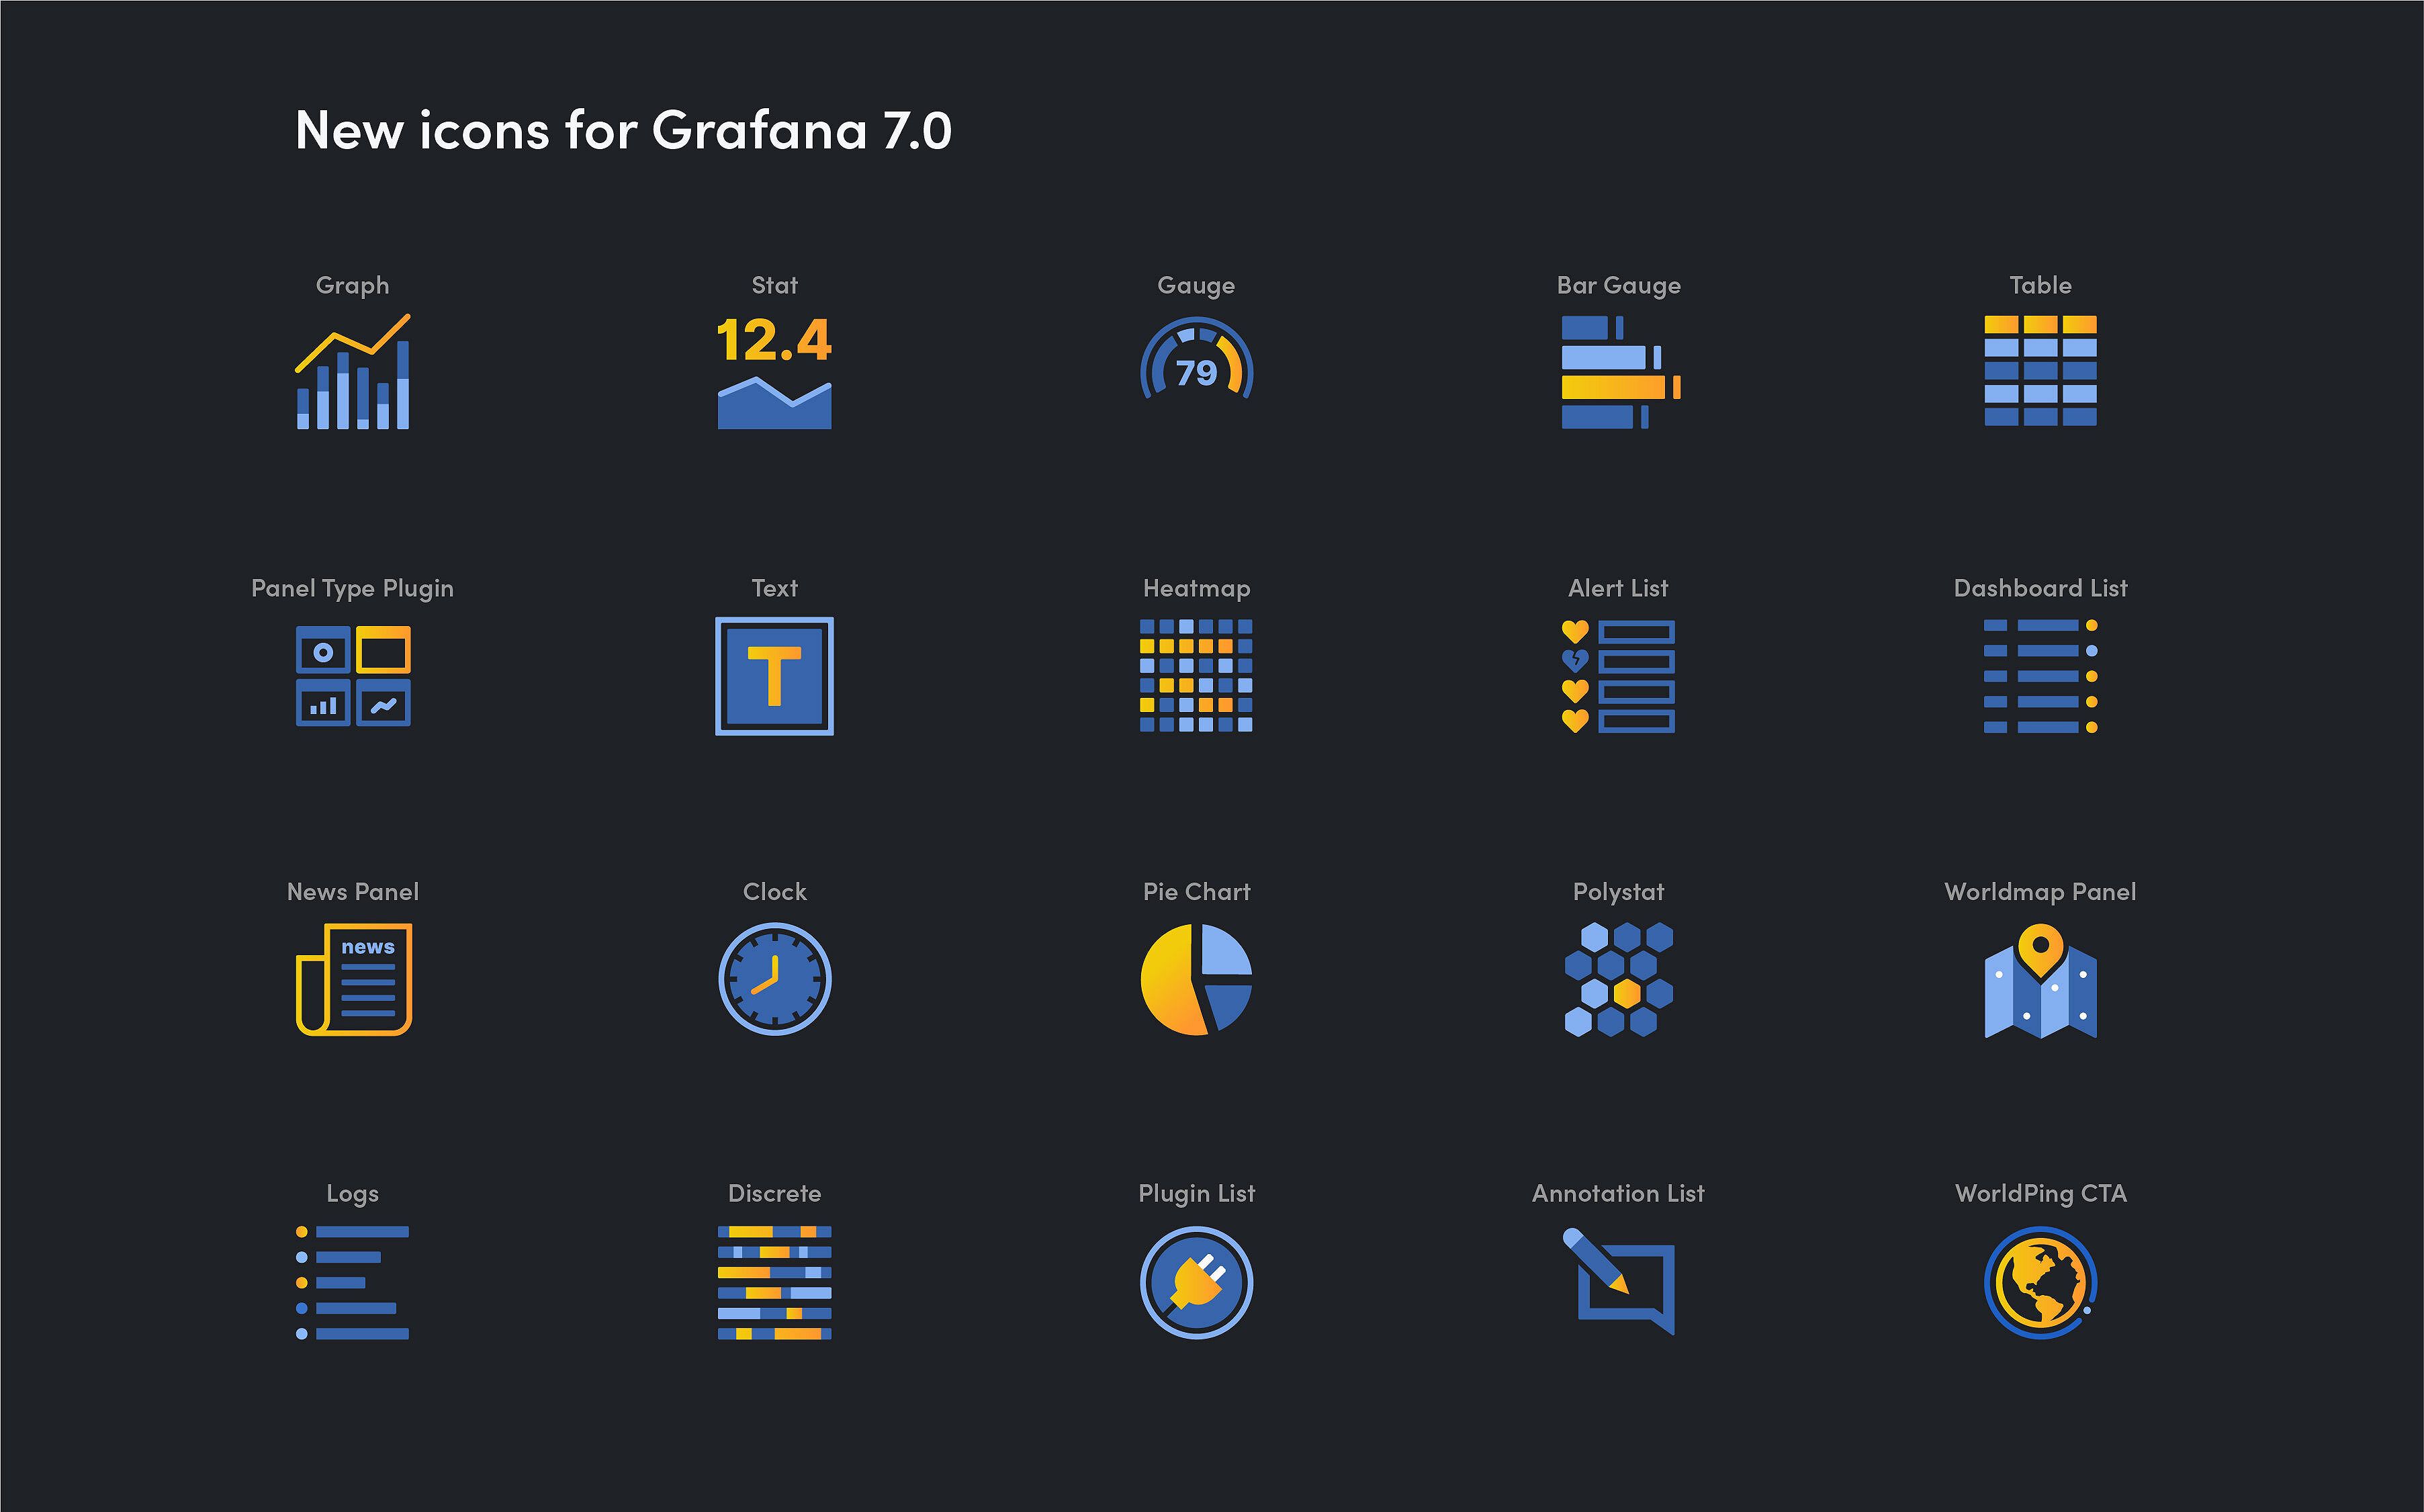
Grafana creator Torkel Ödegaard gave a full breakdown of everything you need to know about the newest features in Grafana v7.0, including UX enhancements and a unified data model, a new plugins platform, data transformations, and more.

For a full demo of how Grafana 7.0 works, click here. (After you sign in once with your email address, you will have access to all GrafanaCONline presentations.)
How Grafana disrupted the oil and gas industry
Jeremy Blevens, a SCADA supervisor in the oil and gas industry, and Damien Clark, a SCADA systems analyst at Whiting Petroleum, showcased how Grafana has revolutionized the way Whiting Oil and Gas monitors oil and gas wells in remote locations. Field assets are now managed and monitored using Grafana dashboards and alerting, which allows the company to continue growing their assets without increasing costs to manage them. Whiting now has more than 300 dashboards and 200 active users who rely on the data to make better decisions and prioritize their work.
Watch the full presentation here.
The future of Prometheus
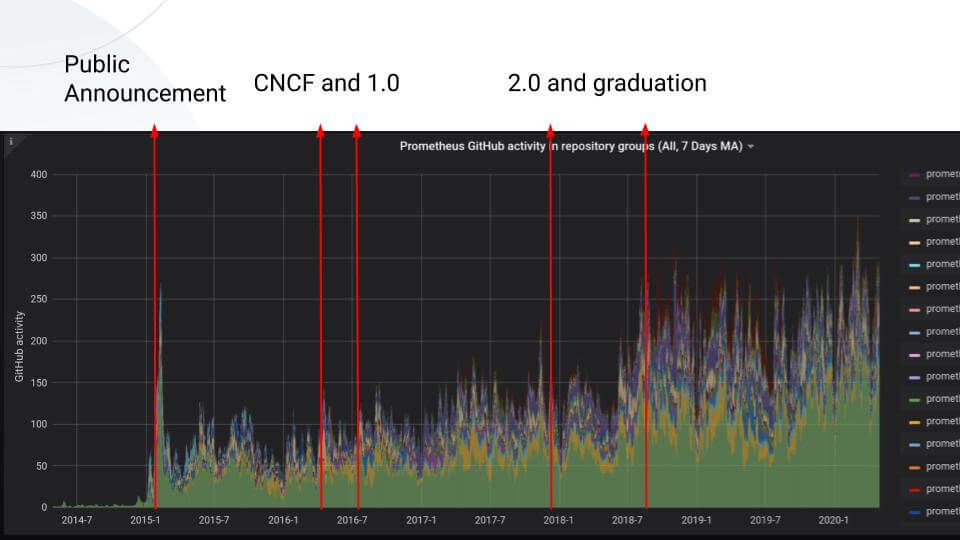
Grafana Labs software engineer Goutham Veeramachaneni walked through the evolution of Prometheus, including recent developments such as the introduction of isolation in version 2.17. Now with the developer community more active than ever, Veeramachaneni also focused on the road map ahead, which promises server-side metric metadata support, backfilling time series, the adoption of Open Metrics, and more.

Check out the session on demand here.
What does “observability” really mean?
In the era of services architecture, reliability engineering, and container orchestration, Strava engineering manager David Worth outlined the four observability concepts and tools that every company needs to adopt and how they overlap and work together.
In case you missed it, watch the talk on demand here.
Today’s sessions
-Nissan Leaf -> cloud of all things with Ed Welch -Slicing Kubernetes: Raspberry Pis, monitoring, and chaos with Jonan Scheffler
Don’t forget that you can connect with the Grafana community and get the latest updates from the Grafana Labs team during the event on Slack. Sign up here and join the #grafanaconline channel.
See the full schedule here.
