
Grafana v7.0 released: New plugin architecture, visualizations, transformations, native trace support, and more
We are thrilled to announce that Grafana 7.0 has been released for general availability. Torkel Ödegaard, the creator of Grafana, hosted a full demo of 7.0 during GrafanaCONline that you can view on demand.
With Grafana v7.0, our goal was to extend on the Grafana platform by making it easier and more consistent for existing users, and intuitive and simple for those not familiar with Grafana. This release includes significant enhancements to simplify the development of custom plugins and drastically increase the power, speed, and flexibility of visualization.
Interested in getting started with Grafana 7.0? Watch this webinar for a demo of the user interface and setup. You can also get started in minutes with Grafana Cloud. We have new free and paid Grafana Cloud plans to suit every use case — sign up for free now.
Highlights
Here are some of the features we’re excited about in Grafana 7.0:
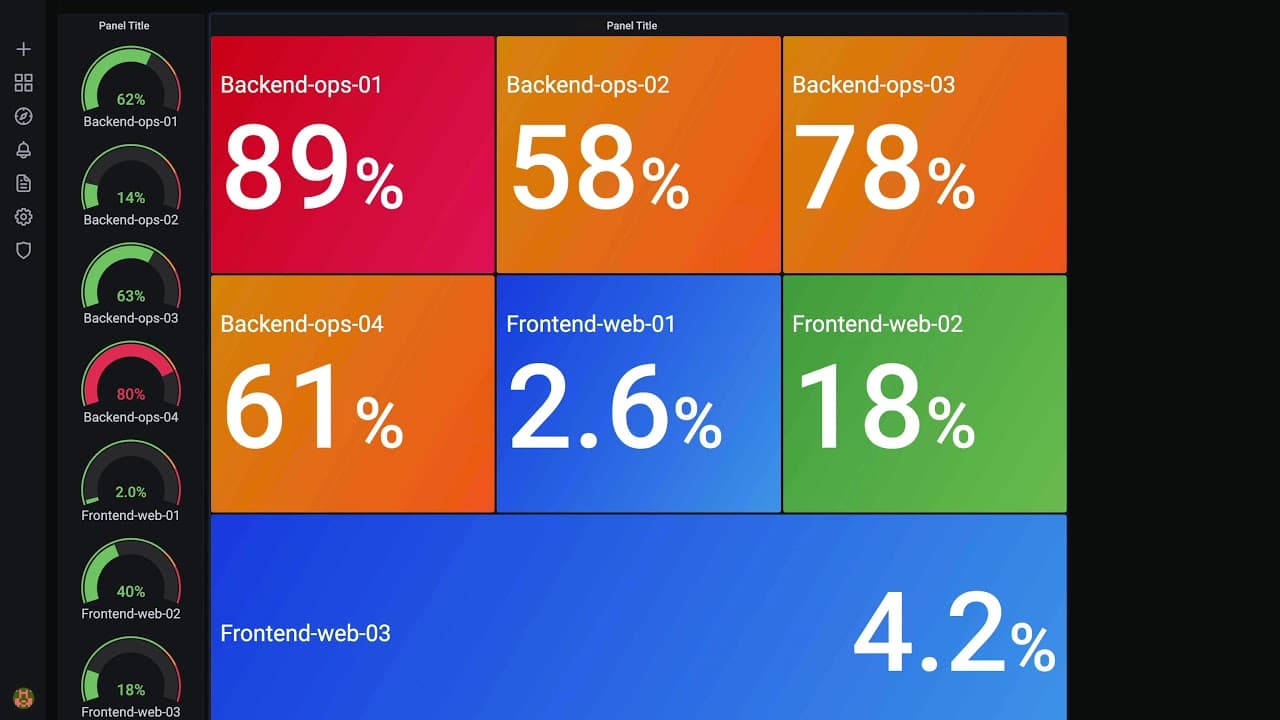
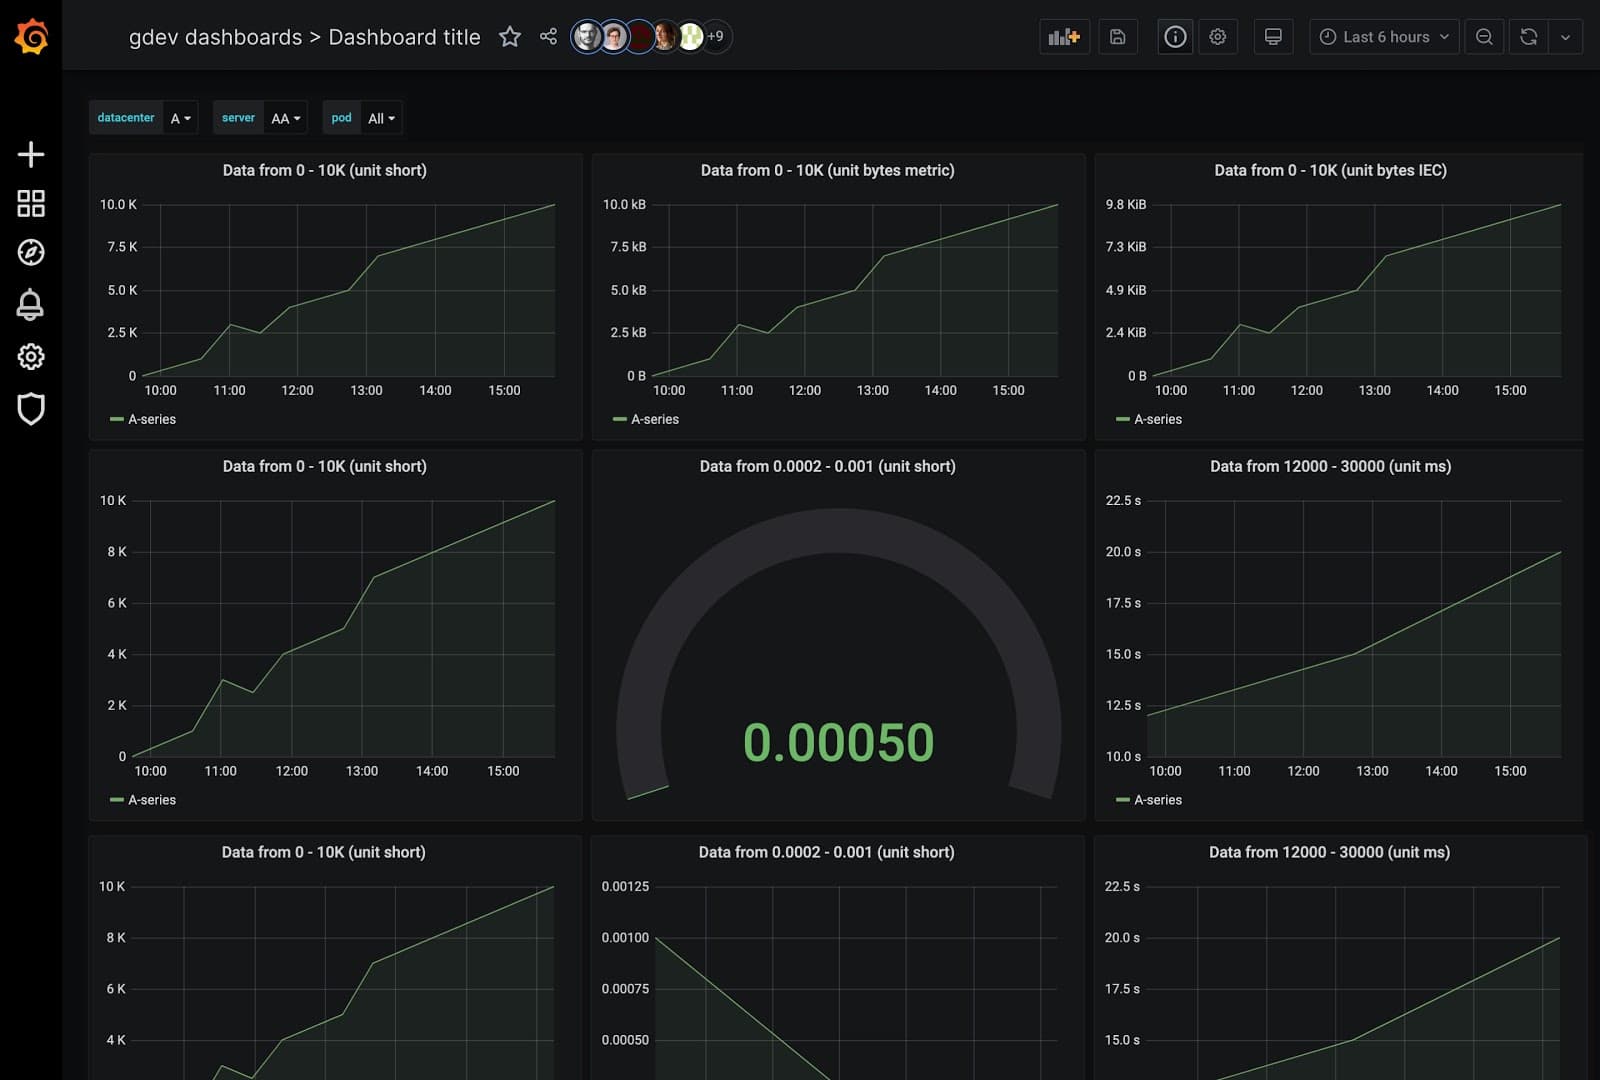
- UX Enhancements and Unified Data Model: Enhanced UX and visualization options for better consistency and usability including a new table panel, a new grid layout engine, and an improved experience for editing panels. Data visualizations are now based on specific data configurations (min/max/mean graphs, etc.) to provide better consistency across Grafana.
- Plugins Platform: Advanced platform allows users to easily create new Plugins faster and more efficiently.
- Tracing: Support for Jaeger data source; traceIDs within Loki to reduce mean time to resolution.
- Transformations: The new Transformations capabilities allow users to go beyond data visualization and transform all types of data.
- Inspect and Export: New data inspection feature lets users see, export (CSV), and perform simple transformations (like pivot and join) on the underlying source data for a panel.
- AWS CloudWatch Logs: Added support for AWS CloudWatch Logs.
- Usage Analytics and Presence: This Enterprise feature helps large companies get better insight into the behavior and utilization of their users, dashboards, and data sources. You can now quickly decipher which other users are currently viewing the same Grafana dashboard.
UX enhancements and unified data model
UX enhancements
Users may notice things look a little different in dashboards and panels with the release of 7.0 – more intuitive, simpler, and (we think) a little better.
We’ve redesigned the Panel Editor so there is a consistent experience throughout Grafana. These updates also make it easier to customize your panels and dashboard by providing:
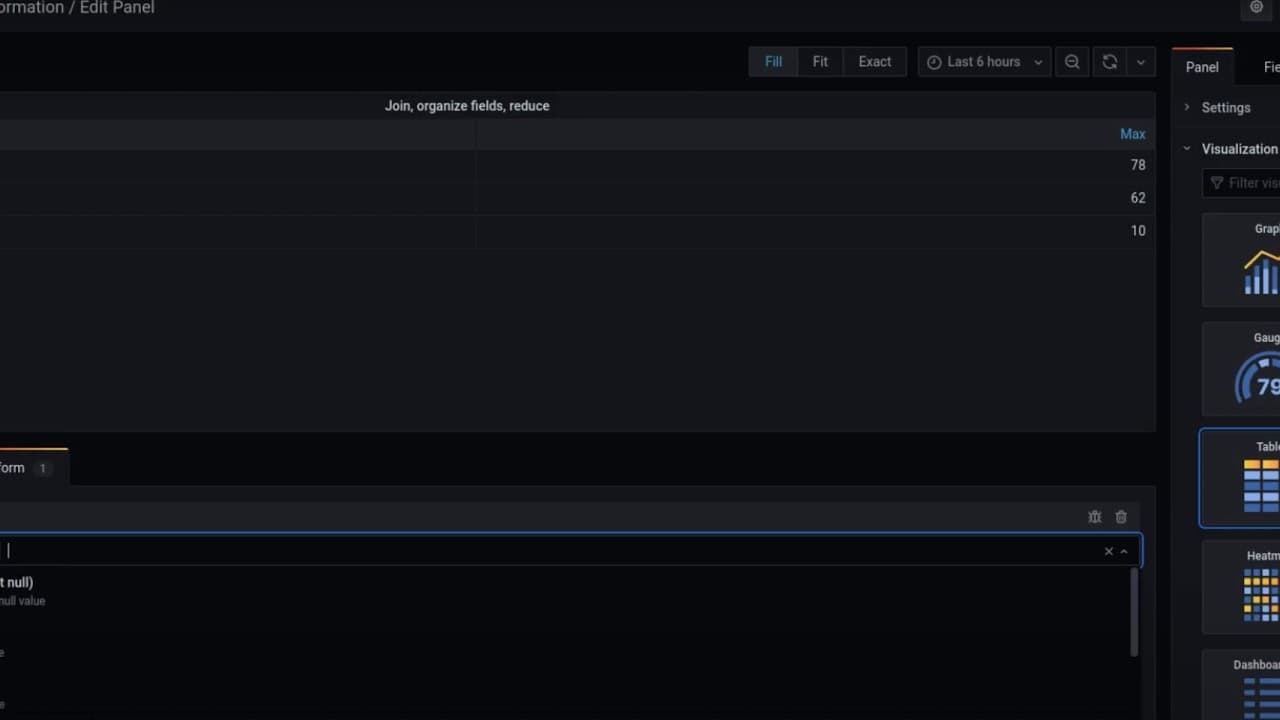
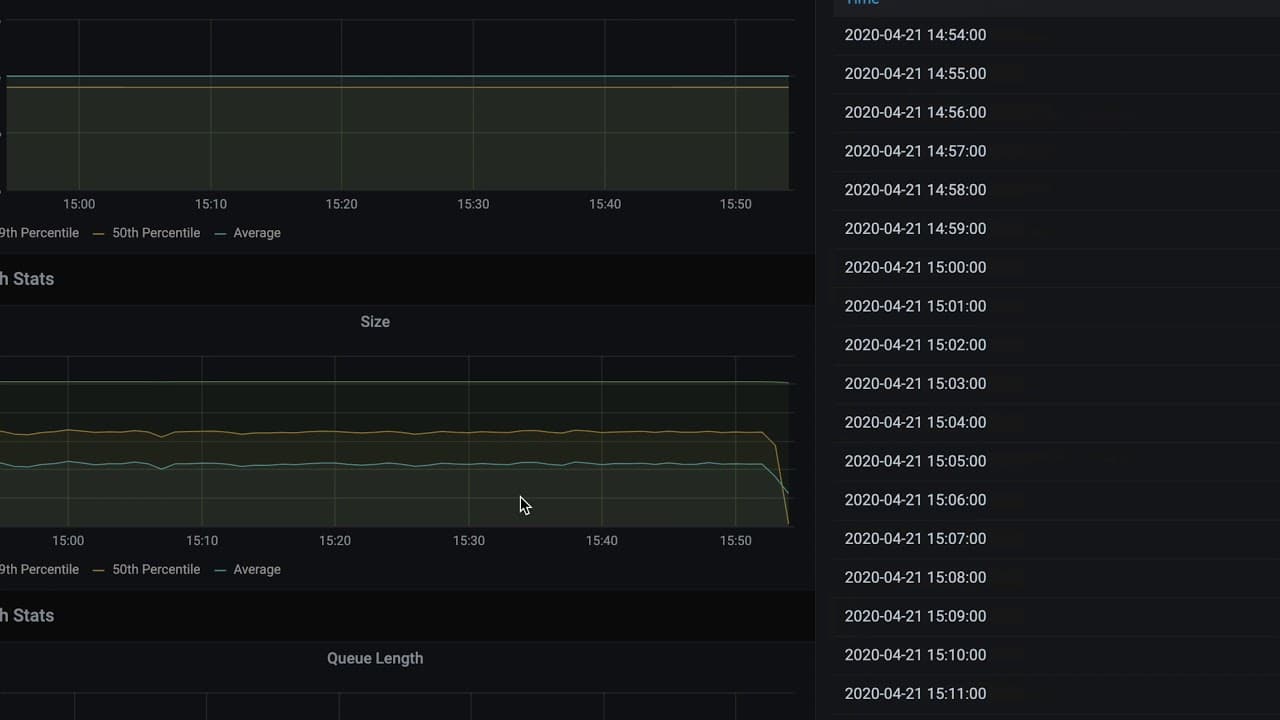
- A new table panel that supports horizontal scrolling and column resize. Users have the ability to collapse or expand, reorder, hide, and rename columns in the editor so they can see exactly what they need to focus on. This new panel also supports new cell display modes, like showing a bar gauge inside a cell.

- A new auto layout mode that makes it easier to resize panels for a variety of formats including tables, non-time-series data, and charts.
- The ability to override the time zone used to display date and time values in a dashboard. One benefit of this is that you can specify the local time zone of the service or system that you are monitoring, which can be helpful when monitoring a system or service that operates across several time zones.
- Fresh new icons

Unified data model
Grafana 7.0 features a new unified data model that makes it possible to define specific data configurations with attributes like unit, min, max, thresholds, data links, decimals, units, or value mappings. This is an exciting improvement because in previous versions of Grafana, each visualization had slightly different ways to make all data display settings data-driven and override rules. Now users have a consistent way to define data sources, conventions, user defaults, and override rules.
Tracing
As organizations continue to break down their monolithic architectures in favor of more scalable, agile microservices environments, they face new challenges brought on by these distributed architectures. Specifically, the massive amount of data in complex architectures makes it challenging to understand how a downstream service can create an issue in a system. And since there is so much more data generated, depending on logs alone is too time consuming when there is an outage. For this, you need a complete view into your entire system.
Grafana’s Tracing feature in 7.0 was built to solve this exact problem by providing full native support for trace data so you can achieve a seamless and unified experience that connects and visualizes metrics, logs, and traces. Tracing provides engineers with a detailed view about how a single trace has traveled through your distributed system.
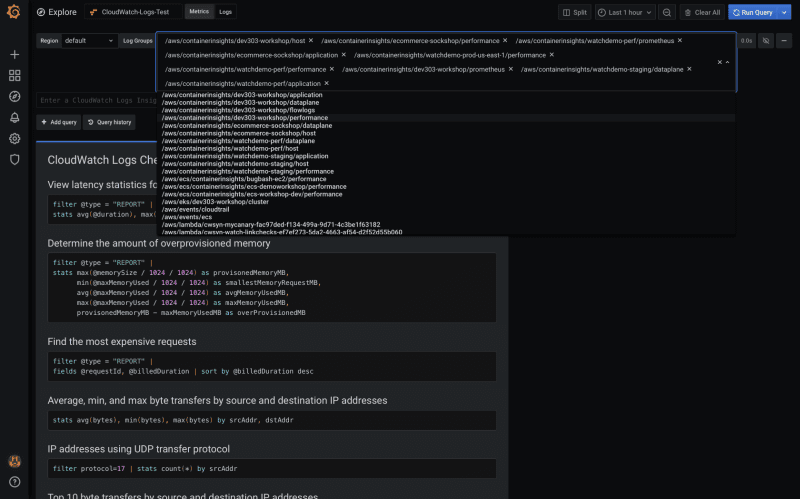
You can use the new trace view in Explore either directly to search for a particular trace or you can configure Loki to detect trace IDs in the log lines and link directly to a trace timeline pulled from your Jaeger or Zipkin data source.

Plugins platform
The new Plugins Platform makes it easier for all Grafana users to build high-quality plugins exponentially faster. In the new Plugins Platform you’ll find:
- A new React component library provides a consistent framework that makes it easier and faster for users to create plugins. This also creates more consistency so the Grafana team can easily support and improve on community-built plugins. The new @grafana/ui components library is documented with Storybook (visual documentation) and is available on NPM.
- New tools for building plugins via the @grafana/toolkit deliver a simple CLI that helps plugin authors quickly scaffold, develop, and test their plugins without worrying about configuration details. We created this so now creating Plugins isn’t “grunt work” or dependent on a webpack expert. Anyone can easily create a plugin.
- New data formats are based on a more generic structure so they can return different types of data like non time-series data such as JSON or static resources (i.e., that enable users to create panels and dashboards from non-time-series data). These new data formats have a more generic structure that can hold different shapes of time series, tables, and other types.
- Support for backend plugins: Optionally, users can add a backend component to their data source plugin and implement the query logic there to automatically enable alerting in Grafana for plugins.
This Plugin Platform was designed for everyone from power users who have been using Grafana for years to people who are just getting started with Grafana. To help you get started with Grafana, we’ve launched a brand new tutorials platform. We’ll continue to expand the platform with more tutorials, but here are some of the ones you can try out now:
Transformations
This is one of our most requested features ever. Now you can now transform non-time-series data into tables (e.g., JSON files or even simple lookup tables) in seconds without any customization or additional overhead. Moreover, you can then combine non-time-series data with any other data in Grafana, be it data from an external database or a panel that already exists in one of your current dashboards.
By chaining a simple set of point and click transformations, you will be able to join, pivot, filter, re-name, and calculate all kinds of data to quickly customize your panels.
Transformations are specifically useful for current users with large dashboards or teams that need to be able to run complex queries on non-time-series data, since it allows operations across queries and the addition of previously missing data sources into a single panel.
Inspect and export
With the new Panel Inspector, you can perform simple raw data transformations like join, view, query stats or detailed execution data. The Panel Inspector is also included in all internal and external community plugins.
Previously, the ability to “Download as CSV” only existed as a custom feature for the Graph & Table panel. Now, with 7.0’s unified data model and processing, you can download panels as CSVs for all panels.
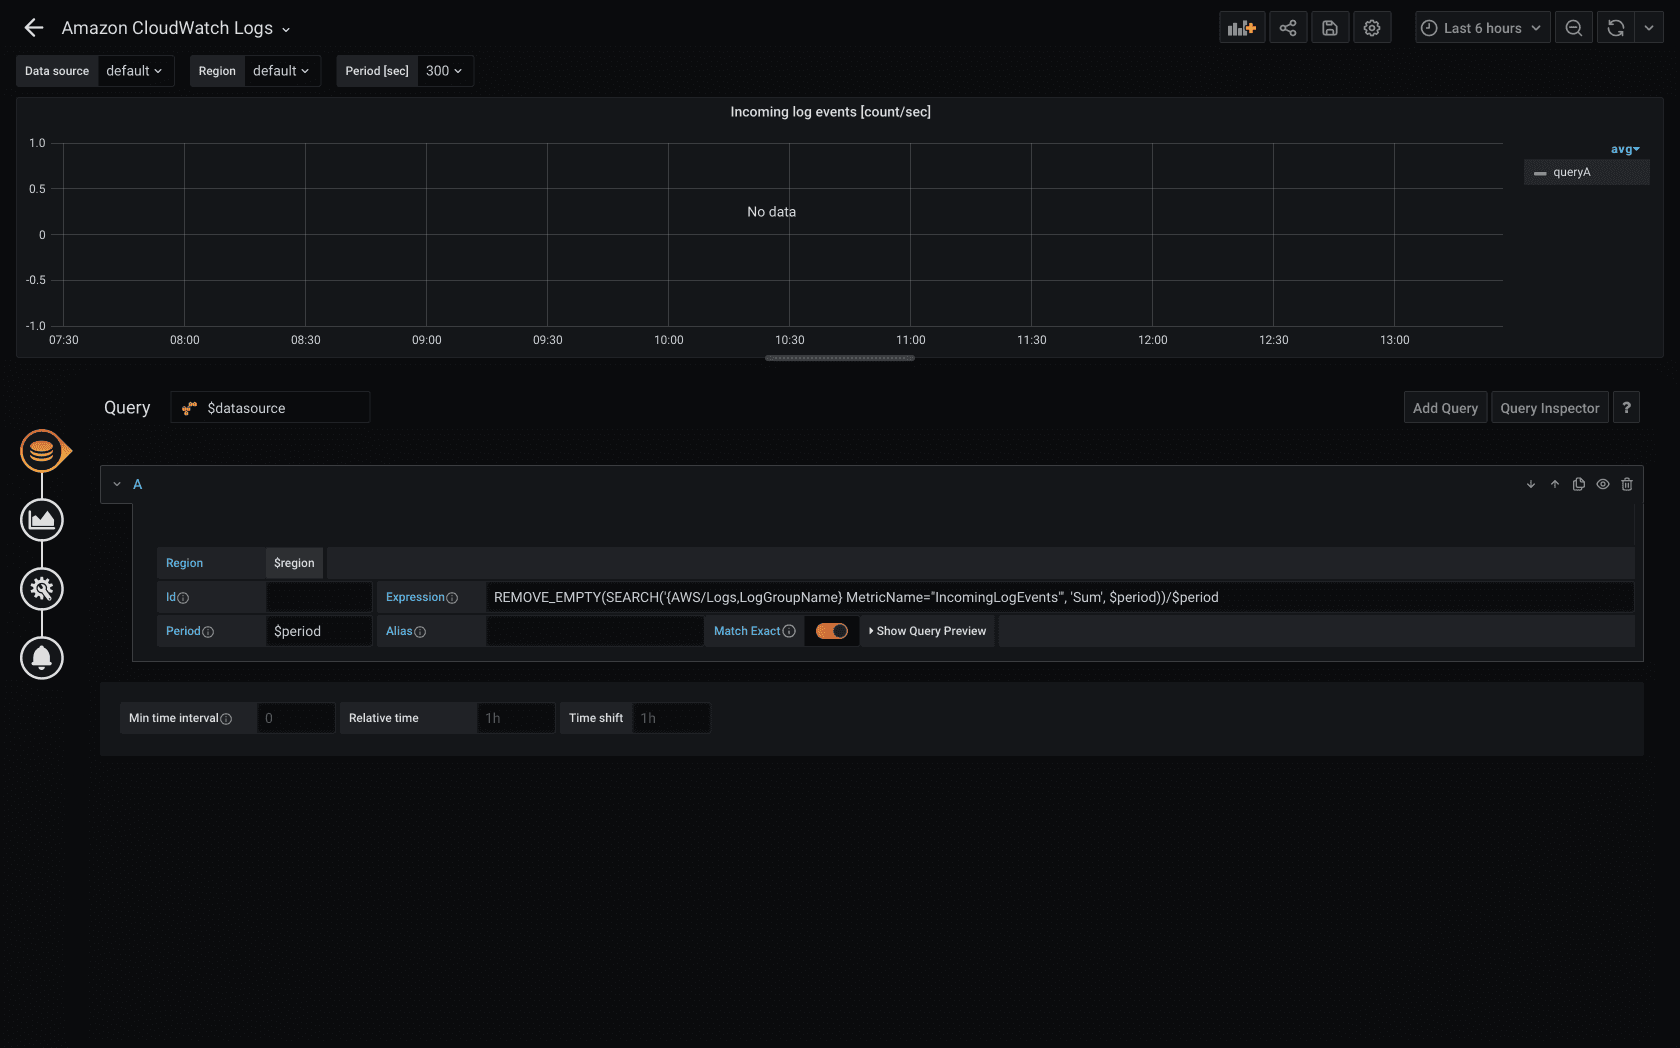
AWS CloudWatch Logs
We added logging support to one of our most popular cloud provider data sources, AWS CloudWatch Logs. With this addition, Grafana can improve the observability for any users running on AWS because now it will be easier to investigate issues with CloudWatch metrics and logs side by side in Grafana.
Usage analytics and presence
This “Grafana about Grafana” feature will help our Enterprise customers get better insight into the behavior and utilization of their users, dashboards, and data sources.
This insight will help you answer questions like:
- There are too many dashboards; how do I find the right one?
- How do I find popular dashboards?
- How do I find dashboards with errors?
- How do I identify dashboards that are not being used?
- Who created or last viewed this dashboard?
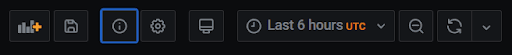
Users can see dashboard usage information by clicking on the Dashboard Insights button in the top bar.
This dashboard includes two important things:
- Stats: Shows the daily query count and error count for the last 30 days.
- Users & activity: Shows the daily view count for the last 30 days, last activities on the dashboard, and recent users (with a limit of 20).
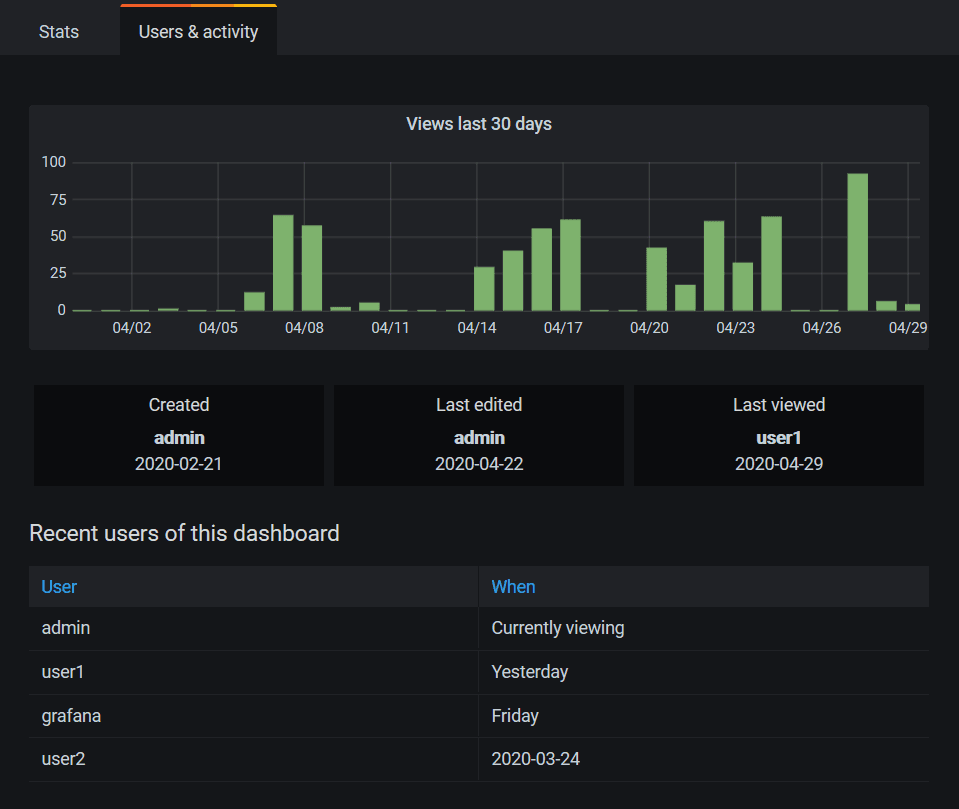
When users open a dashboard, they will see a presence indicator of who else is viewing the same dashboard. They can open a dashboard usage stats drawer to view recent dashboard usage. Similar to Google Docs, this will show users who are currently viewing the same dashboard, which is useful for large organizations during troubleshooting/outages.
Changelog
Check out CHANGELOG.md for a complete list of new features, changes, and bug fixes.
Upgrade Grafana
Download or try Grafana 7.0 in the cloud today.
Refer to Upgrading for more information about upgrading your Grafana installation.
Interested in getting started with Grafana 7.0? Watch this webinar for a demo of the user interface and setup.
Thank you to the community
A big thanks to all the Grafana users who contributed by submitting PRs, bug reports, and feedback!

