
Grafana 7.0 preview: New image renderer plugin to replace PhantomJS
Many Grafana users export images of their dashboard panels. This feature powers the ability to receive alerts with a rendered image of the panel attached, which is valuable for quickly spotting if something is about to go sideways in production.
Since Grafana v2.0, when support for server-side rendering of dashboard panels as images was introduced, PhantomJS has served as the built-in image renderer that enables this feature. In the upcoming 7.0 release, we are removing PhantomJS and replacing it with a new image renderer plugin. In this blog post we talk about why we’re doing this, what this change means for you, how to prepare for the 7.0 upgrade, and highlights of some new features and recommended best practices.
Some background
To date, the Grafana GitHub repository has seen around 200 issues opened mentioning PhantomJS. Many of these have been bugs and security-related issues, mainly due to the fact that PhantomJS has struggled with supporting modern web technologies. Throughout the years, maintaining PhantomJS support in Grafana has been a nightmare. Removing support for PhantomJS has been a high priority for the Grafana project, and this became even more urgent in March 2018 when the PhantomJS maintainer announced the end of the project.
Since then we have been working toward removing PhantomJS. In October 2019, when Grafana v6.4 was released, we announced the deprecation of PhantomJS. This month, Grafana v7.0 will remove all PhantomJS support, which means that Grafana will no longer include a built-in image renderer.
Introducing the Grafana Image Renderer plugin
As a replacement for PhantomJS, we’ve developed the Grafana Image Renderer plugin, which is a plugin that runs on the backend and handles rendering of panels and dashboards as PNG images using a headless browser (Chromium/Chrome).
The plugin has been supported since June 2018, when Grafana v5.2.0 was released; however, to use it, you had to build it from source. In August 2019 the plugin was released and published on grafana.com, so that you can install it using the Grafana CLI tool. A month later the official first version of the Grafana Image Renderer Docker image was released.
The plugin can either be installed as a Grafana plugin running in its own process side-by-side with Grafana, or run as a remote rendering service, hosted using Docker or as a standalone application.
Installing and configuring the service using Docker
In this example we’re going to use Docker Compose, since it simplifies explaining how everything fits together.
We have this docker-compose.yaml file in a directory named example. The Docker Compose file consists of two services, Grafana and Grafana Image Renderer:
version: '2'

services:
  grafana:
    image: grafana/grafana:7.0.0-beta1
    ports:
      - 3000
    environment:
      GF_RENDERING_SERVER_URL: http://renderer:8081/render
      GF_RENDERING_CALLBACK_URL: http://grafana:3000/
      GF_LOG_FILTERS: rendering:debug
  renderer:
    image: grafana/grafana-image-renderer:2.0.0-beta1
    ports:
      - 8081
    environment:
      ENABLE_METRICS: 'true'
We’re starting the containers by running:
> cd example
> docker-compose up -d
Creating network "example_default" with the default driver
Creating example_renderer_1 ... done
Creating example_grafana_1  ... done
This will also create an internal network where Grafana and the rendering service can communicate with each other using DNS. The DNS names are the service names in the Docker Compose file, grafana and renderer. Because of this we’ve configured Grafana to use the URL to the rendering service as http://renderer:8081/render using the environment variable GF_RENDERING_SERVER_URL. When Grafana calls the rendering service, it provides the URL to be used for rendering an image. This URL by default is http://localhost:3000 (based on Grafana configuration). Therefore, we’ve configured Grafana to instead use the callback URL http://grafana:3000/render using the environment variable GF_RENDERING_CALLBACK_URL.
To be able to reach Grafana and the rendering service on the internal network from the outside, you have to look up their IP addresses. You can inspect the Docker network and find the IP addresses:
> docker network inspect example_default
...
"Containers": {
            "471e6dbc3583ed3ace167ff1f3c1a8e9a46ed2ef2aaf9b31a52d761a580ff246": {
                "Name": "example_grafana_1",
                "EndpointID": "99a1c053642b1a3a6b05530650ce7c75c047938a630f1c63ac5996ede87d7951",
                "MacAddress": "02:42:ac:14:00:02",
                "IPv4Address": "172.20.0.2/16",
            },
            "a2317fbf74fb2e5b9589ba50931fab6f3353e40270dba4c533dd355ef0cb4bac": {
                "Name": "example_renderer_1",
                "EndpointID": "a07198def4d5607a953be55ee52594c0b250679b9de6b3efdd0081fd60a1fd03",
                "MacAddress": "02:42:ac:14:00:03",
                "IPv4Address": "172.20.0.3/16",
            }
        },
Based on the above example, we can now access Grafana and the rendering service via the browser by opening http://172.20.0.2:3000 and http://172.20.0.3:8081 respectively. Using Grafana we can now create a new dashboard, add a panel, and save the dashboard. Then we open the context menu of the panel and select Share, and on the Link tab we click on the Direct link rendered image link. A rendered png image of the panel should open in a separate window.
The first thing to check in case of problems is to verify network connectivity between Grafana and the rendering service. Grafana needs to be able to communicate with the rendering service, and the rendering service needs to be able to communicate with the Grafana instance that initiated the render request. One way to verify this is to use curl or wget network utilities to make HTTP requests from/to Grafana/rendering service.
Installing the plugin
The plugin is packaged in a single executable with Node.js runtime and Chromium browser. This means that you don’t need to have Node.js and Chromium installed in your system for the plugin to function.
However, the Chromium browser depends on certain libraries, and if you don’t have all of those libraries installed in your system, you may encounter errors when trying to render an image. For further details and troubleshooting help, please refer to the Grafana Image Rendering documentation.
See plugin installation for instructions for installing the plugin. We’re planning to have further instructions in regards to configuration and monitoring when Grafana v7.0 stable is released this month.
Recommendations and best practices
If you run Grafana using Docker, we highly recommend that you run the remote rendering service using Docker. Installing the plugin in Grafana’s official Docker image is not supported; however, there are instructions for building a custom Docker image if you still want to go down this unrecommended path.
Since the underlying technology being used is an actual browser, it’s quite CPU and memory resource intensive. We recommend at least a couple of gigabytes of memory to start with.
Scaling out the service
To be able to handle additional render requests/load we recommend that you scale out the service by increasing the number of running instances and putting a load balancer in front.
This is what we do in Grafana Cloud. We host the rendering service in Kubernetes. In a cluster we have one deployment, consisting of multiple rendering service pods, that’s being served behind an ingress providing load balancing. With this setup we can provide rendering capabilities for multiple Grafana instances.
By default, a headless browser is started on each render request. This makes the service vulnerable to denial of service (DDoS) attacks. When preparing to deploy this in Grafana Cloud, we did some investigations of how to protect against DDoS attacks and optimize the throughput for rendering an image. You can see the GitHub pull request, which also includes details of load test results.
Based on these investigations, it’s now possible to instruct how headless browser instances are created by configuring a rendering mode. When using the clustered mode you can define how many browser instances or incognito pages that can execute concurrently. In addition, browser instances are pre-started when the service starts and by that providing a faster response when the first request arrives. In Grafana Cloud we use the clustered mode and create a new Incognito page on each request, and this have proven to give a good throughput, between 1 to 5 seconds in average render time.
Given the above Docker Compose example, we can extend that with a couple of environment variables to open a headless browser instance when the service starts and then, for each render request, open an Incognito page (limited to a maximum of 5 concurrent Incognito pages):
version: '2'

services:
  grafana:
    image: grafana/grafana:7.0.0-beta1
    ports:
      - 3000
    environment:
      GF_RENDERING_SERVER_URL: http://renderer:8081/render
      GF_RENDERING_CALLBACK_URL: http://grafana:3000/
      GF_LOG_FILTERS: rendering:debug
  renderer:
    image: grafana/grafana-image-renderer:2.0.0-beta1
    ports:
      - 8081
    environment:
      ENABLE_METRICS: 'true'
      RENDERING_MODE: clustered
      RENDERING_CLUSTERING_MODE: context
      RENDERING_CLUSTERING_MAX_CONCURRENCY: 5
You can read more about the rendering mode here.
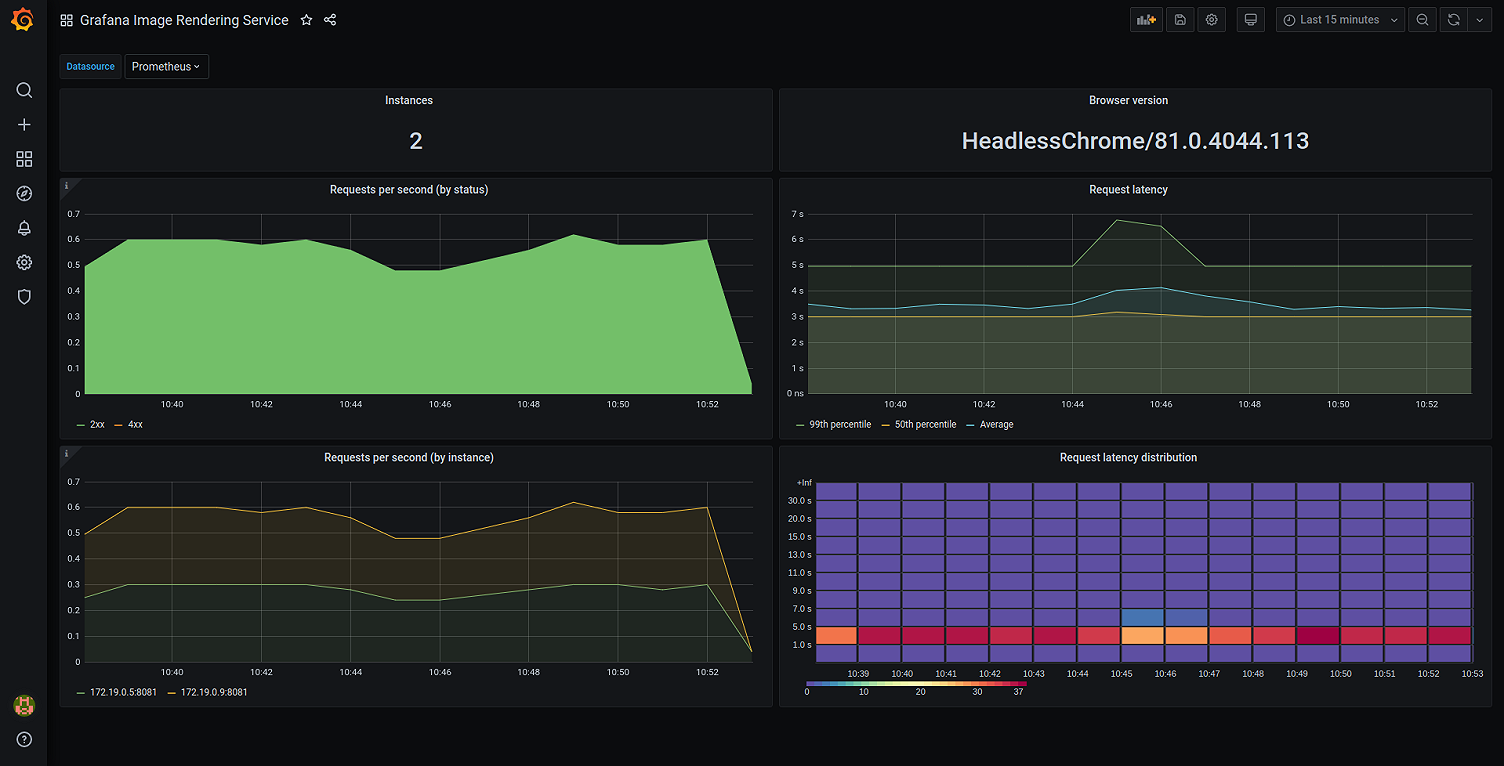
Monitoring the service
The service can be configured to expose a Prometheus metrics endpoint. We’ve published a dashboard that explains the details of how to configure and monitor the rendering service using Prometheus as a data source.

Known issues and limitations
Supporting a headless browser on multiple architectures and platforms has proven to be challenging based on the bug reports we’ve received so far. But together with the community and help from customers, we’ve sorted out most of them. In case of problems we recommend first checking out the troubleshooting guide. If that doesn’t help, please check the open GitHub issues or open a new GitHub issue in case your problem is not already mentioned in an issue. If you have any questions, please ask them on the Grafana Community site.
The Grafana Image Renderer plugin won’t work if you don’t have IPv6 enabled. We’re currently looking into possible solutions for resolving this. The current workaround is to use the remote rendering service instead. Please refer to this GitHub issue for more information.The latest version, v2.0.0 as writing, resolves the IPv6 issue.The Grafana Image Render plugin and Docker image are currently not supported on ARM architectures. There’s an open GitHub issue requesting ARM support that includes some suggestions from the community on how you could get it to work. We kindly ask users of ARM devices who want support to upvote the issue and share any information that could be valuable for your use case. With enough interest we will prioritize this. We’re of course always happy to receive contributions, if anyone is interested.
When using Grafana Cloud, you don’t have to bother configuring and setting up the Grafana Image Renderer – we’ll host it for you.
In summary
The upcoming Grafana v7.0 release removes the built-in image renderer, PhantomJS, and replaces it with the Grafana Image Renderer plugin. We’ll keep working on improving the image rendering documentation.
The 7.0 beta is available now! Download here.
Check out our other previews of 7.0:
We’ll be making more announcements as we get closer to the 7.0 release during GrafanaCONline. To receive updates and information on how to tune in to our live streamed GrafanaCONline presentations, sign up here.