
Improving Graphite rollup and runtime consolidation in Metrictank and Grafana 7.0 with lineage metadata
The Grafana and Metrictank/Graphite teams have been hard at work to deliver an exciting new feature for the upcoming Grafana v7.0 release: a rollup indicator and series lineage metadata breakdown for Metrictank. This blog will cover the new functionality around Metrictank metadata, the rollup indicator, and the lineage visualization coming in 7.0.
The issue: rollups and consolidation can be tricky
When interviewing various Grafana Cloud customers and Graphite and Metrictank users, we found there was a common theme around query diagnosis, consolidation and rollups: Rollups and runtime consolidation are a very powerful and handy technique, but unless great care is taken constructing queries, these features may sometimes lead to incorrect charts. Visualizations could look anywhere from slightly off to plain wrong, and people weren’t sure why. Sometimes the wrong rollup would be used or an improper runtime consolidation invoked.
In fact, it’s an issue we within Grafana Labs have struggled with as well.
Until now, it has been a challenge to look into these issues, because neither Grafana, Graphite, nor Metrictank would provide clues into how the returned data was retrieved or constructed. We wanted to solve this thoroughly.
Take for example this issue filed by Bloomberg, a longtime power user that tracks hundreds of billions of data points daily with Metrictank and Grafana:
We have users with many Charts on a single dashboard. Depending on the cardinality of the data and the time range MetricTank may return rolled up data (in our case, configured for hourly). This can be subtle as potentially only 1 or 2 graphs out of nine are rolled up. Also when the overall dashboard date range changes, sometimes from as little as 12 hours to 24 hours, rollup data is used. It would be extremely nice if there were an indicator that rolled up data was used. A mouse over would provide the configuration, e.g. hourly, daily.
Considering all the different feedback gave us the idea that we wanted to solve this problem in two ways:
A quick, at-a-glance (optional) “rollup indicator” on the panel header, showing when data is not raw.
An in-depth overview of the lineage of all series included in the response.
To understand what we mean by lineage, let’s look at the various steps involved in responding to a query. But first, a definition:
A series consolidation is performed by taking multiple successive points and reducing them to single points, using a certain mathematical function. For example, for a series with a 1-second interval that needs to be consolidated to a 5s interval, every 5 points will be aggregated together using a function such as average, min, max, count, or last.
Series consolidation happens at various phases within Metrictank, which we can exemplify by looking at the various steps involved in responding to a query from a client.
Chunk data is fetched from storage (and caches) and decoded into series. The data that is fetched may be raw, or may be a rollup. Rollups are consolidated (at write time) versions of series. They are used in Metrictank and Graphite to store old data cheaply and more performantly for long-term. Typically, data is read from rollups when the query requests old data, or when the volume of data requested is too high to be handled with raw data.
Normalization: Series that need to be combined together (e.g., in sumSeries(), divideSeries(), etc.) need to have compatible, matching intervals. This may require consolidating some of the fetched series to a lower precision. Note: Metrictank employs an optimization called pre-normalization. It figures out which series will need normalizing and to which intervals, and if series happen to have a rollup defined that already has that lower resolution interval, we will fetch from that, which means less data to load and no need to normalize. (For example, when you request sumSeries combining minutely raw data with other data that is secondly raw, but has a minutely rollup.)
Series run through the function-processing API. (sumSeries, groupByNode, alias, etc.)
Runtime consolidation: This last form of consolidation may be applied to honor the MaxDataPoints value, which is used to constrain the amount of returned points, typically to not exceed the amount of pixels available for the panel in Grafana.
As you can see, at various points there is a chance of series being consolidated due to rollups, normalization, or runtime consolidation. If this didn’t use the appropriate function, a chart may be wrong and confusing. Let’s see how we have solved this.
The solution
We built a feature that gives you a high-level breakdown of all the data displayed on your charts: How did the data come about? How many series are from rollup archives? How were they consolidated or normalized? And so on.
The Metrictank and Grafana teams worked closely together on this, particularly myself, Torkel Ödegaard, and Ryan McKinley. Ryan was designing a new panel inspector, which has become the perfect home for visualizing the metadata.
The new functionality is powered by:
Additional lineage metadata for each returned series from Metrictank. All the new fields are documented here.
The new panel inspector, which can show all lineage information.
An optional, small indicator on the panel header, which gives an at-a-glance view into any consolidation performed.
An example
Let’s say you have a statsd count for your website visits. A very common pattern is to want to have hourly summaries. This chart shows the amount of hits we had on an hourly basis, by summing all the counts together. We see a daily trend that peaks roughly around 1.5 million hourly visits.

Zooming in on one of these peaks, we can see the individual datapoints: Every 10 seconds there’s a count of around 4000 hits. An hour’s worth is 1.44 million (4000*6*60), so that checks out.

Now, let’s see what happens when we zoom out to a 30-day view.

The numbers are way off! What is going on here?
Well, if you have the rollup indicator enabled, it already provides a helpful clue:

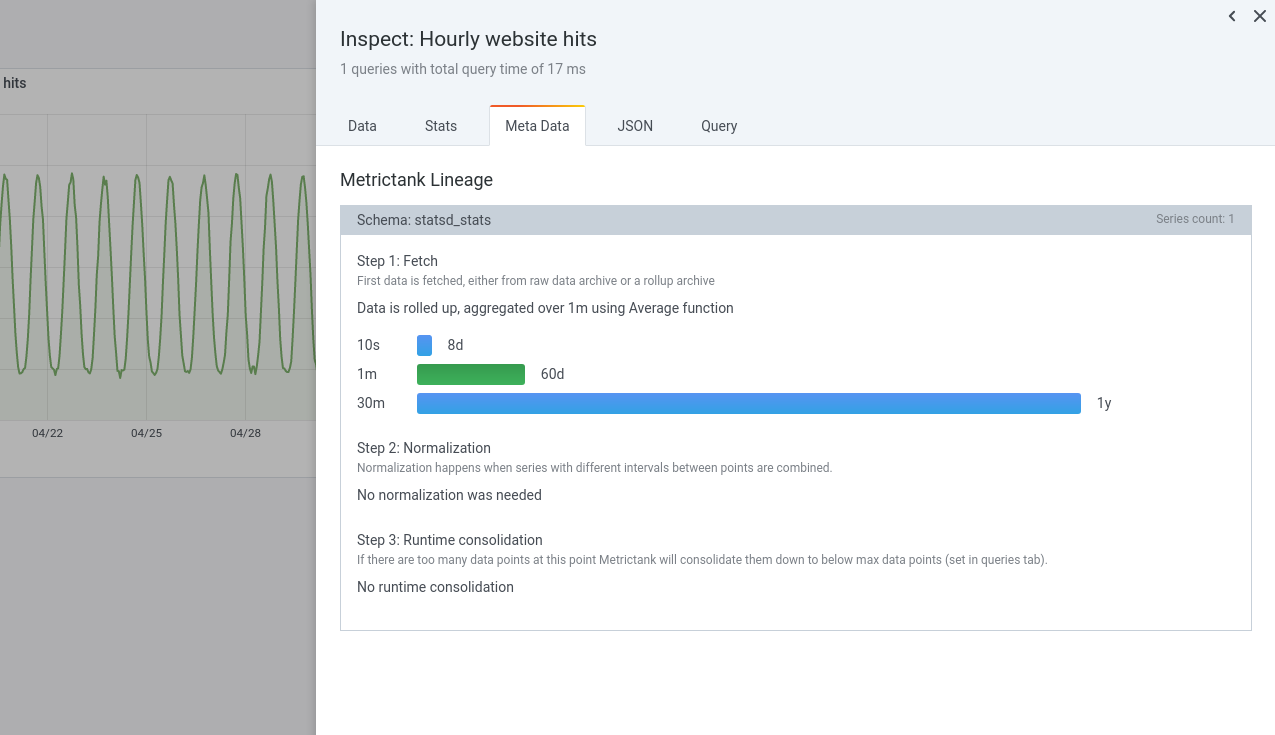
Let’s go to the metadata inspector to see more details. Click any of the options under “inspect,” then go to the “Meta Data” tab.


This gives us a lot of information:
The series has raw resolution up to 8 days, minutely rollups for 60 days, and 30-minutely rollups for 1 year.
The archive read from is in green: It is using the minutely rollup, and the data is averaged.
Therein lies the problem: We want data summed over an hour.
The minutely points we use are averages of the original 10-second values, which would be around 4000. The hourly summaries would thus sum 60 times 4000 (240,000) – much too low!
Instead our minutely points should be the sums of the original 10-second values. They should have values around 4000*6=24.000 such that 60 of them results in our expected 1.44 million number.
No worries, we just add a consolidateBy(...,"sum") function around the data being fetched, to change which rollup we read (or normalization we perform, if any).

Now our chart looks the way it should.

Similarly, if you discover that the runtime consolidation method used is not the desired one, you can wrap your function calls with an outer consolidateBy method. E.g., here we request sums for rollup reading and normalization (if applicable), but after the summaries have been generated, if they don’t all fit on the amount of available pixels, we ask for the max (hourly) values.

Notes and caveats
While Metrictank supports enabling multiple rollup methods per metric (per pattern in storage-aggregation.conf) and selecting one via
consolidateBy(), Graphite uses one method per metric (pattern in storage-aggregation.conf) and only usesconsolidateBy()for choosing runtime consolidation and a normalizer.In contrast, both Metrictank and Graphite support a variety of runtime consolidation methods because they are computed at runtime: avg, sum, min, max, first, last, count, stddev, median, etc.
Many cases of needing to override the used consolidator can be addressed by tweaking storage-aggregation.conf: It may be simpler to change the (primary) rollups used in the configuration rather than adding
consolidateBy()calls to many queries.Metrictank deployments (including Grafana Cloud) still require a Graphite-web installation. We are making progress toward handling all processing natively in Metrictank, but we see that typically between 1 and 10% of requests (depending on your queries used) still require Graphite to handle functions we haven’t ported yet. (Note: this switching happens seamlessly in the background.) (Track our progress here.) For such queries, the rollup and normalizer used are always the primary ones configured in storage-aggregation.conf.
Check it out
To use this feature, you need:
Grafana 7.0 beta or build from master. (Download 7.0 beta here. The 7.0 stable release is coming later this month and will be made available on GrafanaCloud when it is released)
Metrictank version 0.13.1 or later (or sign up for GrafanaCloud with Graphite backend).
Configure the datasource:
Have a Graphite datasource and set it to type “Metrictank.”
Enable the “Rollup indicator” option if desired.

Grafana 7.0 release during GrafanaCONline
We’ll have more big announcements on our way to the release of Grafana v7.0 during GrafanaCONline May 13-29. Register now for updates and information about how to tune in. Don’t miss my session on Metrictank on May 28; I’ll be doing a demo of this new feature, and present a few others as well!


