Loki quick tip: How to use a Loki datasource in your Grafana dashboard
In Grafana, Loki isn’t just for log visualization anymore. Now there’s a simple way to use a Loki datasource as a metric datasource in your graphs.
This used to require a hack to make it work – adding Loki as a Prometheus datasource – and the process was very tedious. But Grafana v6.6 integrates Loki even better than before. As a result, right out of the box you can create very nice dashboards about your logs, and mix them with your dashboards about metrics.
Why use Loki as a metric datasource at all? For one thing, it’s great for when your application is not instrumented with metrics. Usually metric instrumentation requires you to change the code and you may not always have access to that, so you can just use your logs to start building dashboards.
Before you begin, you need to get your data into Loki. This video explains how:
How to use a Loki datasource as a metric datasource
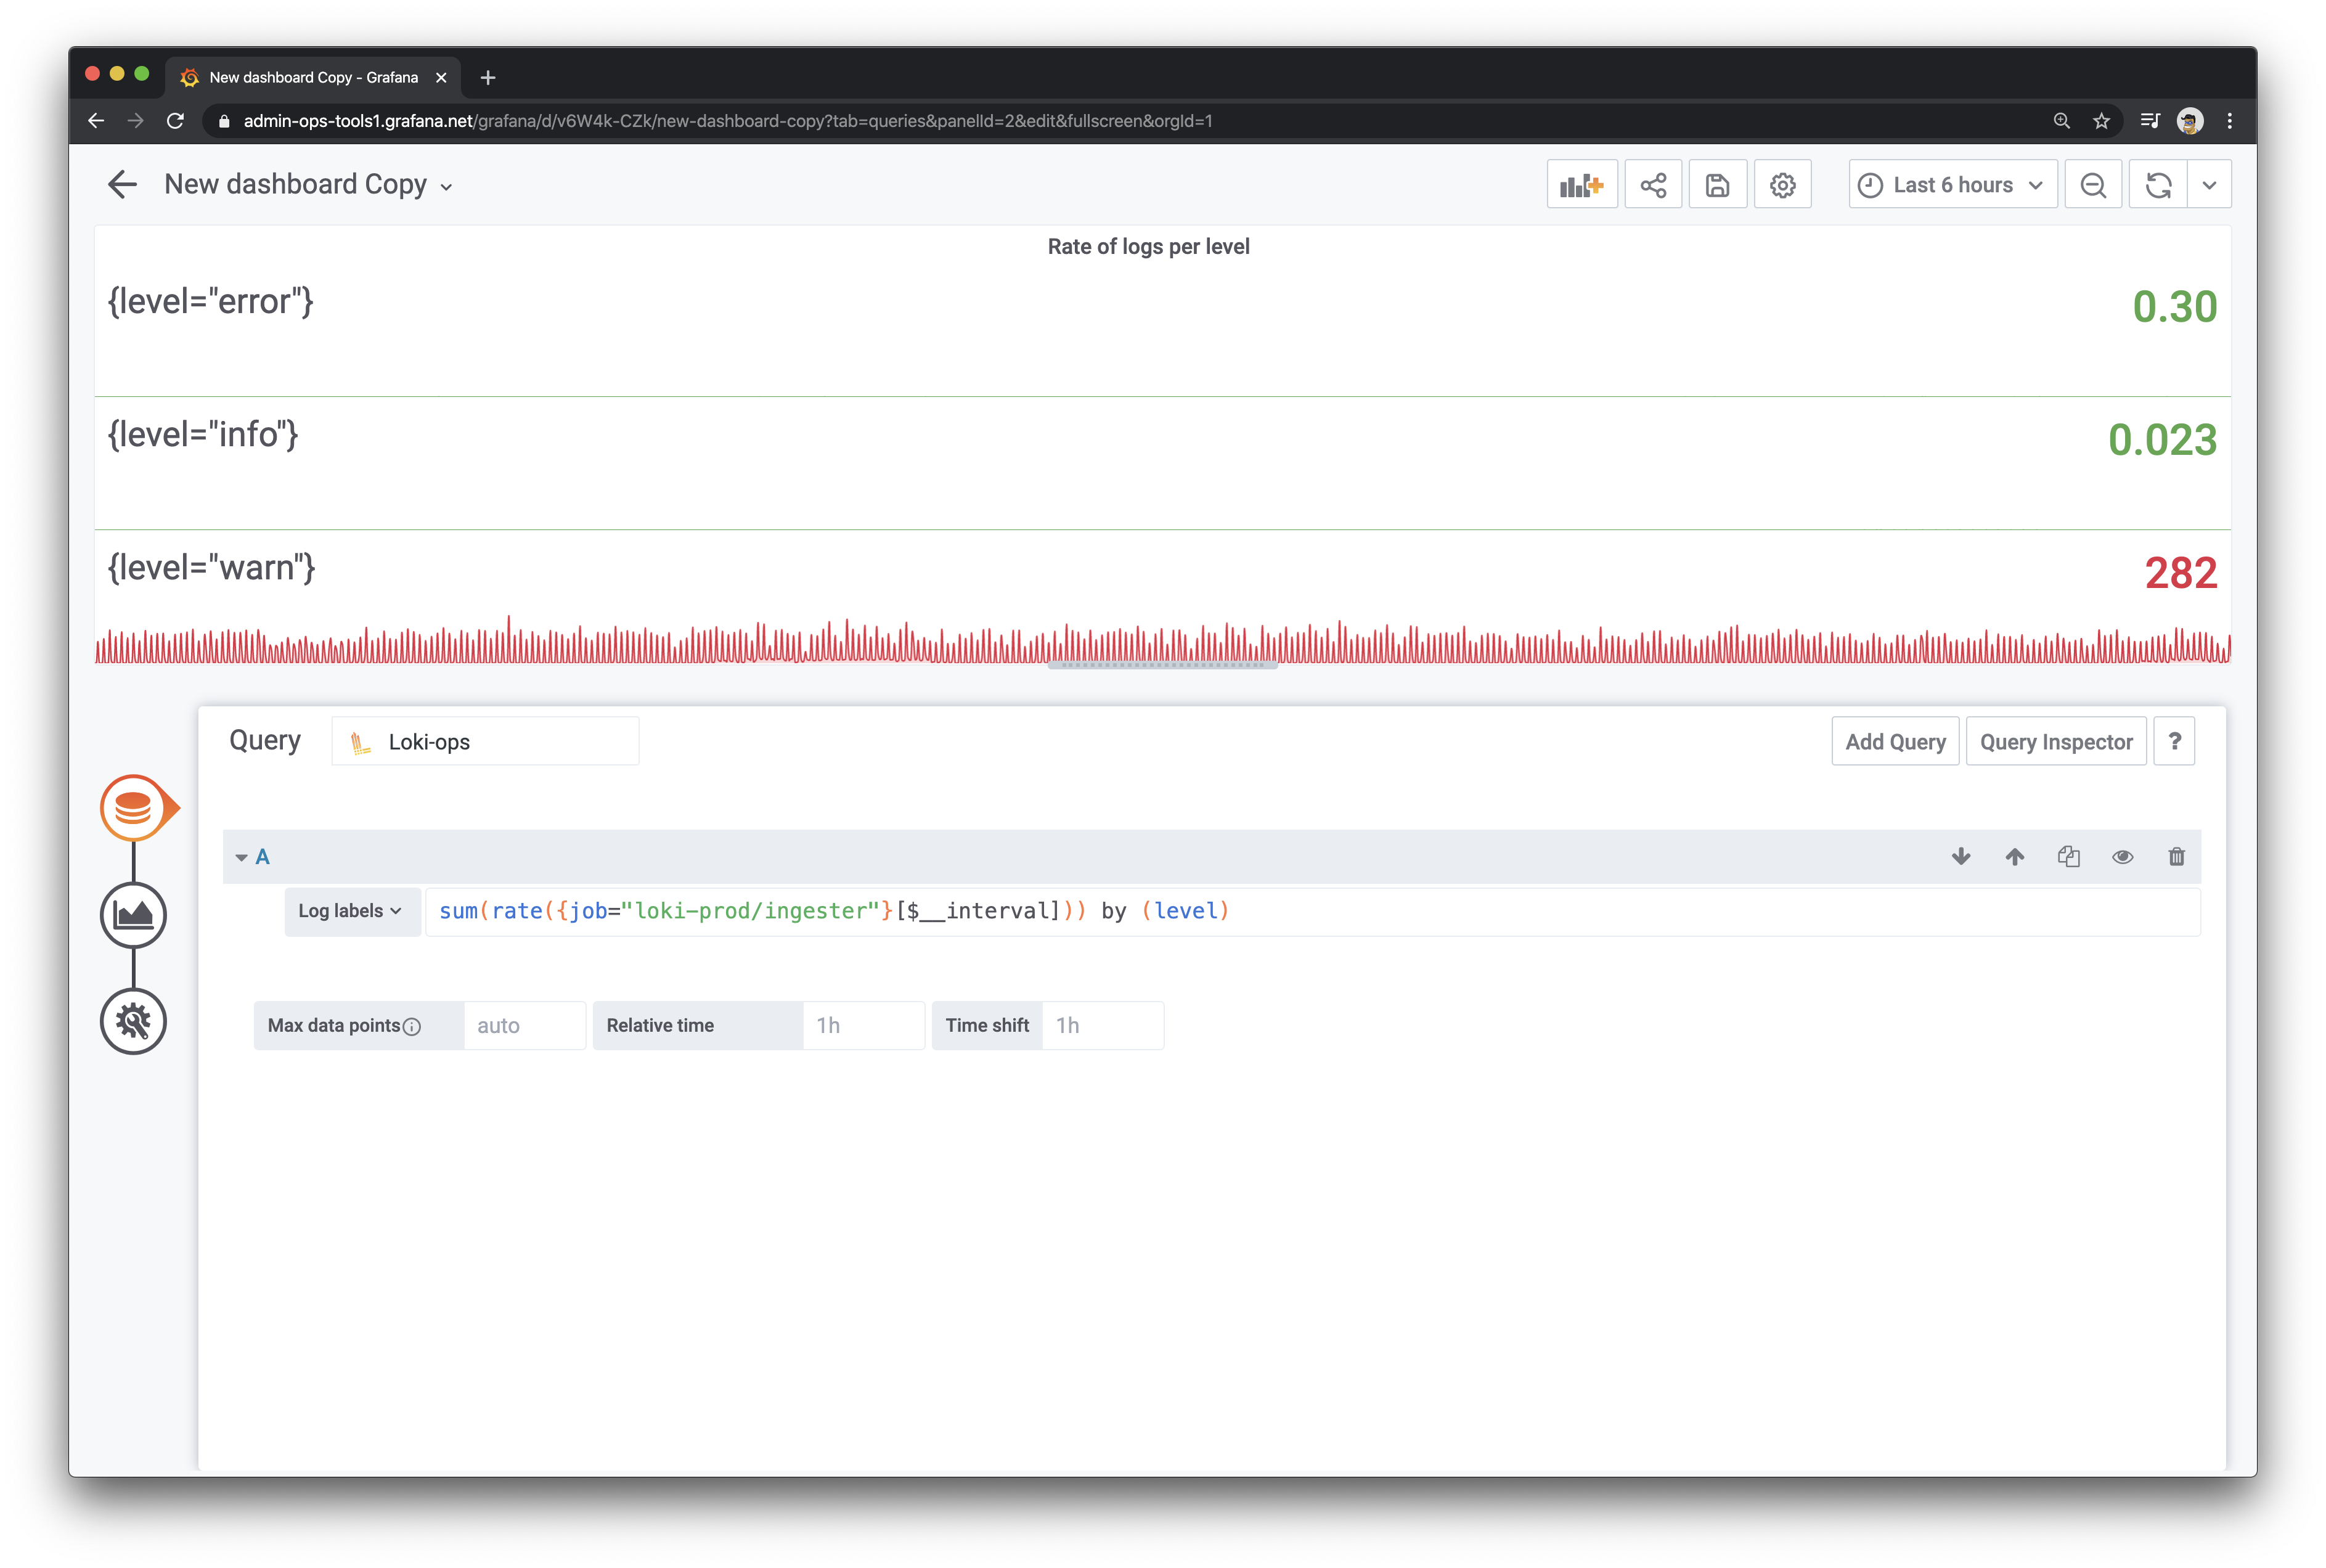
Step 1: Choose a visualization. Graph, Gauge, Bar Gauge, and Stat all work for this (Single Stat does not).
Step 2: Choose a query. Before, the only possibility was a Prometheus datasource using Loki, but now you can simply select a Loki datasource.
Step 3: Write your metric query. Find a guide to LogQL metric queries here. For the interval, you can choose one that is fixed or the $__interval Grafana variable. (This has the advantage of using the same range and step.)

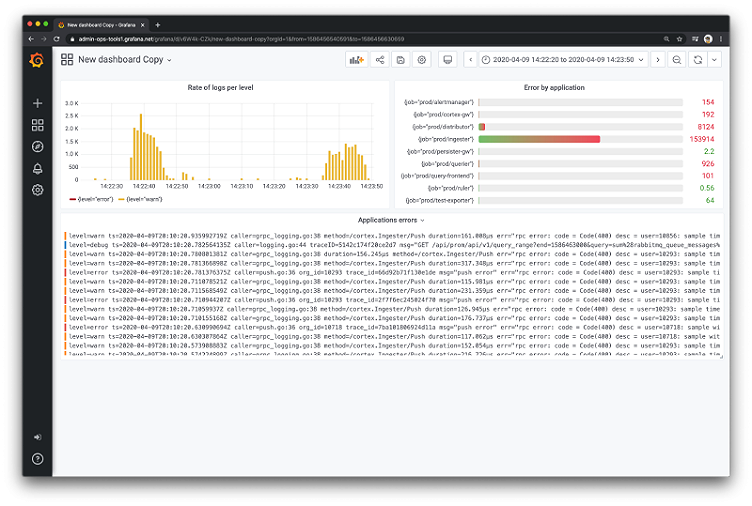
And what you’re able to create is something like this:
The top two graphs were created using Loki as a metric datasource, and the bottom is a typical Loki Log Panel.
And that’s it! You have an application dashboard made only with logs.
Want to learn more about Loki?
Sign up for our Intro to Loki webinar scheduled for April 22 at 9:30am PT/16:30 UTC. The agenda includes an overview of how Loki works, basic configs and setup to run Loki and test it out, how to use Loki from Grafana, an introduction to querying, and a Q&A with me and my fellow Loki team member Ed Welch.
