

Loki quick tip: How to create a Grafana dashboard for searching logs using Loki and Prometheus
Greetings! This is Eldin and Ronald reporting in from the Solutions Engineering team at Grafana Labs. You’ve probably seen some previous posts from our colleagues Christine and Aengus or maybe some of the fantastic Loki videos that Ward has put up on YouTube. This week, Ronald and I will walk through how to leverage Prometheus and Loki as data sources to create a simple but awesome Grafana dashboard that enables quick searches of logs.
We both love Loki! It’s modeled after the lessons learned in deploying and managing Cortex at scale, so it’s naturally highly available and horizontally scalable. In addition, it reuses a very similar query language as Prometheus, enabling you to work with logs and Prometheus metrics with the same variables and queries. That last part can be a real lifesaver when you’re trying to figure out where to look for the root cause of an incident when you’re paged at 3 o’clock in the morning!
Loki packs an amazing amount of search power into a tiny space. But not everyone knows LogQL, and sometimes you want a quick way of accessing log data with as little thought as possible.
Why we built the dashboard
Before we dig into how we built this dashboard, let’s talk a bit about the history behind it.
During GrafanaCon L.A. last year, we announced Grafana 6.0. One of the top features in this release was a feature called Explore. It’s great for ad-hoc queries, testing, troubleshooting, and general poking and prodding when you’re hunting for something but don’t quite know how to find it yet.
One of our customers asked us how they could have a dashboard with a simple search for labels already pre-set to help some teams quickly find what they are looking for while troubleshooting. While Explore is perfect for this use case, it can also be a bit daunting for a first-time user, or someone receiving a page in the middle of the night.
So we wondered: Could we leverage the new logs panel with some template variables?
After a few attempts… yes we can!
Step-by-step instructions
Let’s break down this dashboard and walk through how we created it.
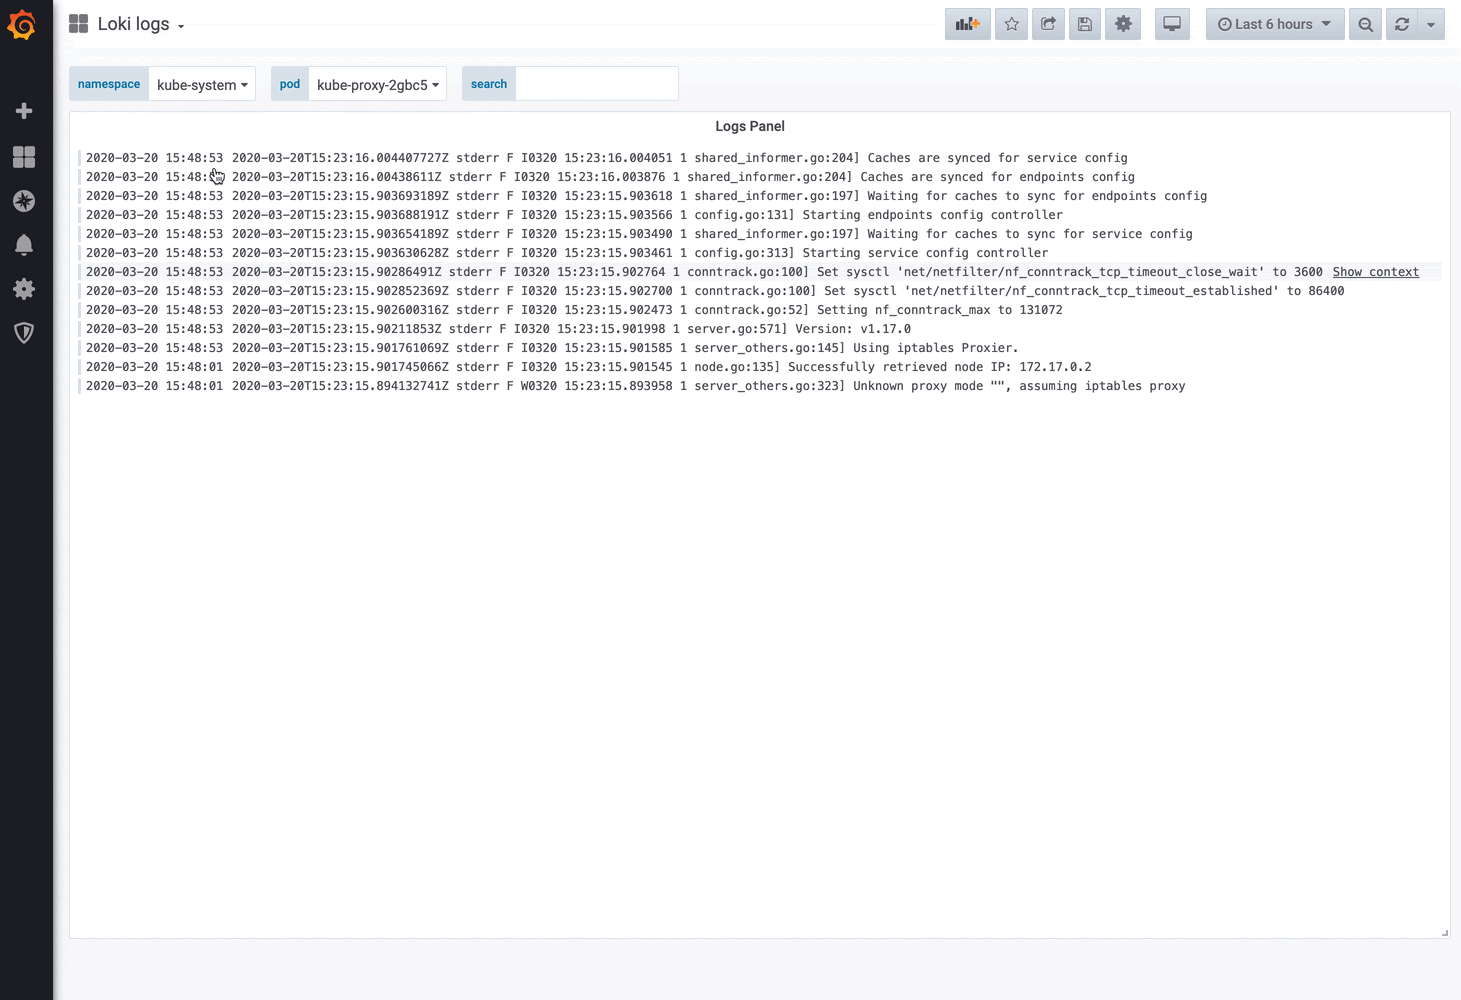
First you’ll notice a single panel and a few template variables. The magic here is the last template variable called “text box.” This lets us select a specific subset of the logs to search (based on Prometheus metric labels) and then provides an easy way to run a search against the logs (via Loki).
To build this, first we need to string together a few Prometheus variables:
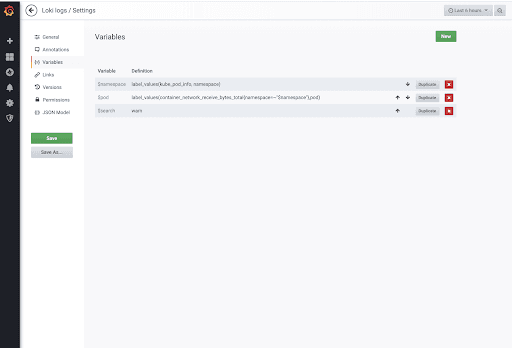
We have a total of three variables being used.
The first variable is $namespace which contains: label_values(kube_pod_info, namespace). This will be used to select the cluster to search.
The following is $pod, which contains: label_values(container_network_receive_bytes_total{namespace=~"$namespace"},pod). This will select the actual pod and narrows the log search space. (Note that we’re using container_network_receive_bytes_total as a metric name to find the available pods, but you can use any metric that will represent all the pods in your environment.)
And the last one is a text box type named search. As you might have guessed, this will be used to actually perform the search.
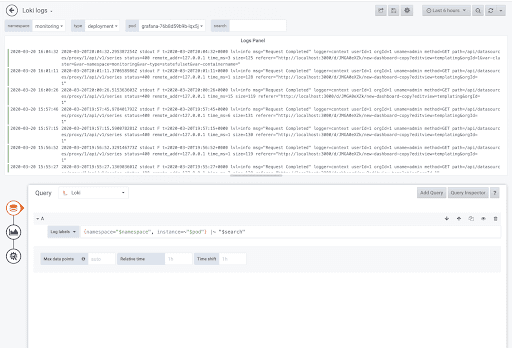
Phew! So now that we have strung together a few variables, let’s add the logs panel and use {namespace="$namespace", instance=~"$pod"} |~ "$search" as the query to the Loki data source.
All this together gives a nice and simple interface for searching logs — and your users don’t even have to write a single LogQL query!
Here is the dashboard json if you’d like to check it out.
Lastly, a little easter egg! The Loki team made some further enhancements for this use case, which were included in the recently released Loki v1.4.0. Be sure to upgrade!
That’s all we have for today, but please tweet at us to let us know what you’d like us to write about! Until next time, happy dashboarding!
Want to learn more about Loki?
Sign up for our Intro to Loki webinar scheduled for April 22 at 9:30am PT/16:30 UTC. The agenda includes an overview of how Loki works, basic configs and setup to run Loki and test it out, how to use Loki from Grafana, an introduction to querying, and a Q&A with Loki team members Ed Welch and Cyril Tovena.

