How to pull Oracle data and stats directly into Grafana dashboards with the Oracle Enterprise plugin
This post has been updated to reflect changes in the availability of the Oracle data source for Grafana Cloud users.
Greetings! This is Eldin Nikocevic reporting from the Solutions Engineering team at Grafana Labs. In previous posts, you might have read about Grafana’s Splunk or ServiceNow plugins. In this week’s post, I am introducing Aengus Rooney, who will be covering our Oracle Enterprise data source. — Eldin
Grafana’s plugins are a quick and simple way to extend Grafana’s dashboard plugins and data sources. Leveraging the GoLang oci8 library, the Oracle data source plugin allows you to pull Oracle data and stats directly into Grafana dashboards — without having to extract and load the data to “yet another data warehouse” — which means you can visualize the data either in isolation (one database) or blend the data with other data sources (e.g., other Oracle databases, other database technologies, MSSQL, MySQL, Maria, Postgres, RDS, etc.). This enables you to discover and visualize correlations and covariances in your data in minutes.
As someone who has worked with many databases in my past, I found that the ease of use, extensibility, and the ability to mix queries across databases in real time make this plugin a highly powerful tool to have in your analytics and visualization toolkit.
What you can visualize with the Oracle plugin
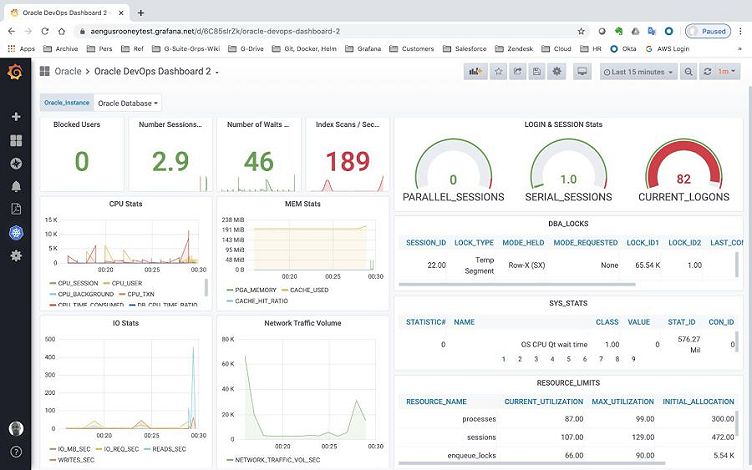
Alongside visualizing business data, we can also visualize system data in a number of ways. First, we can query the Oracle system tables to visualize system health, logins and sessions, blocked users, CPU, memory and IO all in one place and create a DevOps dashboard similar to the following example:
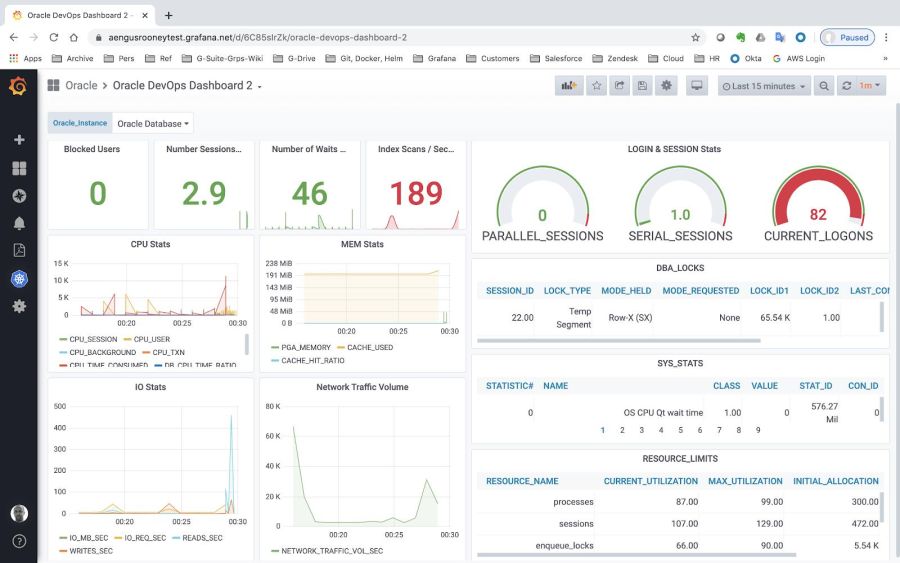
Remember: If you are running multiple Oracle instances, you don’t need multiple dashboards. You can easily switch between instances by dropping down the Oracle_Instance variable list and selecting the instance you wish to monitor. Alternatively, you can run one dashboard and aggregate any metric across all of your instances in one panel!
We can also export OS-level data using the Oracle DB Prometheus Exporter, which provides statistics on database utilization, e.g., database up/down, user activity, resource utilization, tablespace capacity utilization, session activity, and process counts.
Bringing the two types of data together (system data and business data) provides a powerful example of a mixed DevOps dashboard. For example, in the dashboard below, we are leveraging an HR sample schema along with the Oracle Database self-generated system time series using the Oracle DB Prometheus Exporter. Developers can now check the impact of their queries and applications on the database without having to raise a request for the DBA team to provide this information!
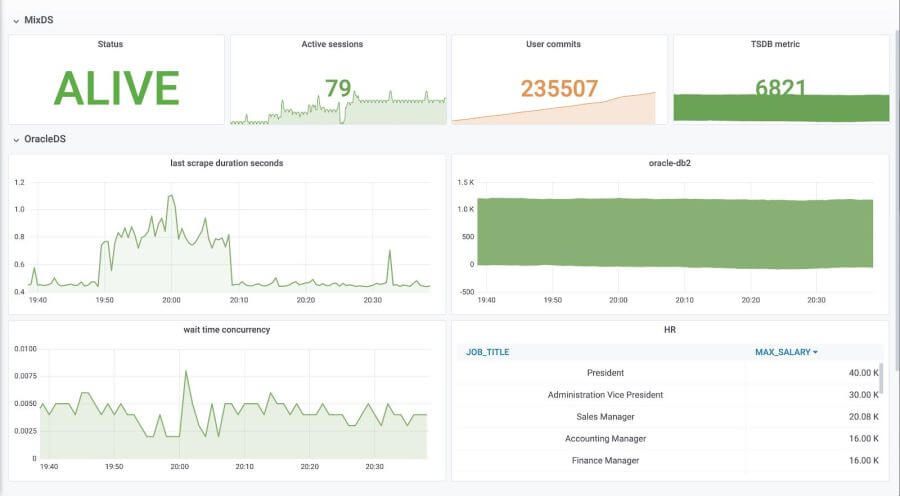
With this quick view, we are getting the status, active sessions, user commits, wait time, and business table data out of the database. Furthermore, each “quick view” panel can link to additional panels with more detailed data.
Configuring the Oracle plugin
So, how do you get this all up and running? Once you have the datasource installed on your Grafana server, we need to add it to your Grafana data sources in the Configuration section via Configuration => Datasources => Add. Find the Oracle data source and complete the connection details:
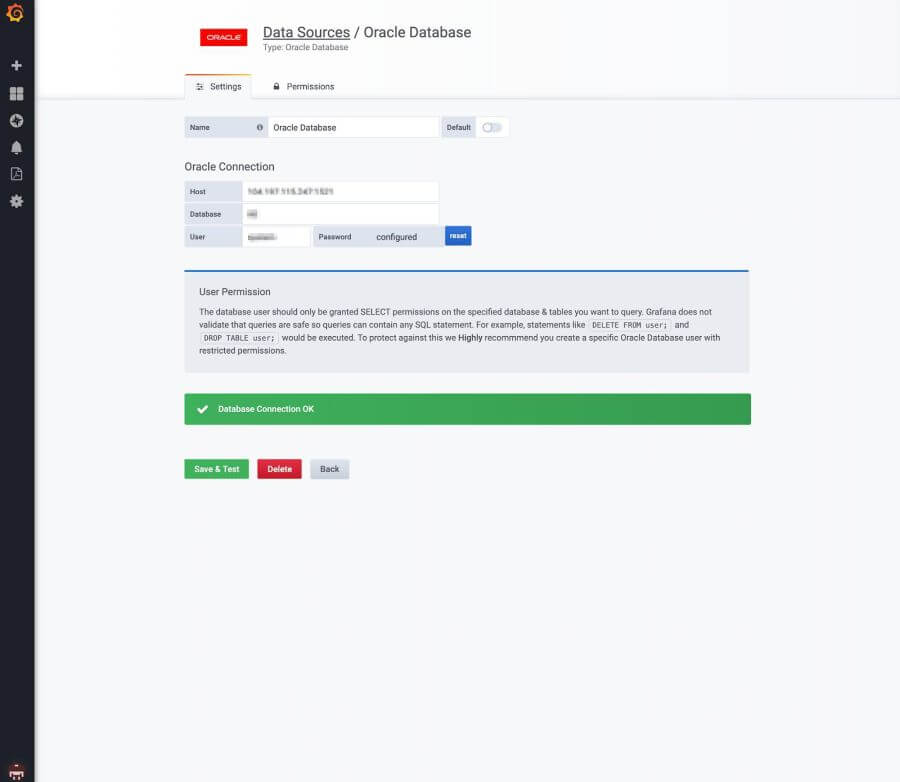
(Note: Installing the datasource has some dependencies such as the Oracle Instant Client.)
Once the data source has been installed, you can start adding new dashboards with Oracle Database as the query source and use the SQL query editor to write your queries. You have two options in the editor for the type of data you wish to query and display: relational table data (for table data visualization) or time series data (for graph visualizations).

The query editor also has a useful SQL statement auto-complete:

Now, let’s play with some queries to test the plugin. On our plugins page, we offer some macros that can be leveraged to simplify syntax and to allow for dynamic parts like date range filters.

Setting up database alerts
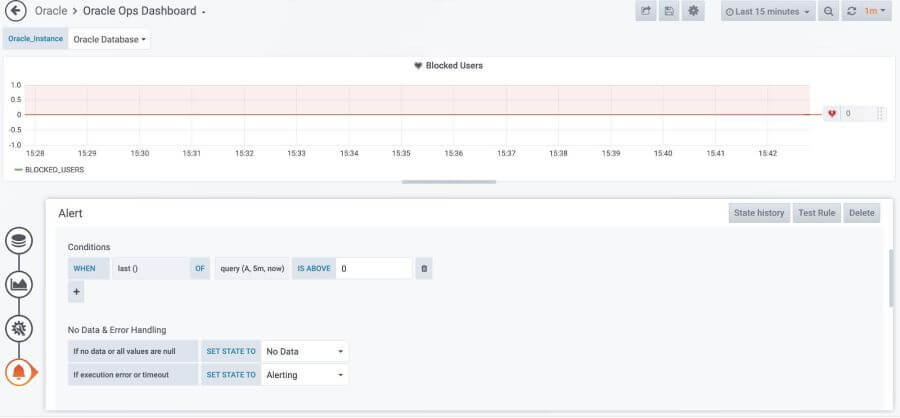
With the Oracle data source and a graph panel, you can set an alert in Grafana. You can set a threshold as shown in the example below or drag the slider to set an alert based on the data. Read more about unified alerting in Grafana and check out our documentation!

For example, alerting on Blocked Users or Sessions is a very useful feature to have and setting this up takes seconds! In the panel alert view, set the blocked users count to be above zero and set the notification you wish to send any time the rule is triggered — done!
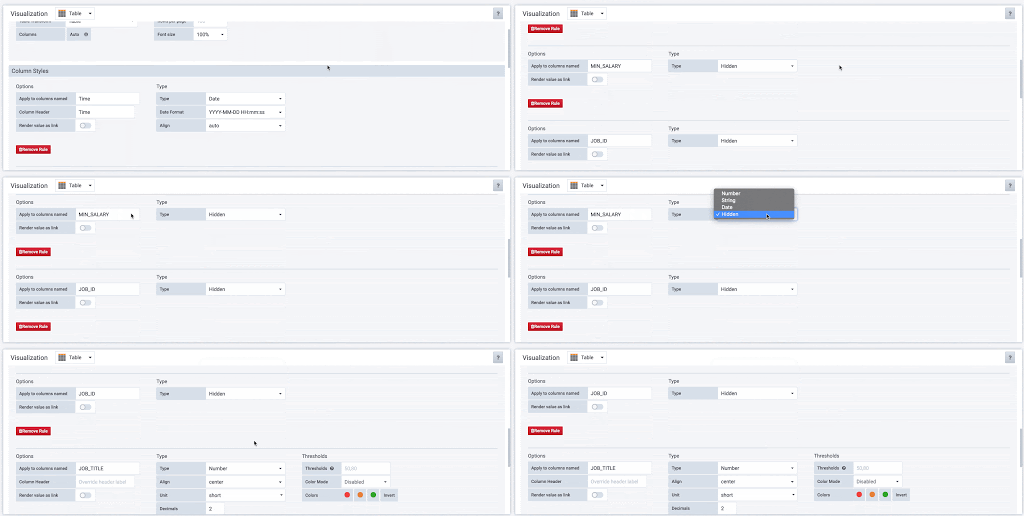
One final tip: When working with tables, my go-to is hiding columns that are not relevant:

Here is the output of all the columns, and here it is with a little bit of cleanup:
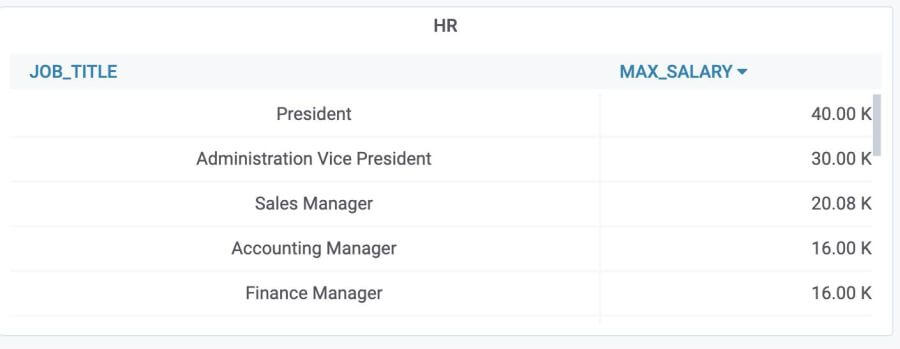
Visit the Options section and add a few rules to the columns for which you would like to hide:
Learn more
Well, that’s all we have time for today. The Oracle plugin is available for users with a Grafana Cloud account or with a Grafana Enterprise license. For more information or to get started, check out the Oracle solutions page or contact our team.
Also please find us on Twitter to let us know the next plugin you’d like to hear about. Happy dashboarding and until next time!
If you’re not already using Grafana Cloud — the easiest way to get started with observability — sign up now for a free 14-day trial of Grafana Cloud Pro, with unlimited metrics, logs, traces, and users, long-term retention, and access to one Enterprise plugin.

