
Everything you need to know about the Splunk plugin for Grafana
This post has been updated to reflect changes in the availability of the Splunk data source plugin for Grafana Cloud users.
Last week on Slack:
Eldin: Hey Christine, do you remember the first time you viewed a log file?
Christine: Oh yes. I used Splunk as a support engineer and I remember. You?
Eldin: I believe it was early 2000s. I was installing Slackware and a few network cards for a DIY router, and logs were critical.
Hello again! We are Eldin and Christine from Solutions Engineering — a team at Grafana Labs that is passionate about connecting people to our products — reporting back for duty. Due to the overwhelming response and engagement from our blog post on the ServiceNow data source plugin, we’ve decided to join forces again to showcase another one of our favorite Enterprise plugins: Splunk!
Why Splunk is special
Regardless of where you are in the stack, logs are ubiquitous and provide invaluable insights for troubleshooting and broader business analyses. Splunk is a leading log management solution that’s been highly adopted throughout different organizations, and we hear everyone loud and clear on why: It’s really good at what it does. (We think so, too.)
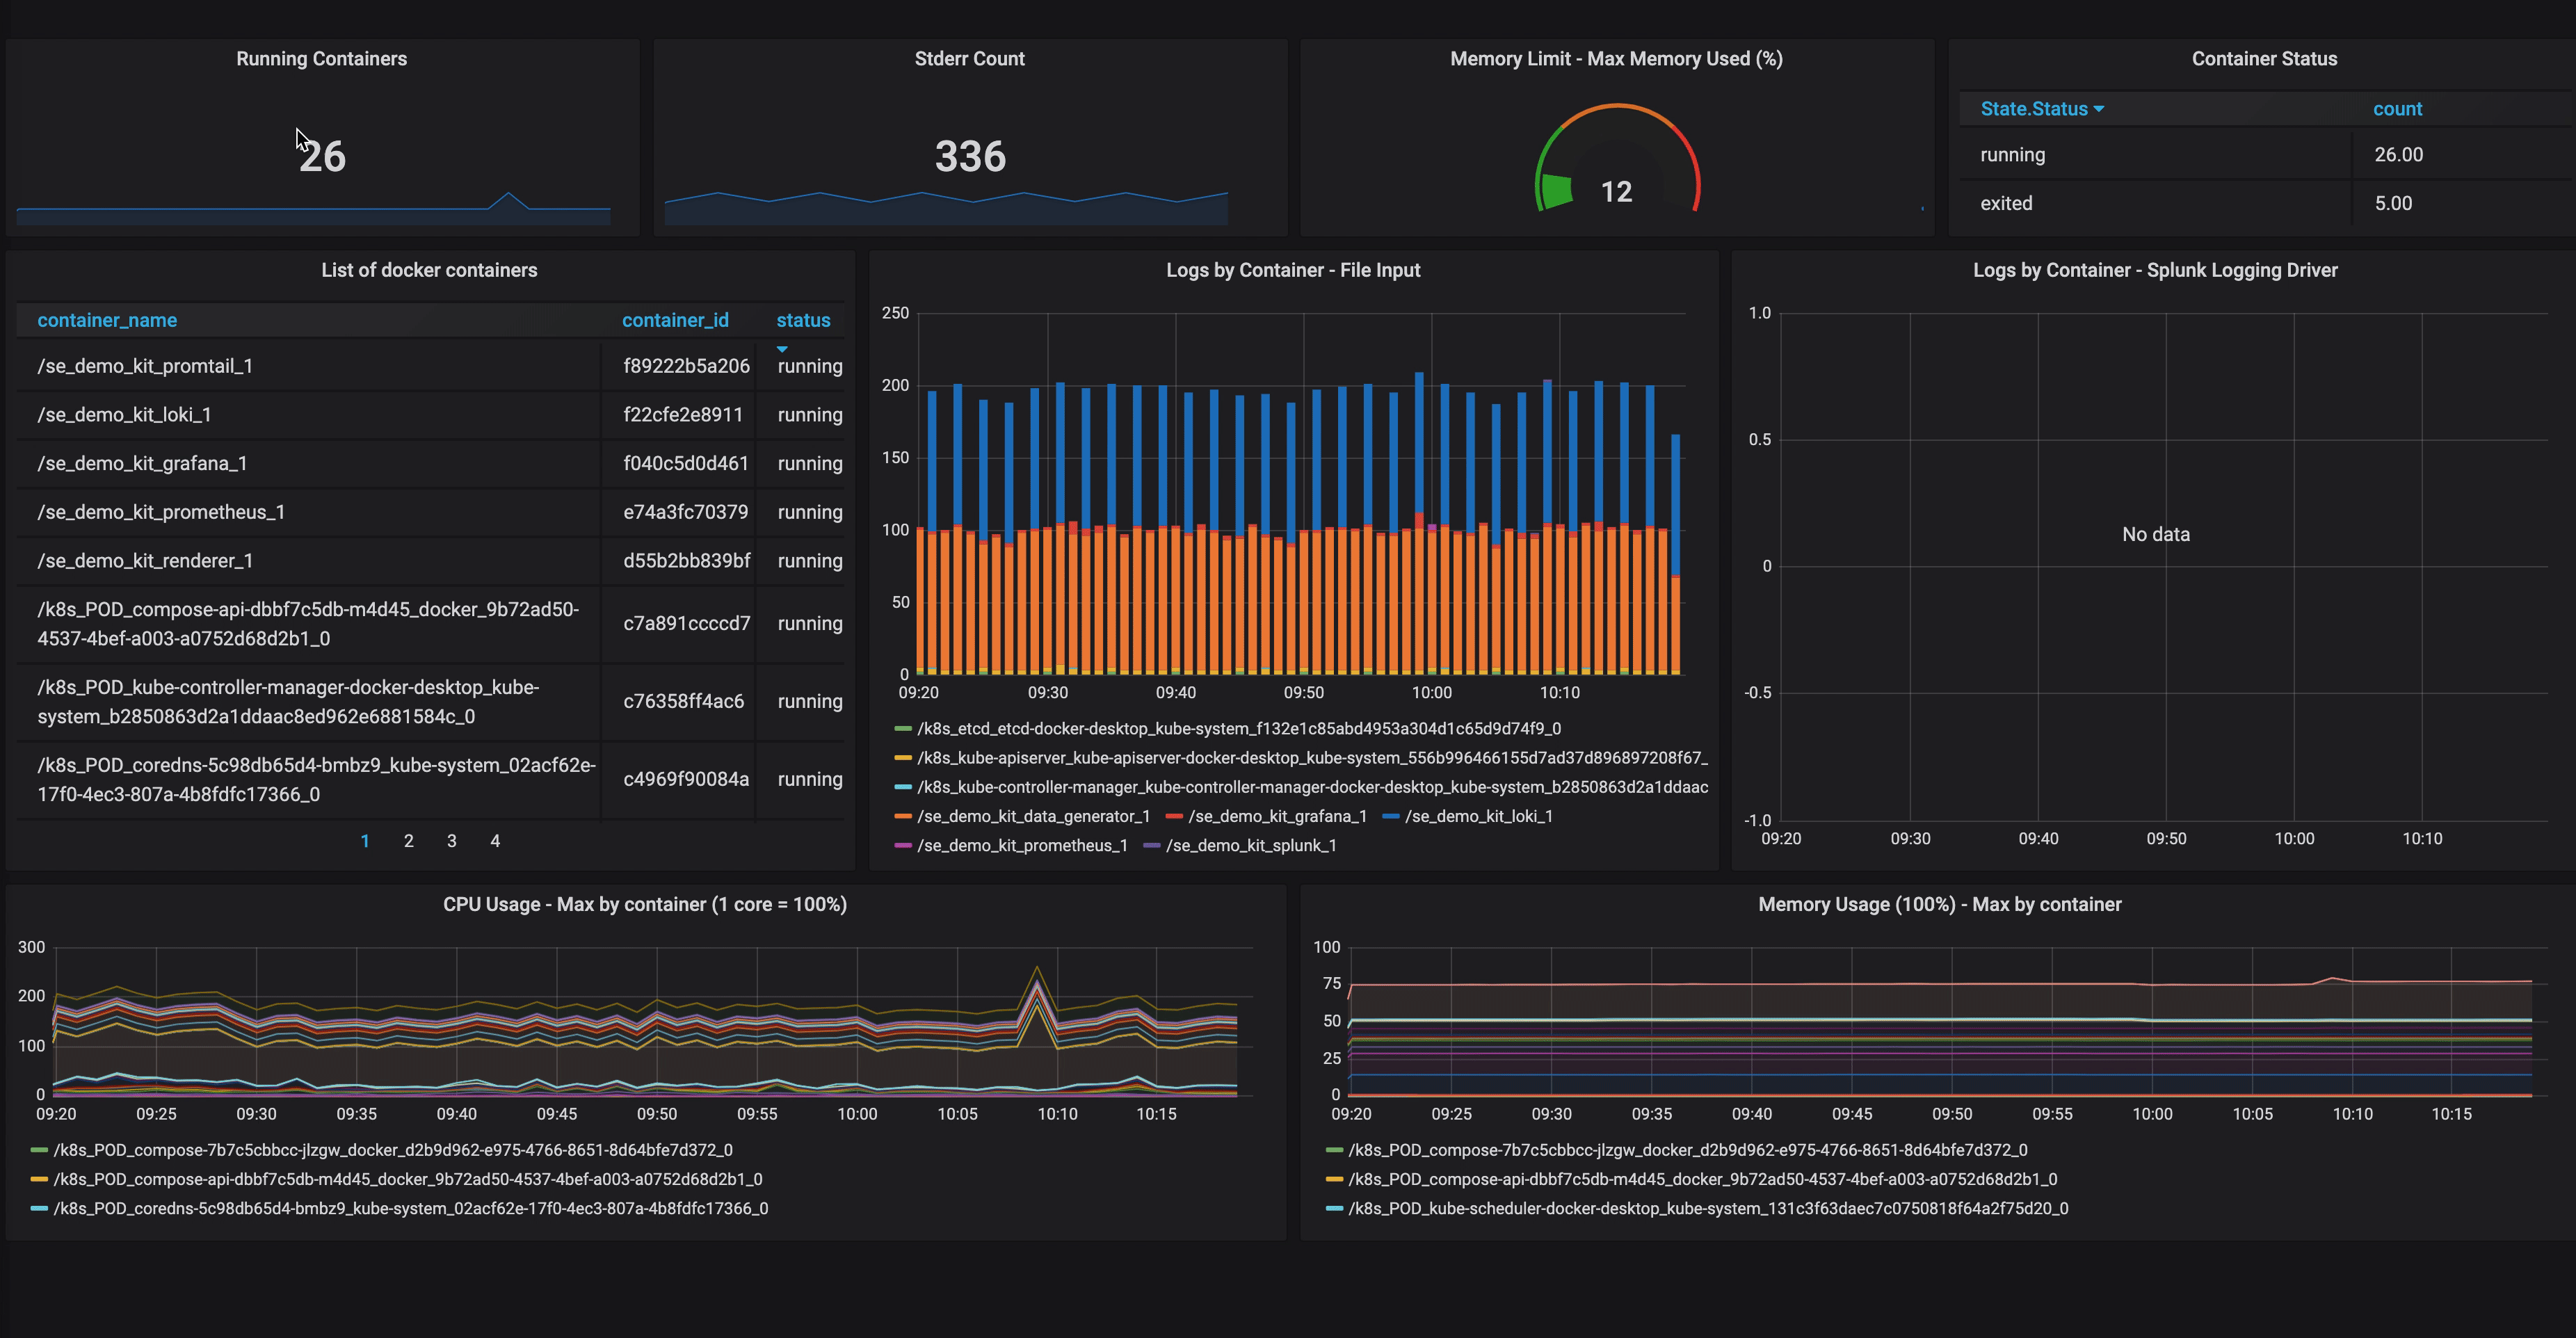
With our Splunk plugin, you can leverage everything you love about Splunk (collection, storage, and indexing of logs, oh my!) without compromising on where you choose to centrally visualize all of your data sources (with Grafana, we hope). The outcome? A flexible, single-pane view of the underlying metrics that measure the health of your systems, which allows you to quickly correlate and debug for reduced MTTR.
For example:

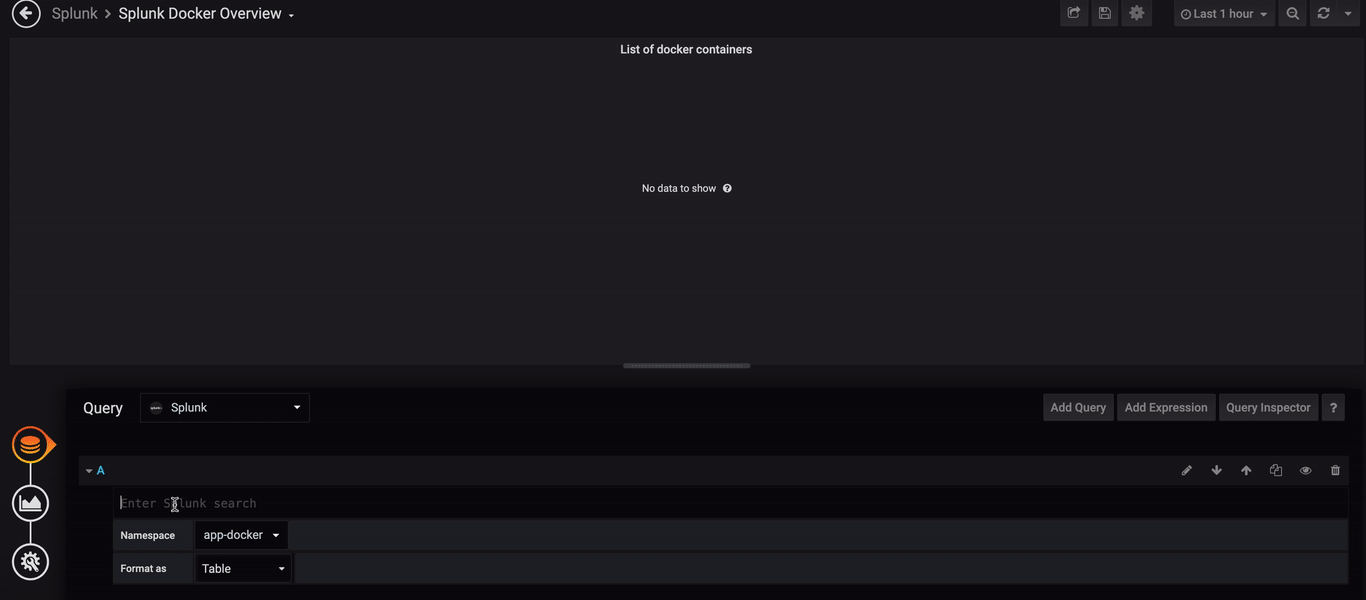
It’s simple to set up: Once you’ve installed the Splunk plugin, configure Splunk as a data source by going to Configuration > Data Sources > Add data source. Add your authentication details, and the data source is ready to query!
Our query editor supports two modes: raw and visual. Raw mode allows you to write queries in Splunk’s Search Processing Language. If you’d like to quickly find some data with dropdown menus, click on the pencil icon to use the visual mode.
Some quick tips
- When configuring the data source, toggle on the Advanced options section to take advantage of Splunk-specific functionality, such as search performance optimizations (Fast, Verbose, and Smart) and streaming.
- Click on the Permissions tab to enable data source permissions, an Enterprise feature that allows you to control who can query the data source.
- Want to visualize Splunk data in more than just metric and table format? Use the Logs panel to view log lines next to a graph panel of a related process.

- Don’t forget to use Splunk in the Explore panel! With the split panel option, you’ll be able to test out your queries, investigate your logs, and compare two data sources side-by-side.
- If you need some help with your SPL query, take advantage of autocomplete support.
For more helpful information about the Splunk plugin, which is available for customers with a Grafana Cloud account or with a Grafana Enterprise license, check out the Splunk solutions page or contact our team.
Conclusion
Remember, logs are just one piece of the observability equation. The more you can correlate logs with metrics and incorporate data and panel links to your dashboards, the faster your team can respond to an incident, discover the root cause, get better, and move on.
If you’re not using Splunk, or want an alternative logging solution so you can still debug like a champion, give Grafana Loki a spin — it’s Grafana’s open source answer for a cost-effective and horizontally-scalable logs aggregator that you can start running right away.

Well, that’s all we have time for today, but please find us on Twitter to share your feedback on the Splunk plugin and your success stories. Until next time!
If you’re not already using Grafana Cloud — the easiest way to get started with observability — sign up now for a free 14-day trial of Grafana Cloud Pro, with unlimited metrics, logs, traces, and users, long-term retention, and access to one Enterprise plugin.

