How Grafana Enterprise Helped 84.51° Centralize Its Metrics and Tell a Holistic Story
84.51°, the data analytics and marketing company owned by The Kroger Company, found out it needed centralized metrics the hard way.
When Erin O’Brien was brought into the company in the spring of 2019 as a Lead Service Manager, she was tasked with evaluating and seeking ways to continuously improve how the Technology and Product teams worked together. “We wanted the same things, but we didn’t really communicate the same way, and we went about doing it differently,” says O’Brien.
Case in point: The Technology side used the free version of Grafana for visualizing its monitoring with some simple dashboards. On the Product side, she says, “if I was trying to pull a common set of metrics, I went to one group and they had two different places for information. I went to the next group, and they had yet another set of sources for data.”
One day, the Product VP went to a meeting with fellow business leaders and reported that a product was all green with no problems, because the infrastructure team had reported that the infrastructure wasn’t down. “But guess what?” says O’Brien. “There was a problem on the application side that was not reported with the infrastructure data. We had a disconnect that wasn’t telling a holistic story.”
A Standardized Solution
Around the same time, Stratum – 84.51°’s breakthrough analytics solution – was set to launch, and management approached O’Brien’s team for help. “They wanted to know, once they launched, how they’d be able to look at usage, how long reports were taking, how many reports were running, how many users are logged in using metrics,” says Jacob Wilson, a product engineer. “So we went down the road building those dashboards, and we realized the value of having Grafana.”
The experience the Stratum team had with Grafana – combined with the usage on the infrastructure side – convinced O’Brien to come up with a broader solution that she took to her VP: “I said, ‘What if we combine and standardize product and infrastructure metrics across all products and display them in one place?’”
The pitch was simple: O’Brien says she asked her VP how long it usually took her to get the pieces of data that she needed for that monthly meeting. The answer was days and days.
“Something like this has been needed for so long,” says O’Brien. “It was really easy for me to get the cost justification to go with Grafana Enterprise. This will enable us to pull the data we collect from various sources right into customized Grafana dashboards, giving the holistic story in a one-stop shop.”
After doing a demo for her VP, O’Brien got the green light. “She loved it,” O’Brien recalls. “She took it to our business leadership team and said, ‘Look at how great this is.’ I mean, she was really happy.”
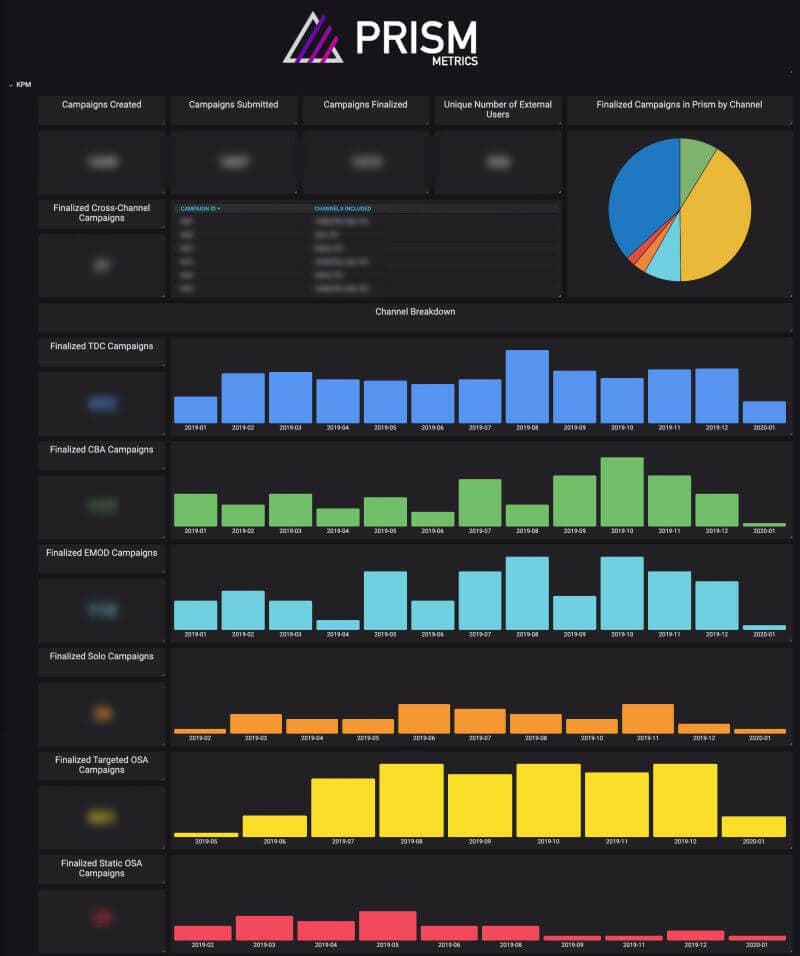
Wilson started working on setting up the backend and building dashboards, which were introduced to teams at the beginning of August. “It got a lot of traction,” Wilson says. “People saw that we were monitoring certain metrics and thought, ‘Well, we should probably do this too with our application.’ Managers and business leaders are also telling teams that it needs to be a priority to spend some time learning how they can use Grafana for their applications.”
The Results So Far
“It’s already proven to be fantastic,” says O’Brien. Using the Grafana dashboards has helped the 84.51° teams shift their thinking about metrics.
“This gave us a good opportunity to review the metrics we are capturing and adjust their relevance as the products mature. Seeing everything in one place really puts things in perspective and highlights both gaps and things we no longer need,” she says. “Now you are visually looking at all this data in a Grafana dashboard and can say, ‘Why do we need this number? What should we be looking at? What do we want these dashboards to tell us?’”

What’s Next
The Grafana Enterprise roadmap for 84.51° includes doing metrics workshops with the company’s major products to help push adoption, but also to find out from teams what they need to know from the data and then build the appropriate dashboards. The goal is to come up with a standard process for reporting metrics.
They’re also planning to standardize the company’s infrastructure monitoring tools and then combine the infrastructure metrics with product metrics in Grafana dashboards. And they’re looking forward to an integration with Service Now, which Grafana Labs just released as an Enterprise plugin.
“What’s neat about Grafana is that it’s not just one group who’s trying to do something with it,” says O’Brien. “We have multiple groups in the company that are doing totally different things but using the same product. And I think that’s the part that is so exciting and fun. Now it all comes together in one frontend.”
Grafana has led the company on the path toward a centralized metrics program with dashboards that erase the need for people to “manually spend multiple hours and days trying to pull data to tell a story,” says O’Brien. Instead, product owners – and others – can continually update in Grafana what metrics are needed to help business leaders make decisions. “It’s really hard to make decisions on things when you’ve got nothing,” says O’Brien. “We have so much data, but how do you take that data and tell the story? Grafana is our storyteller.”


