How Cortex Is Evolving to Ingest 1 Trillion Samples a Day
As the open-source monitoring system Prometheus grew, so did the need to grow its capacity in a way that is multi-tenant and horizontally-scalable, along with the ability to handle infinite amounts of long-term storage.
So in 2016, Julius Volz and Tom Wilkie (who is now at Grafana Labs) started Project Frankenstein, which was eventually renamed Cortex.
“It was a pretty simple system with most of the heavy lifting being done by AWS and your dollars,” Grafana Labs software engineer Goutham Veeramachaneni said at the Prometheus Berlin meetup in December.
As Cortex has evolved, so has its ability to ingest large volumes of samples — and the architecture can now support hundreds of billions of samples a day.
In this talk, Veeramachaneni — who is a maintainer on Cortex, Loki, and Prometheus — discussed the evolution of Cortex and how the bottlenecks have been eliminated in order to sustain infinite volumes with optimal speed and performance.
The Origins of Cortex
When Project Frankenstein began, it was trying to achieve three things: build Prometheus as a service (or have a hosted Prometheus where data could be sent), provide long-term retention with five years’ worth of data, and ensure better reliability guarantees.
At the time, Weaveworks wanted to build a hosted Prometheus for their platform so that all of its users had their metrics in the system and could access it forever. So the original design doc called for the ability to process 20 million samples a second without an upper limit, retention for at least 13 months and simplify operations using the cloud as much as possible without complex stateful services.
The idea was to have a Prometheus that could push data to the ingest service that would in turn send it to a storage service that would store the data long term in Dynamodb and S3. “This way, the only components that we needed to manage are just ingest, storage and query,” Veeramachaneni said. “And Querier could be stateless.”
The Need for Hashrings

But that meant that the storage service would be writing to a store directly. “If you’re ingesting 20 million samples a second, if you want to put every single sample into the database, you’re going to do 20 million QPS,” he explained. “I don’t know of a system that can sustain 20 million QPS without a gazillion dollars.”
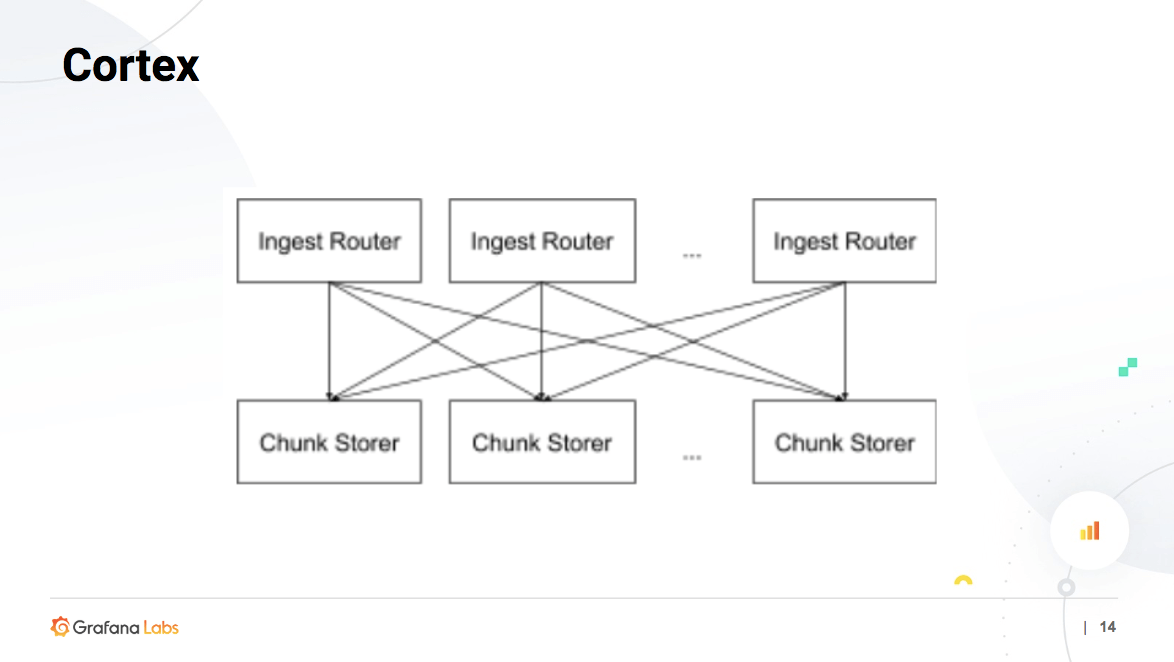
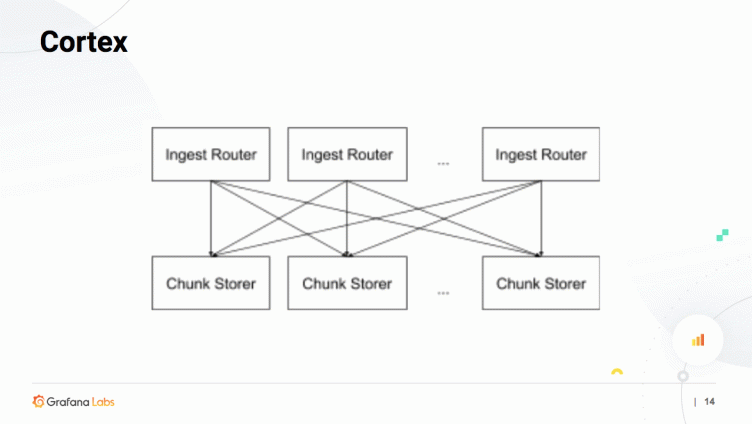
In order to cut down on the writes, the samples are compressed the same way Prometheus does, and an entire chunk of 1000s of compressed samples is persisted at once. But for that to happen, all the samples of the same series should end up at the same “chunk storer” so that the samples for the same series can be compressed together.

“When you get a sample, you hash it and then based on the hash, you figure out which node it belongs to,” Veeramachaneni said, giving the example of five nodes forming a ring where you distribute the nodes to a particular number, so it’s clear where each falls. “The fundamental thing is you get all your samples for the same series and they are sent to the same ingester.”
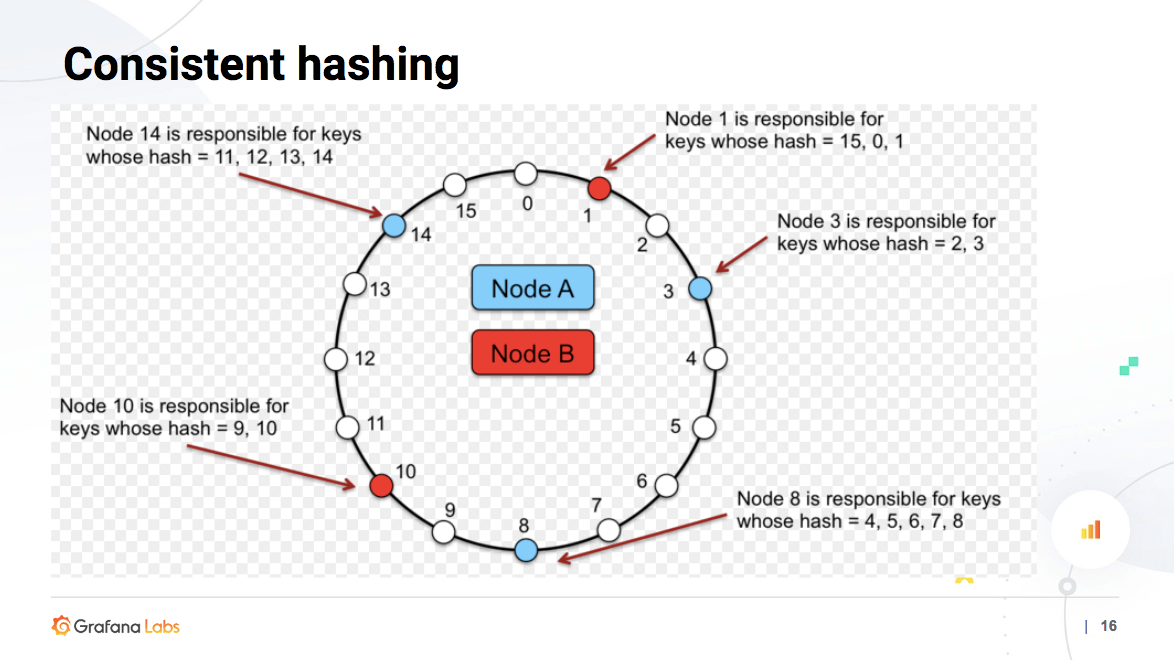
However, the problem that arises is that the volume of the compression being done in memory could cause one of the ingesters to restart. That would mean you just lost all the series data in that ingester.
To prevent that, each sample is replicated three times. Each sample is sent to three different ingesters — the same three all the time — and then the three chunks are flushed. “If the chunks have the same data, the Chunk ID will be the same, so that in the end, you only store one copy instead of three.”
Sorting through the Schemas
The original version of Cortex was built by Volz and Wilkie in about four months, so of course the hashrings weren’t the only thing that had to be implemented in practice. For instance, the original also had writes and reads on the same path, but when there were bad queries, it would drop data. So now they exist on completely different paths. It evolved continuously fixing bottlenecks in the architecture as it hit them.
The querier service now directly talks to storage, including the in-memory ingesters for recent data and chunk store DynamoDB+S3 for old data. In S3, the actual chunks are stored, whereas in DynamoDB, it’s in an index to find out which chunks to query and load.
When Veeramachaneni first joined the Grafana team in March 2018, there were eight different schemas. But it stood to reason: after all, new schema were constantly being built to take into account new learnings — and currently, there are 11 schemas. “The good thing is that you can always read from the old schema,” he said. “Weaveworks still has data that is three and a half years old that you can still read, so you never lose your data.”
While it’s all there, the question does arise: Why not move the old data into the newest schema for better performance? “It’s extremely rare to query data that’s more than a week old,” he said. “If you want it to be faster, just wait a week and all the new data will be in the new schema.”
When Veeramachaneni first joined the project, he was immediately met with challenges. “We started onboarding customers and everything broke,” he admitted. “It was extremely slow and the customers would say, my Prometheus is faster.”
It was the varying needs of different companies that exposed the issues. A company like Weaveworks has thousands of small customers whereas Grafana has a handful of large customers. In order to find a solution that worked across the board, Grafana changed schemas. The issue there: Every time you cut a chunk, you have a chunk ID. So the mapping went from the metric name to the list of chunk IDs for the metric name and also from the labels to the list of chunk IDs. With large volumes, of millions of series with the same metric_name, therefore millions of chunkIDs in the same row, Bigtable (one of the backends that Cortex supports and Grafana Labs uses) refused to query at all — and in fact, wouldn’t even store it.
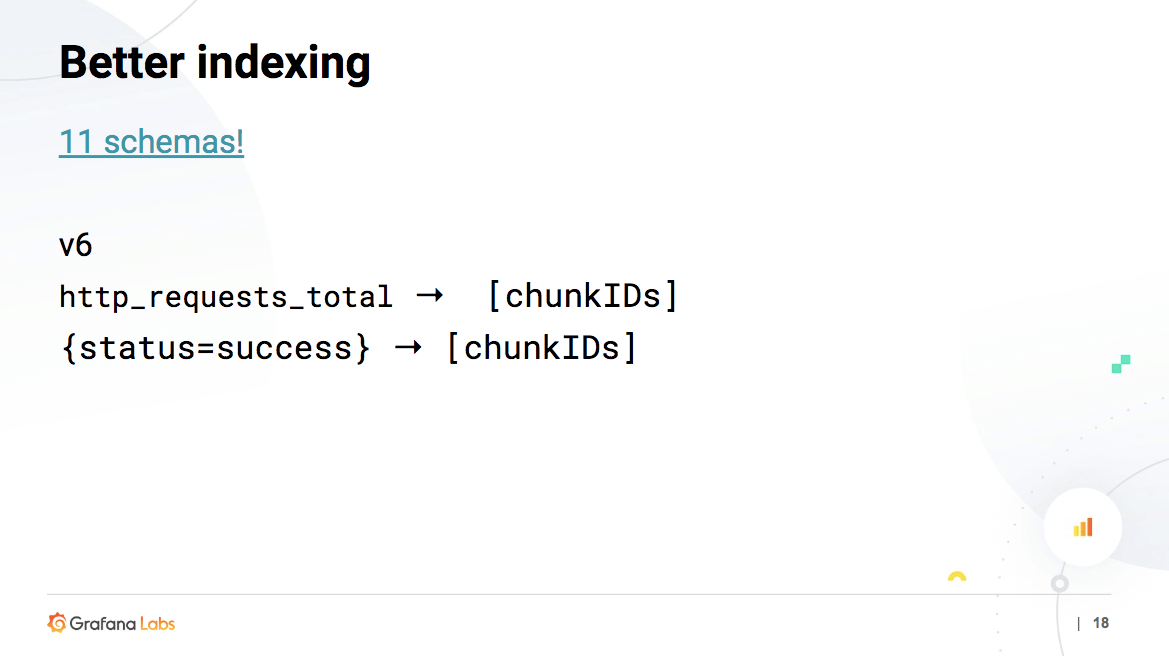
So V9 was born, where the mapping went from metric name to series name and then series name to series to chunk IDs. This reduced the row size by a factor of 3-6.
While it solved the issue, the size was still huge, so V10 was created to split everything into 16 rows. “Instead of querying one row, we actually have a prefix (0-16) attached to the row, and we hash the series IDs and just split the rows 16x,” he explained. “At query time, we query all 16x rows back, so our rows are now usable and we can support a single metric having like 7 million series or 8 million series and you can still query them and all of that works, which is pretty cool.”
While there is a V11 in the works, the team is also developing a new schema that emulates the Prometheus TSDB schema.
Optimizing Efficiency
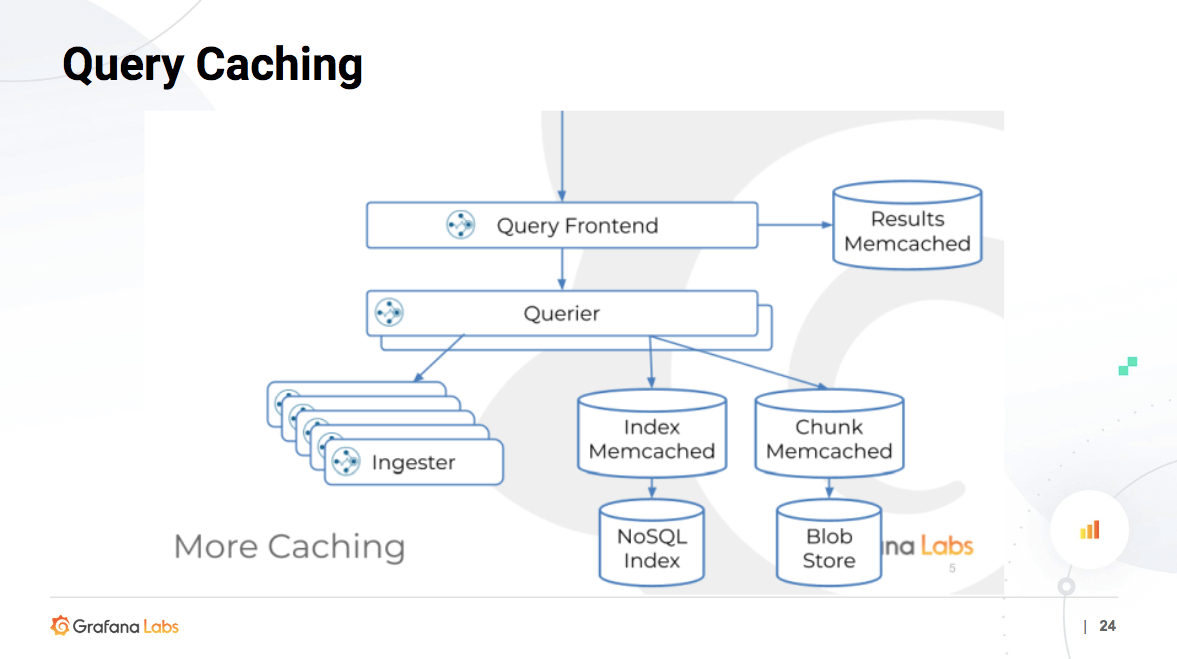
The reason behind the metric name to series ID matching was that many of the queries were just metric names. While the index lookups weren’t timing out, they were taking a minute or two to process. So the team decided to start index caching.
Previously, there was no cache except for the chunk cache that made sure Cortex didn’t hit S3 too much. “If you query from S3, it’ll cost you money and querying from S3 is slow,” he said. The team decided to extend the caching to other things. “So we started adding caches left, right and center. For two months, we were just adding caches.”
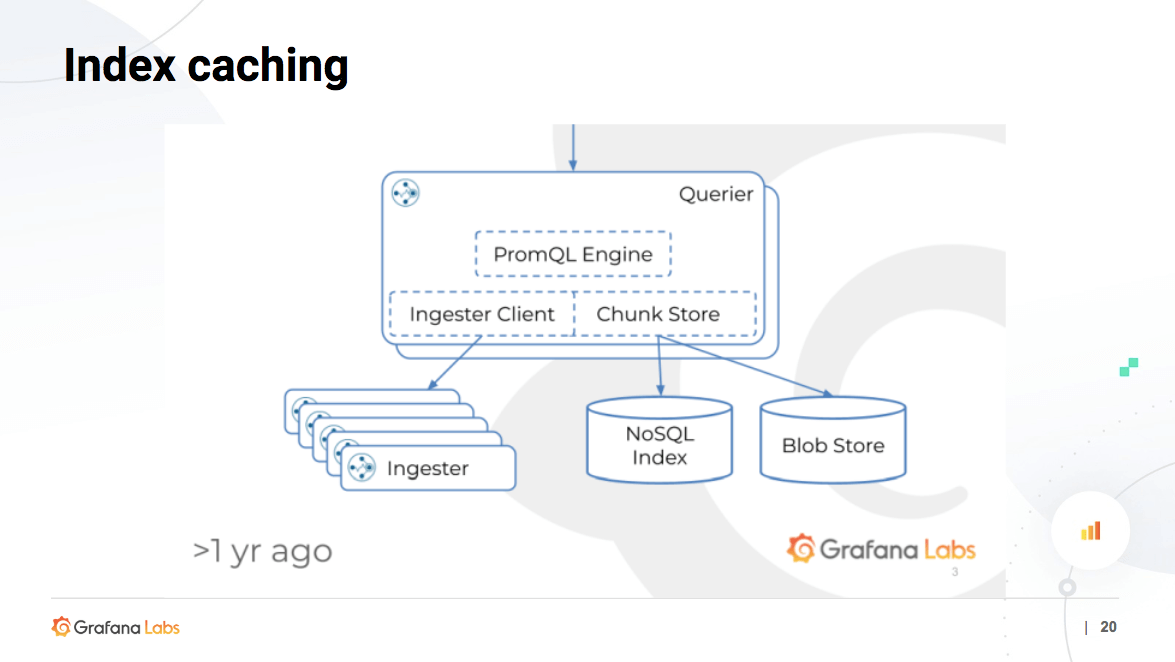
In order to keep track, an index cache was added but it turned out that there was undue stress on Bigtable due to the writes. That’s when they realized three different ingesters were flushing the same chunk because of replication rate. “So when you flush a chunk, you flush the chunk, then you flush the chunkIDs and labels index. So flushing a chunk is not a single operation. It’s like a sum of the chunk flush rate and index flush rate. Now we might have three different chunk IDs depending on the contents.”
The chunk ID might differ a bit, but the labels would still be the same — but then they would be written again, so it was just overwriting existing data while taking up Bigtable’s CPU.
To solve that, Veeramachaneni says they wrote the index cache for writes in such a way that rows are only written once — and there’s now a check in place to make sure that everything was written only once. Once the caches were added, everything sped up and Bigtable CPU utilization dropped to 20 percent.
Still, there was room for improvement, so they implemented query caching, which was just like querying Prometheus for a start time, end time and step. “The idea is essentially you have the exact same data, but you have an additional bit at the end for the last 10 seconds, which means you can still return this entire data from cache,” he explained, noting most people use Grafana on a 10-second or five-second refresh.
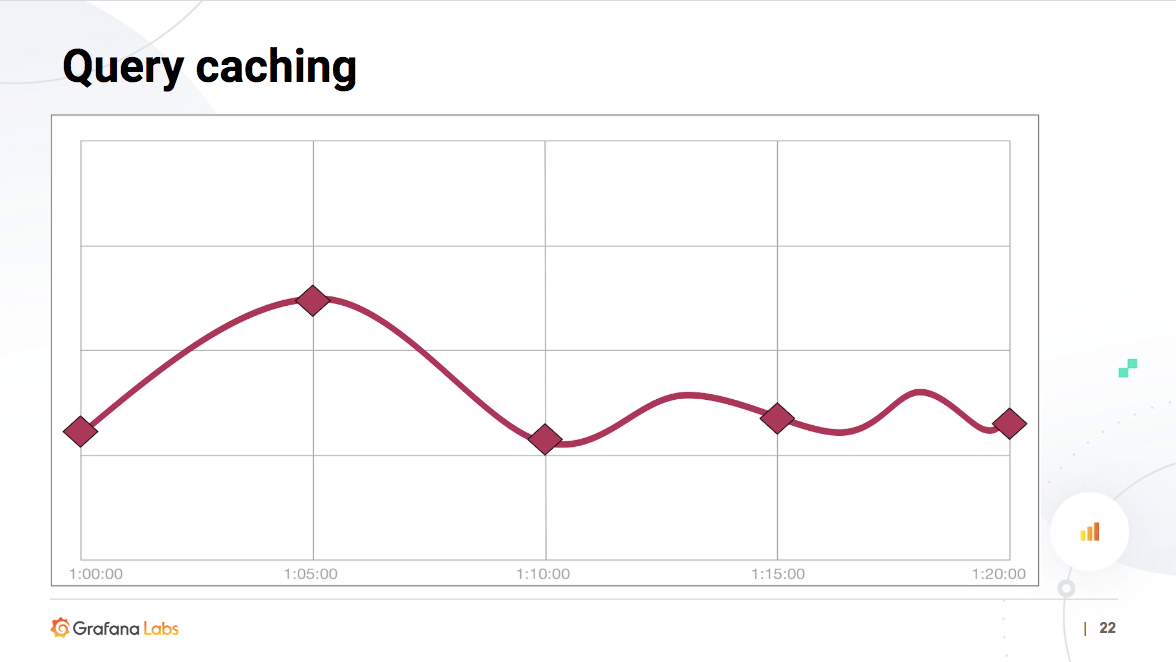
While the inspiration was from Trickster, they added the new front end index caching with a results cache.
To speed things up further, they also turned to query parallelization. “So essentially when you get a 30-day query, which is common, or a one-year query, and we need to load all the data from that one year into a single querier and execute all of that in a single thread,” he explained. So they split things up by day since that’s how the index is built (the prefix is the day). “If you split things by day, we always hit different parts of the index and this ensures that no two queriers process the same thing again or hit the same things.”
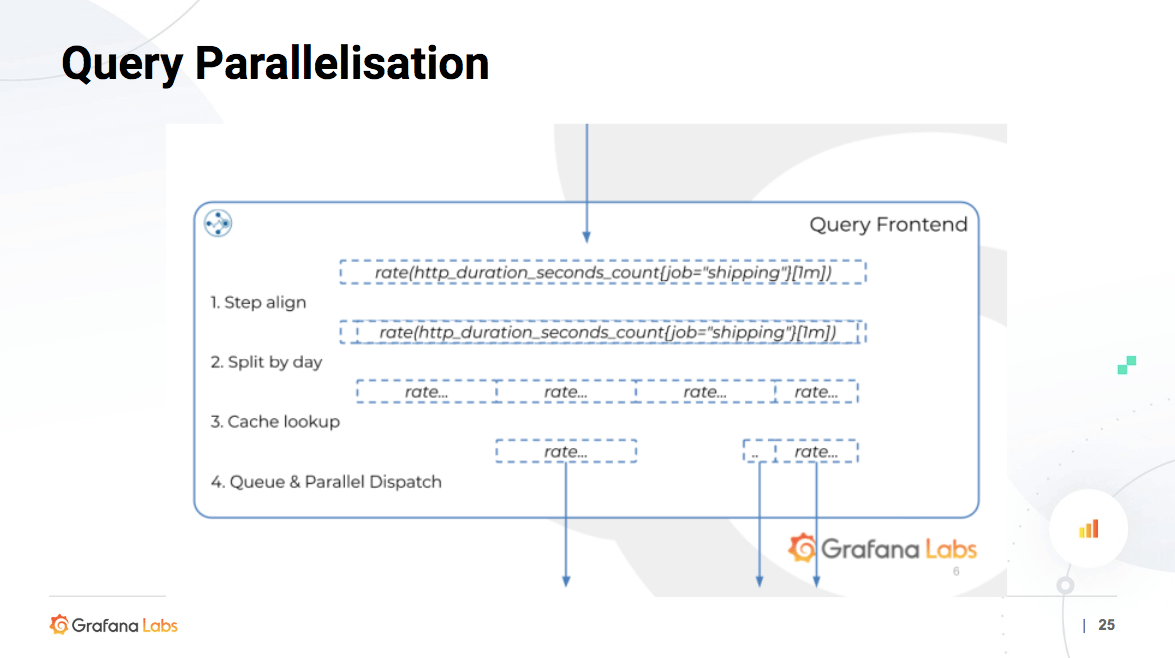
The ability to process 30 queries in parallel for a 30-day query finally brought things up to speed — and also satisfied customers, no matter their volume.
Works in Progress
The current version of Cortex has already morphed from very simple architecture into something that can efficiently process and store large volumes long term, but Veeramachaneni and his team have a list of action items to continue improving the open-source project.
On the list: gossip for the ring, removing etcd/Consul, more query parallelization, deletions, WAL, centralized limited and reimagining the project with a TSDB blocks as the core.
While the query frontend is already usable in Thanos, the ability to delete is still in progress and should be available early this year.
He also described the importance of having centralized limits for a multi-tenant program so that one user doesn’t overwhelm the system, as well as working with the consistency guarantees of Consul by using Gossip for the ring.
The Future of Cortex
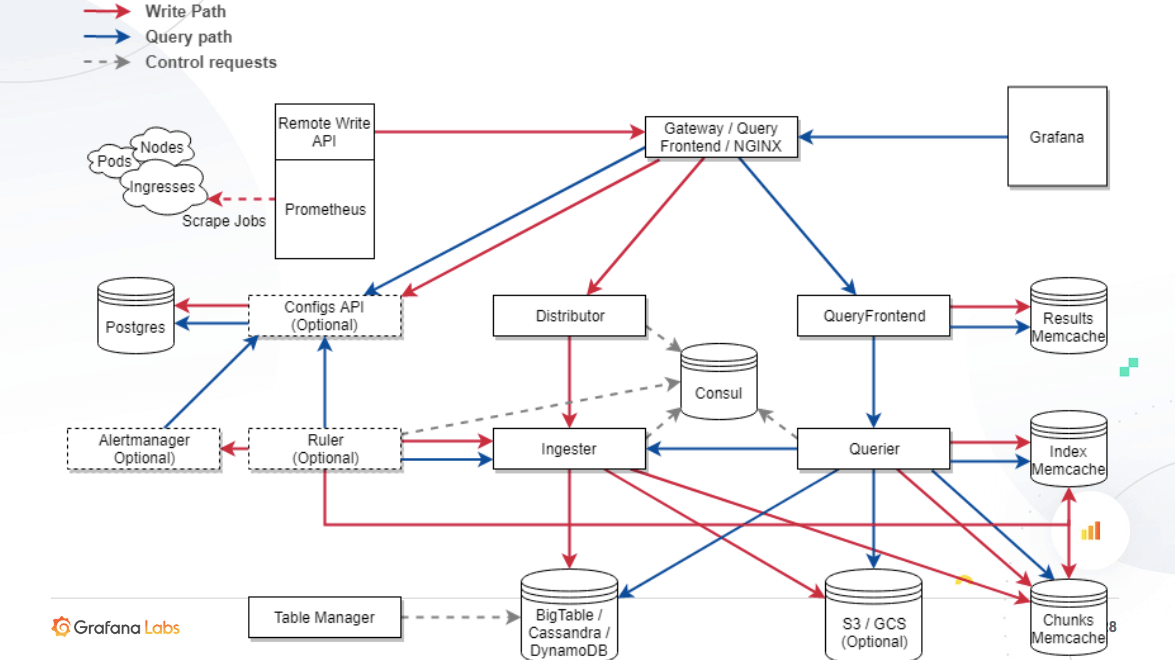
“Essentially, there’s your Prometheus that writes to a front end that does authentication, writes to the distributor and ingestes and there’s a Consul,” he said, adding that it’s now also supported by Bigtable, Cassandra, DynamoDB, GCS and S3. “You see a bunch of caches and then we also have an alerting and ruling component that is where you can send your alerts.”
Everything should be simple to operate with alerts, dashboards, logs, traces and postmortems, but he admitted that sometimes it’s just about getting familiar with it all. “It does take some time to get confidence in the system, but once you have that, it’s fine.”
“The main use case I see for Cortex is in multi-tenant environments in enterprises, so in enterprises you typically see people moving towards a central metrics team or observability team that takes care of everyone else’s monitoring,” he says. “You can have different teams. They all push to the central area, you get centralized alerts, centralized dashboards, and the central monitoring team knows how many metrics each team is producing.”
So down the road, he emphasized the focus will be on TSDB inside Cortex, no dependencies, alerts as part of the UI and an open-source billing and auth that big enterprises can just adopt.
For TSDB inside Cortex, let’s consider Thanos: there’s Prometheus with a sidecar and a central object storage system. Once Prometheus persists the block to disk, the sidecar then uploads it to an object storage.
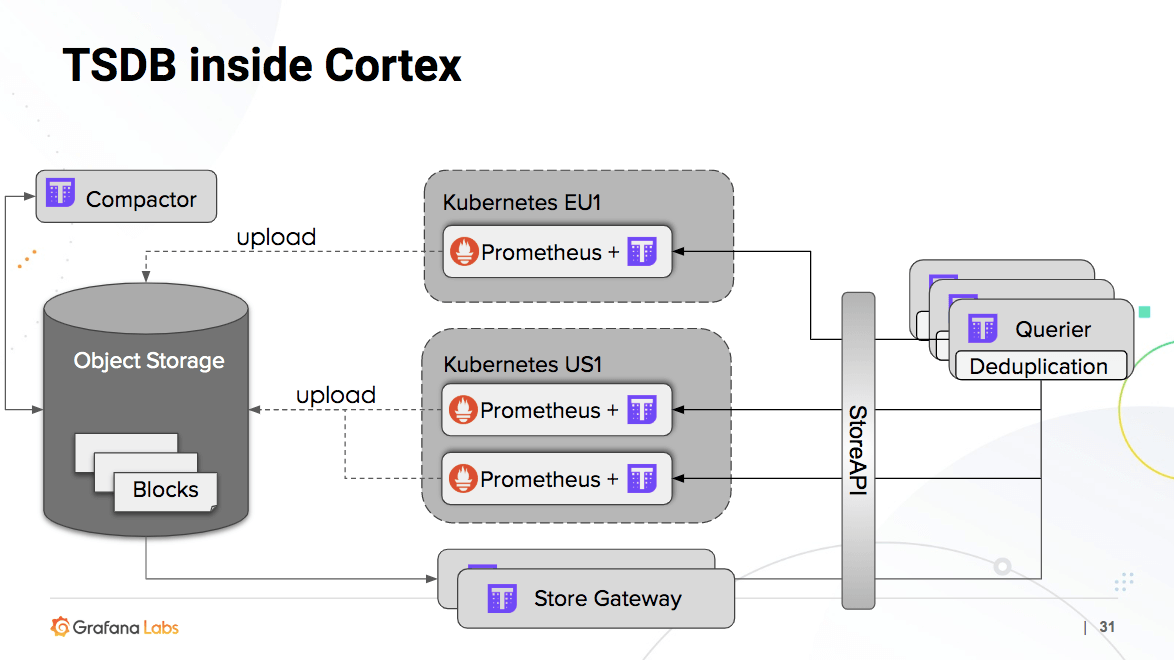
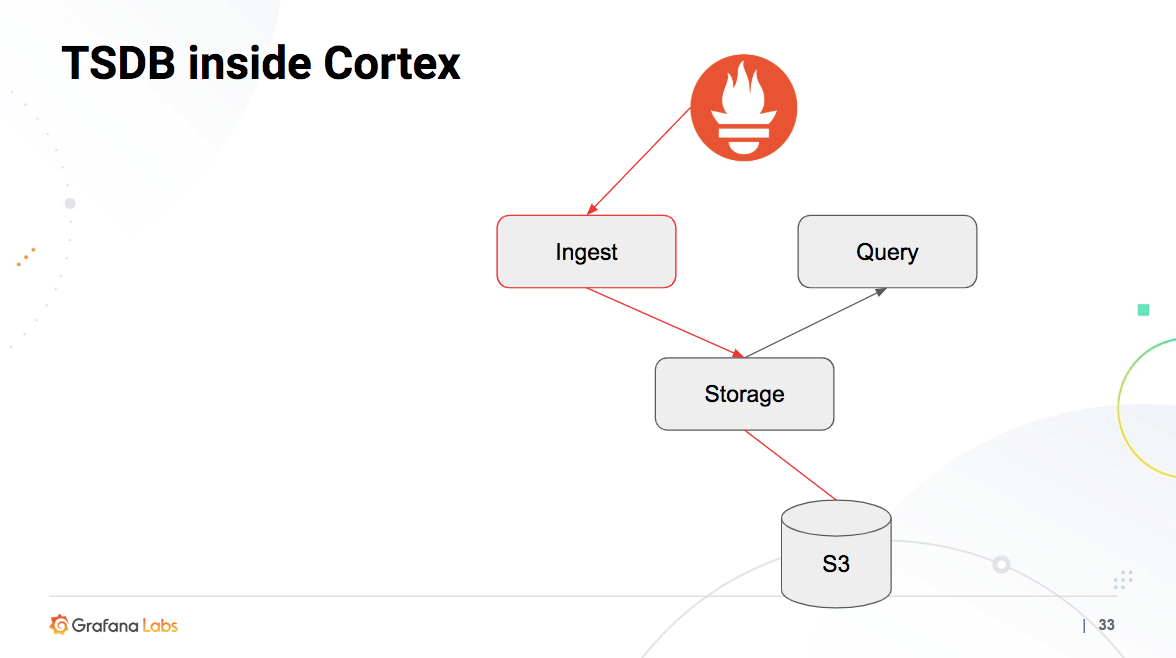
“So one of the reasons why Cortex is extremely fast is because of the NOSQL system. Bigtable is very good for the index, but for Thanos, we have to hit an object store, which is slow,” said Veeramachaneni, who added that the team is working with Thanos to remove the performance bottlenecks. “Hopefully by the end of Q1, we want to have this somewhere in our production system, just to compare performance.”

