Everything You Need to Know About the Grafana-Prometheus-GitLab Integration
Grafana + Prometheus + GitLab = <3
You probably missed it.
Don’t feel bad. It was just one small paragraph, buried in the GitLab 11.9 Omnibus Release Notes:
Grafana is now bundled in our Omnibus package, making it easier than ever to understand how your instance is performing.
“Omnibus” is what GitLab calls its main installation package, and “Grafana” is the time-series visualization software, but what does this paragraph even mean?
To find out more, we turned to Ben Kochie, Site Reliability Engineer at GitLab. He’s one of the people responsible for this development, since he joined the company to work on the monitoring feature set within GitLab.
About three years ago, with the integration of GitLab.com, the GitLab crew realized they needed a monitoring system to manage the oodles of metrics associated with all things GitLab. That’s when Prometheus got its start within GitLab.
GitLab started bundling Prometheus into the Omnibus install so GitLab users could take advantage of the great monitoring features provided by Prometheus. Since then, every installation of GitLab comes with a Prometheus server.
About a year ago, the GitLab.com team realized that metrics are not very useful without dashboards. So they started to integrate the Grafana service to help customers visualize data without having to manually install Grafana. And now they’ve made this integration part of the Omnibus package.
There are two different parts of the integration of GitLab with Prometheus:
- Monitoring GitLab software (the Omnibus)
- Monitoring individual GitLab apps in Kubernetes
Grafana/Prometheus and the Omnibus
GitLab’s service-oriented architecture lends itself to using Prometheus as a monitoring system. All the various components of the GitLab software expose Prometheus endpoints so that GitLab can collect the data. According to Ben, it was a natural fit.
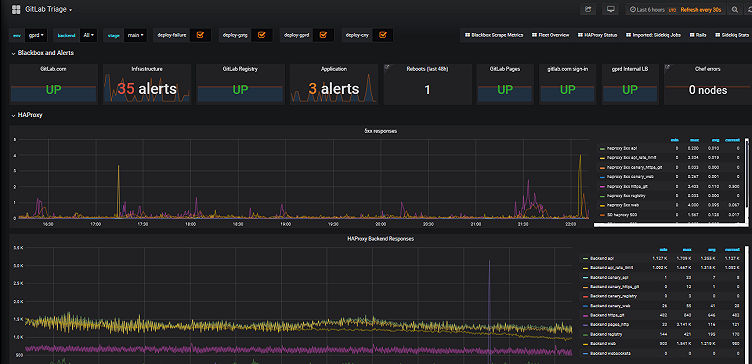
In the spirit of being, in Ben’s words, a “ridiculously transparent company,” GitLab makes its Grafana dashboards public.

Grafana/Prometheus and Your Apps
The GitLab team wanted to build monitoring as a service into GitLab as part of the toolkit for developers. If you build your app with GitLab CI, and you use GitLab CI to deploy the app, then GitLab also deploys a Prometheus installation to monitor your app in production.
If you use self-managed GitLab, it includes Prometheus and Grafana. You can go to GitLab.com, connect your account to a Kubernetes cluster with an API key, and launch jobs in your Kubernetes cluster from GitLab.com. Pretty cool, right?
Refer to the Monitoring GitLab with Prometheus docs for more information.
What Does This Mean for GitLab Users Now?
The integration is pretty complete at this point; there’s not much else to expand or do with it. Now it’s just a matter of letting users know that the integrations are there so they can take advantage of them.
GitLab has a team that manages and updates dashboards. Users can install their own plugins in theory, but that has not been tested. According to Ben, the defaults are reasonable, and the dashboards are there and provisioned. Everything just works.
For more information, refer to the GitLab documentation about the Grafana Dashboard Service. Note: Some dashboards do not work due to slow queries or because they are trying to access non-public data. The GitLab setup is still interesting and educational, though!
Are you using Grafana dashboards with GitLab? Let us know what you think!
