
Pro Tips: Dashboard Navigation Using Links
Great dashboards answer a limited set of related questions. If you try to answer too many questions in a single dashboard, it can become overly complex. As a consequence, a single dashboard often can’t tell the whole story. So you end up navigating between several, and it can be quite inefficient to search for a particular dashboard every time you need it.
Luckily, there are some hacks for navigating between dashboards.
For starters: Did you know that you can search for a dashboard, no matter where you are, by pressing S and O on your keyboard?
In this article, we’ll look at how you can use links to navigate between commonly used dashboards. Links let you create shortcuts to other dashboards and even external websites.
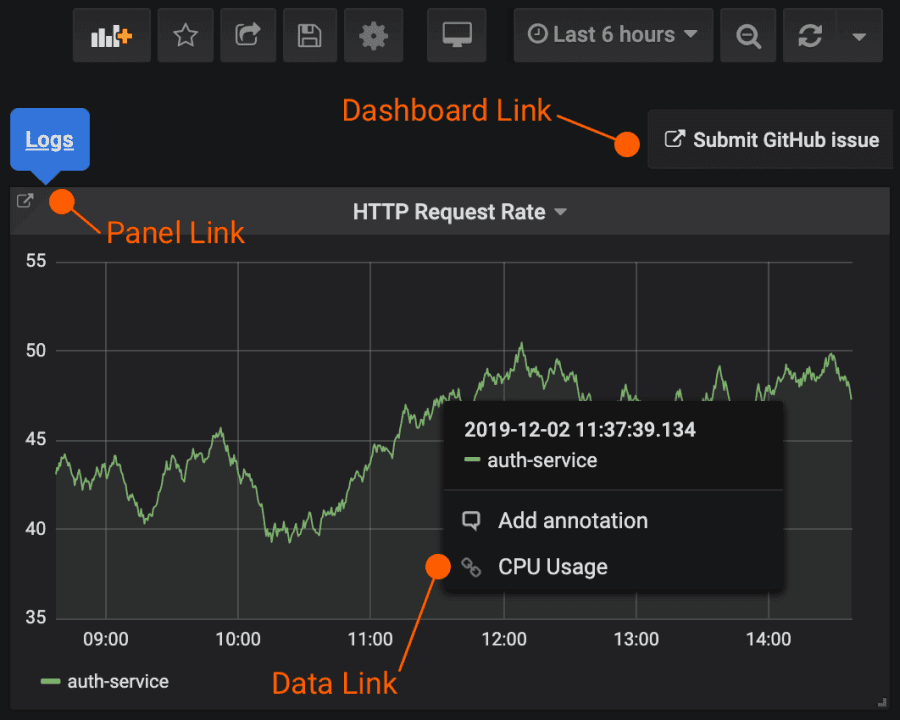
Grafana supports three types of links: Dashboard Links, Panel Links, and Data Links. They are all available from your dashboard.
Dashboard Links
Imagine you have a dashboard displaying HTTP request rates and errors for your services. You’ve zoomed in on an interval with several errors, and you suspect it’s related to the underlying hardware. Using Dashboard Links, you can create a shortcut to a dashboard displaying resource usage for the host machines where the service is running.
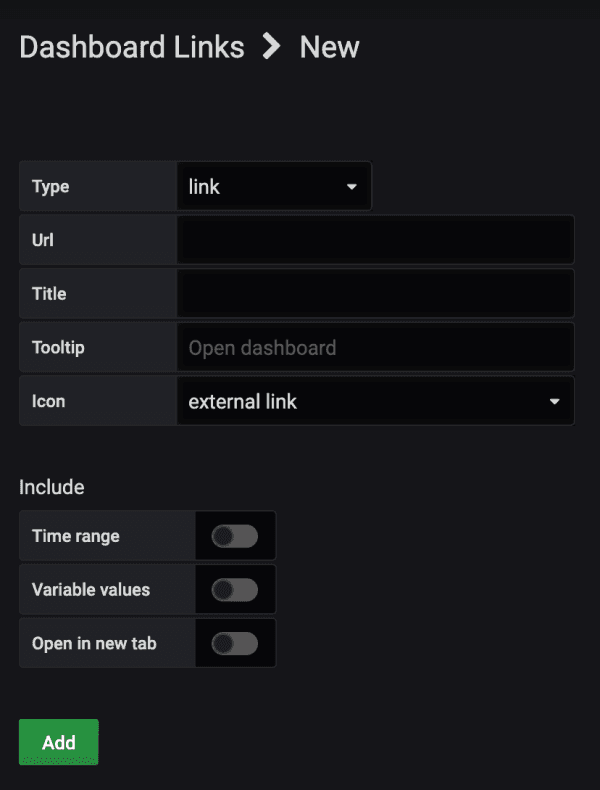
When you create a Dashboard Link, you have the option to include the time range and current template variables to directly jump to the same context in another dashboard. This way, you don’t have to worry whether you’re looking at the right data.
They can also be used as shortcuts to external systems, such as submitting a GitHub issue with the current dashboard name.
To add a Dashboard Link, go to Dashboard settings -> Links, and click New. Once you’ve added a Dashboard Link, it will appear in the upper right corner of your dashboard.
To see an example of Dashboard Links in action, check out this demo.
Panel Links
Often, Dashboard Links are all you need for linking between dashboards. But imagine that you have a high-level dashboard with several panels representing different systems, and you want to link to separate dashboards for each system. With Dashboard Links, it’s not always obvious which link to click to drill down into that service. Instead, use Panel Links to create a link from a specific panel. That way, it’s easier to find the drill-down link for that system.
Each panel can have its own set of links that will appear in the upper left corner of your panel. To add a Panel Link, open the General tab in the panel settings and find the Panel Links section.
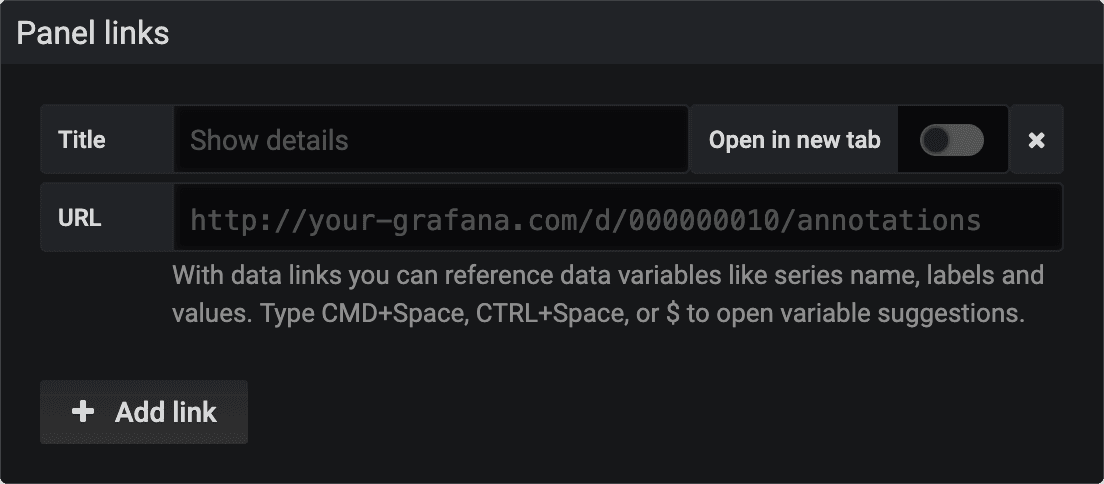
You can even add one of the template variables that are available. Press Ctrl + Space in the URL field to see the available variables. By adding template variables to your Panel Link, the link sends the user to the right context, with the relevant variables already set. You can even control the time range to ensure the user is zoomed in on the right data.
To see an example of Panel Links in action, check out this demo.
Data Links
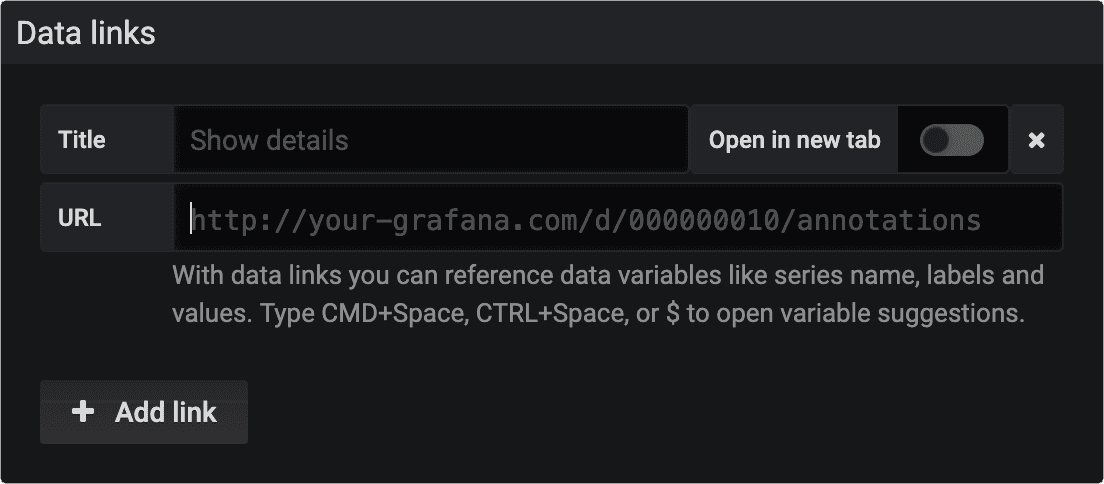
Data Links, which were recently added to Grafana, allow you to provide even more granular context to your links. You can create links that include the series name or even the value under the cursor. Currently, Data Links are only supported in the Graph, Gauge, and Bar Gauge visualizations.
To add a Data Link, go to the Visualization tab in the panel settings, and find the Data Links section. Click on a point in your graph to access your Data Links. Your links appear in the context menu.
To see an example of Data Links in action, check out this demo. Refer to the documentation for more information on Data Links.
Which Should You Use?
To understand what links you should use in your Grafana install, start by figuring out how you’re currently navigating between dashboards. If you’re often jumping between a set dashboards and struggling to find the same context in each, links can help you optimize your workflow.
The next step is to figure out which link type is right for your workflow. Even though all the link types in Grafana are used to create shortcuts to other dashboards or external websites, they work in different contexts:
- If the link relates to most if not all of the panels in the dashboard, use a Dashboard Link.
- If you want to drill down into specific panels, the Panel Links are your friend.
- If you want to drill down into a specific series, or even a single measurement, you’ll want to use Data Links.
Make sure to check back for more ways to improve your Grafana workflow!

