
How to Do Automatic Annotations with Grafana and Loki
Grafana annotations are great! They clearly mark the occurrence of an event to help operators and devs correlate events with metrics. You may not be aware of this, but Grafana can automatically annotate graphs by querying Loki. Here’s a look at how to use this feature.
Grafana Loki Annotations
Loki queries can be used to automatically generate annotations on Grafana dashboards since 6.4.0. For every log line that is returned from a query, the text is automatically displayed as an annotation at the appropriate time.
To add an annotation query, simply navigate to Dashboard Settings -> Annotations -> New and select a Loki data source. Type a query that selects log lines you want to show up as annotations, and you’re ready to go:

Note that we are explicitly querying any changes to a deployment named ingester in the loki namespace. If we query these logs directly, they look like this:

kubernetes-diff-logger
In the above example, we are querying lines logged by an application called the kubernetes-diff-logger. This is a simple open source application that logs any changes to a set of Kubernetes objects we want to watch. It currently supports watching deployments, statefulsets, and daemonsets but could easily be extended to support more. Feel free to jump in and contribute!
The raw output of the logger looks like this:
{"timestamp":"2019-10-30T12:48:52Z","verb":"updated","type":"deployment","notes":"[Template.Spec.Containers.slice[0].Image: grafana/loki:master-d5758e3 != grafana/loki:master-d080e46]","name":"ingester","namespace":"tempo-dev"}
{"timestamp":"2019-10-30T13:38:59Z","verb":"updated","type":"deployment","notes":"[Template.Spec.Containers.slice[0].Image: grafana/loki:master-d080e46 != grafana/loki:master-38d803a]","name":"ingester","namespace":"tempo-dev"}
{"timestamp":"2019-10-30T18:35:54Z","verb":"updated","type":"deployment","notes":"[Template.Spec.Containers.slice[0].Image: grafana/loki:master-38d803a != grafana/loki:master-dd4c138]","name":"ingester","namespace":"tempo-dev"}
Notice that this application is logging in JSON. Let’s use Promtail next to extract key fields that we can query directly as Loki labels.
Promtail Configuration
Promtail includes a highly configurable pipeline that we will use to extract JSON fields as Loki labels and rewrite the log line itself.
  - match:
      selector: '{name="kube-diff-logger"}'
      stages:
      - json:
          expressions:
            diff_name: name
            diff_namespace: namespace
            diff_type: type
            diff_verb: verb
            notes: notes
            timestamp: timestamp
      - timestamp:
          format: RFC3339
          source: timestamp
      - labels:
          diff_name: ""
          diff_namespace: ""
          diff_type: ""
          diff_verb: ""
      - output:
          source: notes
This configuration extracts the name, namespace, type and verb JSON fields and makes them available for direct querying using a Logql query like this:
{container_name="kube-diff-logger", diff_namespace="loki", diff_type=”deployment”, diff_name="ingester"}Also, the output step will rewrite the log line with just the value of the notes field. This is important because it will be used as the note for the annotation as shown below.
Putting the Pieces Together
Now that we have set up our annotation query and are logging the desired events, we should start seeing annotations on our dashboards.
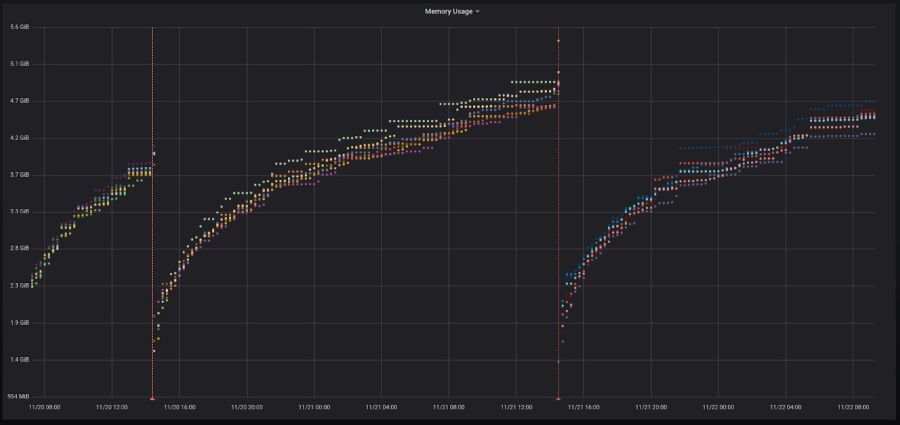
The below memory usage dashboard is showing annotations when our Loki ingester deployment updates. Naturally this correlates with memory usage resetting because the Kubernetes pods are rolling. With this technique, you can correlate changes to latency, success rates, or any other metrics directly to changes in your deployments.

Mousing over the annotation shows the exact change! In this case, the image was changed; i.e., a new version of the application was built and rolled out.

Final Thoughts
Automatic annotations are a fantastic way to guarantee that any changes to your application’s Kubernetes infrastructure are clearly marked on your Grafana graphs. Give it a try today!
Also, if kubernetes-diff-logger is lacking some features you are interested in, feel free to submit an issue or PR. It’s a small project with a lot of potential and a fun way to get involved in open source development!